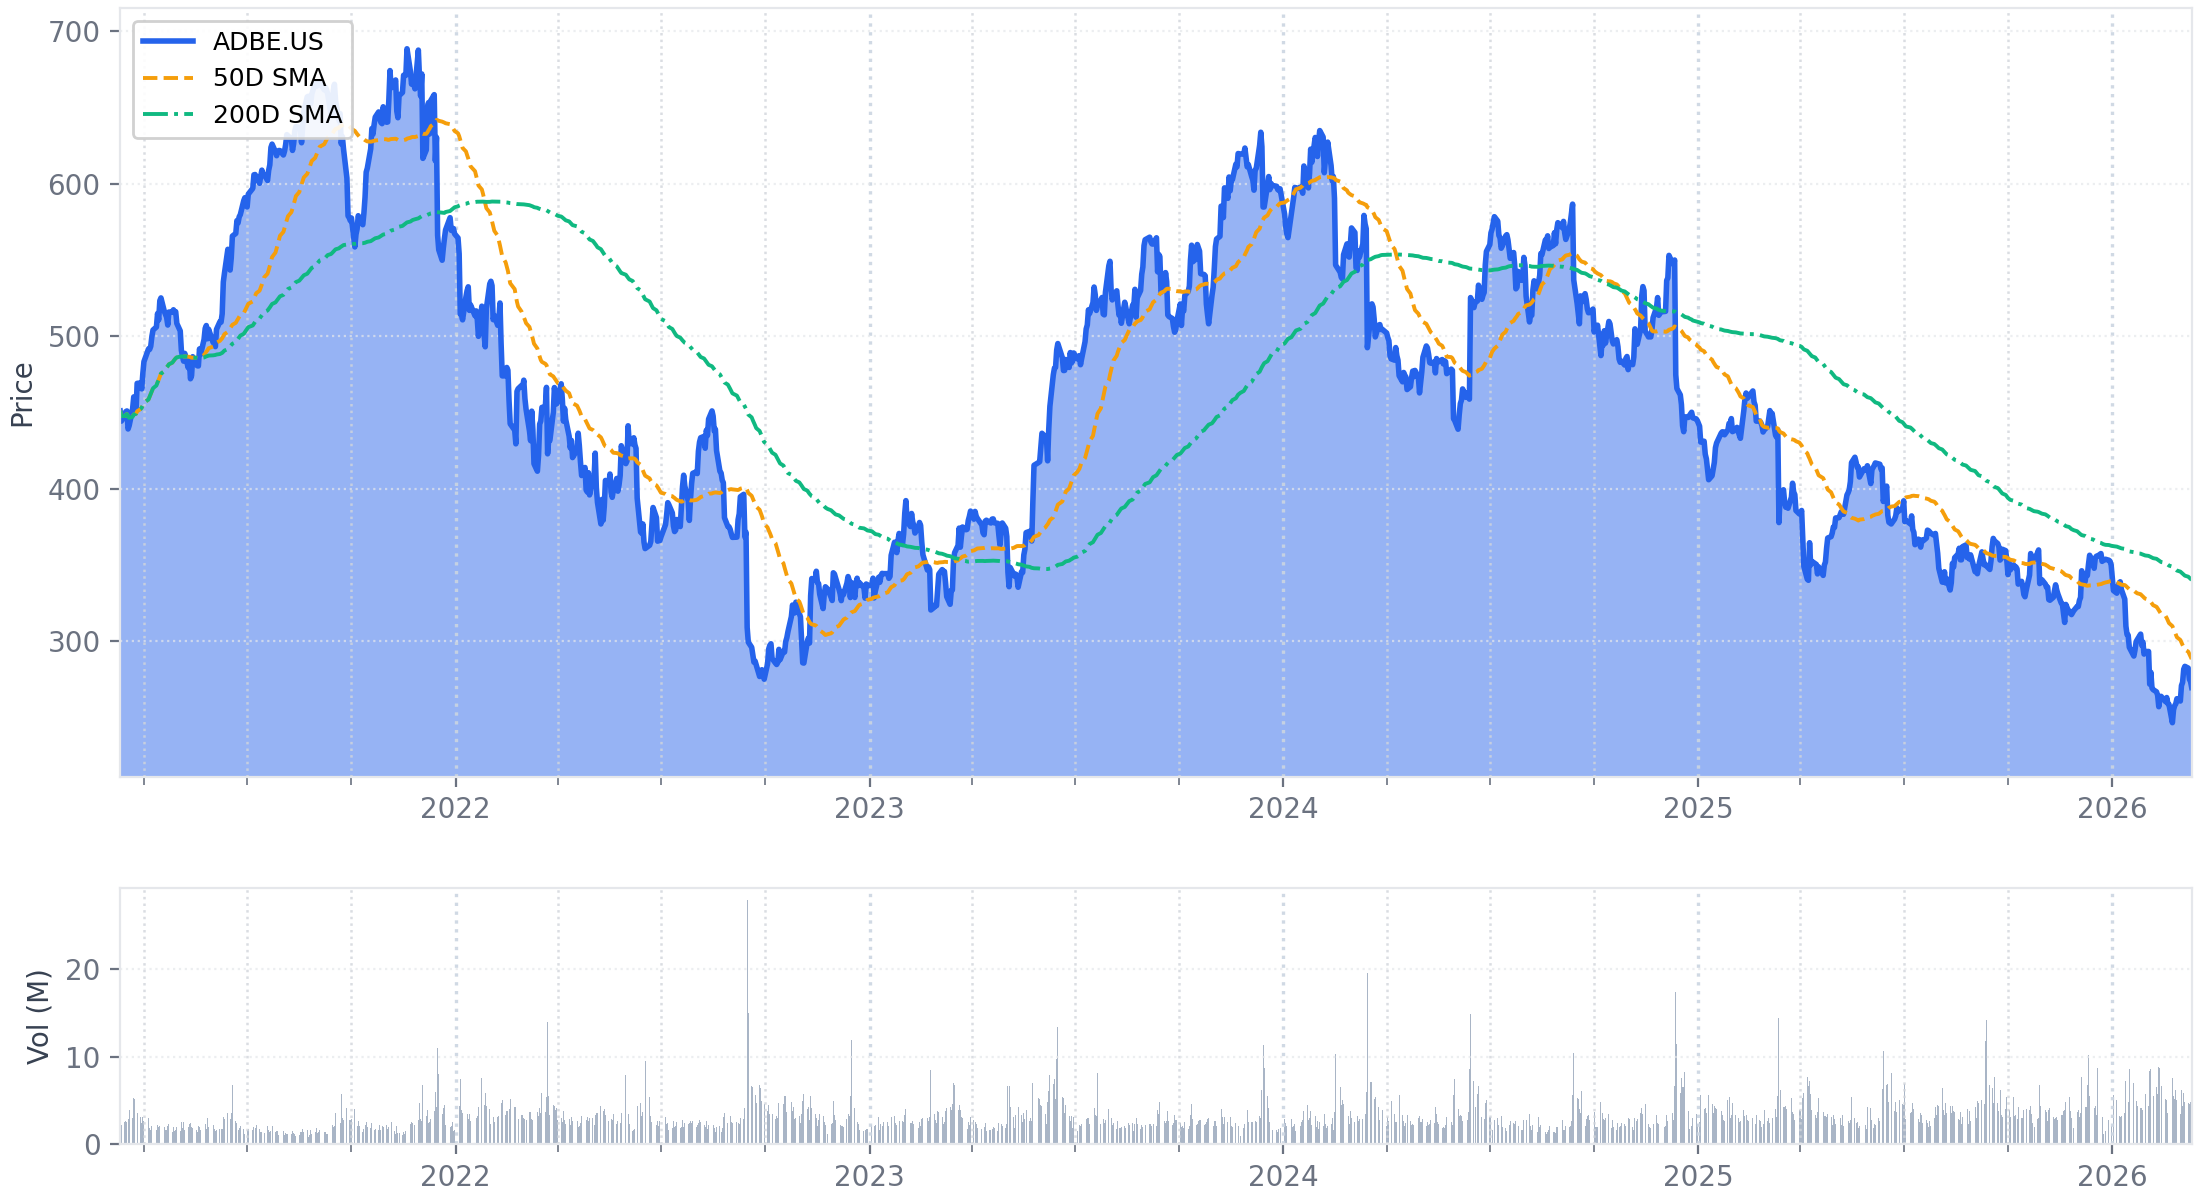
Executive Summary
Adobe reported record Q1 revenue of $6.40 billion (↑12% YoY) and non-GAAP EPS of $6.06 (↑19% YoY), surpassing prior guidance. The results were accompanied by the landmark announcement that CEO Shantanu Narayen will transition from his role after 18 years, once a successor is named.
Management outlined a deliberate strategic "phase shift," prioritizing user acquisition over immediate recurring revenue. This resulted in "dampened" near-term net new ARR of $400 million. The strategy is validated by total MAUs growing 17% YoY to over 850 million, with creative freemium MAUs accelerating to 50% YoY growth. Performance was also impacted by a newly disclosed headwind: a steeper-than-expected decline in the ~$450 million traditional stock business.
Offsetting these factors, ARR from AI-first applications more than tripled year-over-year, and key enterprise solutions like GenStudio and AEP grew over 30%. Adobe reaffirmed its full-year fiscal 2026 guidance, including its target for 10.2% ARR growth. This signals strong confidence that the expanded user base will drive an acceleration in ARR through the remainder of the year.
1. Financial Performance Summary
A. Income Statement Metrics
Adobe reported record Q1 revenue of $6.40 billion, representing 12% YoY growth (11% in constant currency), and non-GAAP EPS of $6.06, an increase of 19% YoY. Both revenue and non-GAAP EPS surpassed the high end of management's prior guidance. The performance was driven by 13% growth in total subscription revenue, with notable strength in the Business Professionals & Consumers group, which grew 16% YoY.
| Metric | Q1 2026 | Q1 2025 | Change | Notes |
|---|---|---|---|---|
| Total Revenue | $6.40B | $5.71B | ↑ 12.0% | Beat guidance of $6.25B–$6.30B (from Q4-25 transcript). Grew 11% in constant currency. |
| - Subscription Revenue | $6.20B | $5.48B | ↑ 13.1% | Represents 97% of total revenue. |
| - Business Professionals & Consumers Subscription | $1.78B | $1.53B | ↑ 16.3% | Grew 15% in constant currency. Growth drivers included Acrobat and Express MAU growth and upgrades to Acrobat Studio. |
| - Creative & Marketing Professionals Subscription | $4.39B | $3.92B | ↑ 12.0% | Grew 11% in constant currency. Driven by CC Pro, GenStudio, and AEP & apps. |
| Gross Profit | $5.73B | $5.09B | ↑ 12.6% | Gross margin was 89.6%, a slight improvement from 89.1% in the prior-year period. |
| GAAP Operating Income | $2.42B | $2.16B | ↑ 11.8% | GAAP operating margin was 37.8%, compared to 37.9% in the prior-year period. |
| Non-GAAP Operating Income[1] | $3.04B | $2.72B | ↑ 11.8% | Non-GAAP operating margin was 47.4%, compared to 47.5% in the prior-year period. |
| GAAP Net Income | $1.89B | $1.81B | ↑ 4.3% | — |
| Non-GAAP Net Income[2] | $2.49B | $2.22B | ↑ 11.9% | — |
| GAAP EPS (Diluted) | $4.60 | $4.14 | ↑ 11.1% | Met the high end of guidance of $4.55–$4.60 (from Q4-25 transcript). |
| Non-GAAP EPS (Diluted)[3] | $6.06 | $5.08 | ↑ 19.3% | Beat guidance of $5.85–$5.90 (from Q4-25 transcript). |
Footnotes
- Non-GAAP Operating Income reconciliation: GAAP Operating Income of $2.42B excludes stock-based compensation ($514M), amortization of intangibles ($39M), acquisition-related expenses ($2M), and a loss contingency ($62M). Total adjustments of $617M represent 25.5% of GAAP Operating Income.
- Non-GAAP Net Income reconciliation: GAAP Net Income of $1.89B excludes stock-based compensation ($514M), amortization of intangibles ($39M), acquisition-related expenses ($2M), a loss contingency ($62M), net investment gains (-$5M), and includes income tax adjustments (-$13M). Total net adjustments of $599M represent 31.7% of GAAP Net Income.
- Non-GAAP EPS reconciliation: GAAP EPS of $4.60 excludes stock-based compensation ($1.25), amortization of intangibles ($0.10), a loss contingency ($0.15), and includes adjustments for investment gains (-$0.01) and income taxes (-$0.03). Total net adjustments of $1.46 represent 31.7% of GAAP EPS.
B. Balance Sheet Highlights
Adobe ended the quarter with a net cash position of $234 million, a sequential improvement from a net debt position of $53 million at the end of FY2025. The company's cash and short-term investments increased by $295 million sequentially to $6.89 billion.
| Metric | Feb 27, 2026 | Nov 28, 2025 | Change | Notes |
|---|---|---|---|---|
| Cash & Short-Term Investments | $6.89B | $6.60B | ↑ 4.5% | Cash position increased despite significant share repurchases. |
| Total Debt[1] | $6.66B | $6.65B | Flat | Total debt remains stable quarter-over-quarter. |
| - Debt | $6.23B | $6.21B | ↑ 0.3% | Includes current and long-term portions. |
| - Operating Lease Liabilities | $0.43B | $0.44B | ↓ 2.3% | Includes current and long-term portions. |
| Net Cash (Debt)[2] | $234M | ($53M) | Shift to Net Cash | Shifted back to a net cash position due to strong cash flow generation. |
| Trade Receivables, Net | $2.09B | $2.34B | ↓ 10.7% | Decrease is consistent with seasonal patterns post-Q4. |
| Deferred Revenue | $7.37B | $7.03B | ↑ 4.8% | Indicates continued growth in subscription billings. |
| Shareholders' Equity | $11.43B | $11.62B | ↓ 1.6% | Decrease primarily reflects the impact of treasury stock repurchases. |
Footnotes
- Total Debt is a calculated metric: Debt (current + long-term) + Operating Lease Liabilities (current + long-term).
- Q1 2026: $849M + $5,379M + $84M + $344M = $6,656M.
- Q4 2025: $0M + $6,210M + $77M + $361M = $6,648M.
- Net Cash (Debt) is a calculated metric: (Cash and cash equivalents + Short-term investments) - Total Debt.
- Q1 2026: ($6,332M + $558M) - $6,656M = $234M (Net Cash).
- Q4 2025: ($5,431M + $1,164M) - $6,648M = ($53M) (Net Debt).
C. Cash Flow Analysis
The company generated a record Q1 operating cash flow of $2.96 billion, an increase of 19% YoY. After capital expenditures, Free Cash Flow was $2.92 billion. Adobe returned significant capital to shareholders, repurchasing approximately 8.1 million shares for $2.48 billion during the quarter.
| Metric | Q1 2026 | Q1 2025 | Change | Notes |
|---|---|---|---|---|
| Operating Cash Flow | $2.96B | $2.48B | ↑ 19.2% | Management noted this was a record Q1 figure. |
| Share-Based Compensation | $509M | $475M | ↑ 7.2% | Represents 17.2% of Q1 Operating Cash Flow. |
| Capital Expenditures | ($37M) | ($26M) | ↑ 42.3% | — |
| Free Cash Flow (FCF)[1] | $2.92B | $2.46B | ↑ 18.9% | Represents a strong FCF margin of 45.7% of Q1 revenue. |
| Share Repurchases | ($2.48B) | ($3.25B) | ↓ 23.7% | Repurchased approximately 8.1 million shares in the quarter. |
Footnotes
- Free Cash Flow is a calculated metric: Net cash provided by operating activities - Purchases of property and equipment. For Q1 2026: $2,958M - $37M = $2,921M. For Q1 2025: $2,482M - $26M = $2,456M.
D. Key Financial Ratios
Not discussed on the call.
E. Operational Metrics
Adobe's Total ARR grew to $26.06 billion, representing 10.9% YoY growth. The company added $400 million in net new ARR during the quarter. Management highlighted that this result was impacted by a strategic focus on growing Monthly Active Users (MAUs) for freemium offerings, which "dampens ARR in the short term," and a steeper-than-expected decline in the traditional stock business. In contrast, ARR from AI-first applications more than tripled year-over-year, and key enterprise offerings like GenStudio and AEP grew over 30%.
| Metric | Q1 2026 | Q1 2025 | Change | Notes |
|---|---|---|---|---|
| Total Adobe ARR (Ending) | $26.06B | $23.50B[1] | ↑ 10.9% | Grew from a revalued FY25 ending base of $25.66B. |
| Net New Total ARR | $400M[2] | — | — | Management noted near-term ARR was dampened by focus on MAU growth for new freemium offerings. |
| RPO (Ending) | $22.22B | $19.69B | ↑ 12.9% | Grew 13% as reported, 12% in constant currency. |
| cRPO Growth (YoY) | 12% | 11% | +1 ppt | Growth was 11% in constant currency. |
| Total MAU (Acrobat, CC, Express, Firefly) | >850M | ~726M[3] | ↑ ~17% YoY | Management highlighted MAU as a key indicator of adoption and future monetization. |
| Creative Freemium MAU | >80M | — | ↑ 50% YoY | Includes web/mobile versions of Firefly, Express, Premiere, Photoshop, Lightroom. |
| AI-First Applications ARR | — | — | More than tripled YoY | Includes Firefly app and Firefly Enterprise. Firefly-related ARR (app, credit packs, enterprise) now exceeds $250 million. |
| GenStudio & AEP ARR Growth (YoY) | >30% | — | — | Both grew over 30% year-over-year, indicating strong enterprise momentum. |
| Generative Credit Consumption | — | — | ↑ >45% QoQ | Growth was broad-based, with a notable skew toward higher-value video and audio modalities. |
Footnotes
- Q1 2025 Total ARR is an estimated value calculated for comparison. Based on Q1 2025 Digital Media ARR of $17.63B and Creative & Marketing Professionals subscription revenue of $3.92B vs. total subscription revenue of $5.45B, and applying a similar ratio to total ARR.
- Net New Total ARR is a calculated metric: Ending Q1 2026 ARR ($26.06B) - Revalued Ending Q4 2025 ARR ($25.66B from Q4-25 transcript).
- Q1 2025 Total MAU is an estimated value calculated based on the 17% YoY growth rate stated in the Q1 2026 transcript (850M / 1.17).
2. Forward-Looking Guidance
A. Guidance Summary
Adobe introduced guidance for the second quarter of FY2026 and reaffirmed its full-year targets. The company continues to expect 10.2% Total Adobe ARR growth for the full fiscal year. Management noted that the provided targets assume current macroeconomic conditions and do not include any contribution from the pending acquisition of Semrush, which is still expected to close in Q2.
Forward-Looking Guidance (Q2 & FY 2026)
| Metric | Period | Current Guidance | Prior Guidance | Change | Management Commentary |
|---|---|---|---|---|---|
| Total Revenue | Q2 2026 | $6.43B – $6.48B | — | Introduced | — |
| Non-GAAP EPS | Q2 2026 | $5.80 – $5.85 | — | Introduced | — |
| GAAP EPS | Q2 2026 | $4.35 – $4.40 | — | Introduced | — |
| Total Revenue | FY 2026 | $25.90B – $26.10B | $25.90B – $26.10B | Reaffirmed | Guidance from Q4 FY2025 was maintained. |
| Total Adobe Ending ARR Growth | FY 2026 | 10.2% YoY | 10.2% YoY | Reaffirmed | The target implies approximately $2.6 billion of net new ARR for the year. |
| Non-GAAP EPS | FY 2026 | $23.30 – $23.50 | $23.30 – $23.50 | Reaffirmed | Guidance from Q4 FY2025 was maintained. |
| GAAP EPS | FY 2026 | $17.90 – $18.10 | $17.90 – $18.10 | Reaffirmed | Guidance from Q4 FY2025 was maintained. |
B. Additional Notes & Commentary
- Q2 FY2026 Customer Group Subscription Revenue Targets:
- Business Professionals & Consumers: $1.80 billion – $1.82 billion
- Creative & Marketing Professionals: $4.41 billion – $4.44 billion
- Q2 FY2026 Margin, Tax Rate & Share Count Assumptions:
- Non-GAAP Operating Margin: ~44.5%
- GAAP Tax Rate: ~22.5%
- Non-GAAP Tax Rate: ~18.0%
- Diluted Share Count: ~402 million
- Monetization Trajectory: Management stated that while the strategic focus on MAU growth for new freemium offerings "dampens ARR in the short term," it sets the company up for accelerated growth in future quarters. The reaffirmation of full-year targets implies an expectation of double-digit ARR growth for the remainder of the fiscal year.
3. Operational & Strategic Developments
A. Business Performance & Operations
Adobe's Q1 performance was characterized by a strategic focus on expanding its user base through freemium offerings, which led to record user engagement but also created a near-term headwind for ARR growth. While enterprise solutions showed continued strength, the company's traditional stock business experienced an accelerated decline.
-
Strategic Focus on User Growth Over Immediate ARR:
- Management explicitly stated that a strategic decision to drive Monthly Active User (MAU) growth for new freemium offerings "dampens ARR in the short term." This was described as a "phase shift" designed to build a foundation for future monetization.
- The company reported record user engagement, with total MAUs across Acrobat, Creative Cloud, Express, and Firefly surpassing 850 million, a 17% YoY increase.
- Creative freemium MAUs accelerated, growing 50% YoY to cross 80 million, up from 35% YoY growth reported in Q4 FY2025.
-
Accelerating AI Adoption & Monetization:
- Generative credit consumption grew over 45% quarter-over-quarter, a continuation of the strong momentum from Q4. Management noted this growth is increasingly skewing toward higher-value modalities like video and audio.
- ARR from AI-first applications more than tripled year-over-year. Firefly-related ARR (including the app, credit packs, and enterprise solutions) now exceeds a $250 million book of business.
-
Enterprise Segment Momentum:
- Enterprise demand remained a key strength, with GenStudio and AEP & apps ending ARR each growing over 30% year-over-year, consistent with the growth rates reported in the prior quarter.
- The number of customers with ARR over $10 million grew by more than 20% year-over-year.
-
Stock Business Headwind:
- Management identified a new, material headwind: the traditional stock business saw a "steeper decline than we expected."
- This business, which represents an approximately $450 million book of business, is seeing a faster-than-planned transition to generative AI.
- To provide context, management noted that excluding the impact of the stock business decline, total ARR growth would have been approximately 11.2% YoY, compared to the reported 10.9%.
B. Strategic Initiatives
The quarter was defined by a landmark leadership announcement and continued execution on Adobe's strategy to become the central orchestration layer in the AI ecosystem through expanded partnerships and platform integrations.
-
Leadership Transition:
- CEO Shantanu Narayen announced his decision to transition from his role after 18 years, once a successor is appointed. He will remain as Chair of the Board to support the transition.
- The Board of Directors has initiated a search for a successor, considering both internal and external candidates. Management indicated the process will likely take a "few months."
-
Expanding the AI Ecosystem:
- Adobe is deepening its platform neutrality by announcing its intent to integrate with leading AI platforms including Anthropic, Google, Microsoft, NVIDIA, and OpenAI. This builds on the open platform strategy highlighted in the prior quarter.
- The company is actively executing its "atomization" strategy by embedding its core capabilities into third-party conversational platforms. In Q1, Adobe launched Acrobat, Express, and Photoshop integrations for ChatGPT and signaled plans for similar integrations with Copilot, Claude, and Gemini.
-
Product & Go-to-Market Strategy:
- New offerings like Adobe Acrobat Studio (combining Acrobat and Express) are seeing a "strong start" in upgrades, particularly within enterprise license renewals.
- Firefly is being positioned as an "all-in-one creative AI studio," integrating models from Adobe, Google, and OpenAI to provide users with choice and flexibility.
C. Risk Factors & Headwinds
- Stock Business Decline (New/Accelerating): The faster-than-anticipated decline in the traditional stock business is a newly disclosed headwind impacting near-term ARR. While management frames this as part of a natural transition to generative AI, its accelerated pace poses a risk to growth if not fully offset by new generative offerings.
- ARR Growth vs. Innovation Perception (Persistent): The Q&A session continued the theme from the prior quarter, with analysts focused on the "dampening" of ARR growth despite strong AI usage and user acquisition metrics. Management's narrative is that this is a deliberate, short-term trade-off to build a larger user base for future monetization. The reaffirmation of full-year guidance is the key proof point for this strategy, but failure to show accelerating ARR conversion in the coming quarters remains a key investor concern.
- CEO Transition Uncertainty: A leadership transition of this magnitude introduces uncertainty regarding future strategic direction and execution. While a smooth transition is planned, the selection of a new CEO is a critical inflection point for the company.
4. Q&A Session Key Themes
A. Analyst Focus Areas
The Q&A session was dominated by two new, significant developments: the announcement of the CEO’s planned transition and a strategic "dampening" of near-term ARR in favor of user acquisition.
-
CEO Transition: The most significant new topic was CEO Shantanu Narayen's decision to transition from his role. Analysts focused on the timeline and the profile of his successor.
- Management Response: Mr. Narayen stated the search will likely take a "few months" and emphasized that the Board is seeking a leader who can capitalize on the AI opportunity, noting that Adobe will always be a "product company" at its core. He reassured investors of his continued focus, stating, "I'm not done yet... I'm going to be laser-focused on continuing to drive the company until we have a new CEO."
-
ARR Growth "Dampening" vs. User Funnel Expansion: A central theme was the deliberate trade-off between immediate ARR growth and long-term user acquisition.
- Analyst Focus: Multiple analysts questioned the drivers behind the "dampened" Q1 ARR growth, seeking clarity on when the significant MAU growth and AI adoption would translate into accelerated recurring revenue.
- Management Response: Management framed this not as a weakness but as a deliberate strategic "phase shift." They are prioritizing top-of-funnel growth by routing more traffic to freemium offerings like Firefly and Express. The explicit goal is to build a larger, engaged user base that will convert to paid plans over time, a strategy they compared to the successful, long-term monetization of Acrobat Reader.
-
AI Consumption and Monetization: Analysts continued to track the monetization of AI, focusing on the strong growth in generative credit consumption.
- Analyst Focus: A key question centered on the use cases driving the 45% quarter-over-quarter increase in credit consumption, particularly the skew towards higher-value video and audio modalities.
- Management Response: Management explained that AI usage is evolving from exploration to becoming integral to professional workflows. This is leading to more users generating higher-resolution content in more demanding formats, which in turn drives credit consumption and creates opportunities for upselling to higher-tier plans and credit packs.
B. Key Challenges & Concerns
The primary challenge from analysts centered on the tangible financial returns from Adobe’s AI strategy, with a clear "show-me" sentiment regarding the timing of ARR re-acceleration.
-
The "Phase Shift" Thesis and Monetization Timeline: The core investor concern, articulated across multiple questions, was the uncertainty around monetizing the massive user base being built through freemium offerings. Brent Thill’s question—"what gives you confidence on the back side that you can monetize this?"—directly captured the market’s need for conviction.
- Management’s Rebuttal: Management consistently defended the strategy by pointing to the historical success of the Acrobat freemium model as their playbook. Dan Durn emphasized that customer behavior has evolved, stating, "They want to try before they buy. And so it's meeting the customers where they are." The primary proof point offered for their confidence was the reaffirmation of the full-year 10.2% ARR growth target, which implies a significant acceleration in the remaining three quarters.
-
Margin Pressure vs. Growth Investment: An analyst questioned the trade-off between maintaining high operating margins (over 47%) and potentially investing more aggressively to accelerate growth in new areas.
- Management Response: Management stated they are "constantly" reallocating spend to be more efficient while directing investment toward high-growth initiatives like Firefly and Express marketing. They noted that increased AI usage also drives up COGS-related expenses (e.g., "token usage"), which they view as a positive indicator of product value.
5. Strategic Themes & Inflection Points
A. Current Period Themes
- Dominant Narrative: Deliberate "Phase Shift" to Prioritize User Growth: Management’s primary message has evolved from the "inflection point" narrative of the prior quarter to a more explicit strategy of a "phase shift." The company is intentionally "dampening" near-term ARR growth by routing traffic to freemium offerings to build a larger foundation of Monthly Active Users (MAUs). The reaffirmation of full-year guidance is positioned as the key evidence of their confidence that this expanded user base will convert to paying subscribers and accelerate ARR in the latter half of the year.
- Operational Focus: Top-of-Funnel Expansion and Enterprise Execution: The operational focus is twofold:
- Mass User Acquisition: Driving MAU growth across freemium web and mobile offerings like Express and Firefly is the top priority, with management highlighting the 50% YoY growth in creative freemium MAUs as a primary success metric.
- High-Value Enterprise Deals: Simultaneously, the company is focused on its enterprise segment, where solutions like GenStudio and AEP continue to grow ARR at over 30% YoY, demonstrating durable momentum in high-value accounts.
- Changes in Tone & Messaging:
- From Inflection to Investment: The tone has shifted from declaring a business inflection in Q4 to explaining a strategic investment in Q1. Management is more transparently communicating a short-term trade-off (lower immediate ARR) for a long-term gain (larger user base).
- Increased Transparency on Headwinds: Management proactively disclosed the "steeper-than-expected" decline in its ~$450 million stock business, quantifying its 30-basis-point drag on ARR growth. This represents a new level of detail regarding specific business headwinds.
- Landmark Leadership Transition: The announcement of CEO Shantanu Narayen’s planned transition after 18 years marks a significant strategic inflection point for the company’s future leadership and direction.
B. Future Considerations
- Emerging Opportunities:
- AI-First as the Next Growth Engine: Management is cultivating its AI-first applications as the company's next major revenue stream. CEO Shantanu Narayen explicitly stated that the AI-first book of business, which more than tripled YoY, "should be our next billion-dollar business."
- Monetization on Third-Party Platforms: The strategy to "atomize" Adobe's capabilities by integrating them into platforms like ChatGPT, Copilot, and Gemini remains a key long-term opportunity to establish Adobe as an indispensable utility layer across the broader AI ecosystem.
- Transformation Initiatives:
- CEO Succession: The search for a new CEO is the most significant transformation initiative underway. The selection will signal the Board’s priorities for Adobe’s next phase of growth in the AI era.
- Shift to an Open AI Platform (Consistent): Adobe continues to execute its transformation from a provider of proprietary tools to a neutral "one-stop shop" for AI-powered creativity. The planned integrations with platforms from Anthropic, Google, and OpenAI further solidify this open ecosystem strategy, which aims to make Adobe's workflows the central hub regardless of the underlying model used.
6. Key Items to Monitor Next Quarter
A. Prior Quarter Monitoring Review
The following table reviews the monitoring items identified in the prior quarter (Q4 FY2025) and assesses their current status based on disclosures from the Q1 FY2026 earnings call.
| Prior Item | Current Status | Management Commentary |
|---|---|---|
| SEMrush Acquisition Progress | On Track | Management reaffirmed its expectation for the acquisition to close in Q2 FY2026, subject to regulatory approvals. The forward-looking guidance continues to exclude any contribution from the deal. |
| Generative Credit Consumption Growth | On Track | The company reported that generative credit consumption grew over 45% quarter-over-quarter, indicating sustained, strong momentum after the 3x increase reported in Q4. |
| Firefly Foundry Enterprise Deal Momentum | On Track | While specific deal counts were not provided, management stated that Firefly Foundry "continues to build momentum in the media and entertainment vertical," citing new partnerships with major agencies and studios. |
| Execution on Absolute Net New ARR Target | On Track | The company added $400 million in net new ARR in Q1. While this is a slow start towards the full-year target of ~$2.6 billion, management attributed it to a deliberate short-term focus on user growth and reaffirmed the full-year guidance. |
| Monetization on Third-Party AI Platforms | On Track | Adobe showed significant progress, having launched Acrobat, Express, and Photoshop integrations for ChatGPT in Q1 and signaling plans for similar integrations with Copilot, Claude, and Gemini. |
B. Current Quarter Focus Items
The following table outlines the key non-guidance metrics and strategic developments to monitor in upcoming quarters to assess Adobe's business trajectory and execution.
| Category | Item | Timeline | What to Monitor | Why It Matters |
|---|---|---|---|---|
| Strategic | CEO Succession Plan | Ongoing ("a few months") | The announcement of a successor and their background (internal vs. external, product vs. sales focus). | The new leader will shape Adobe's strategic direction and execution in the critical AI-driven growth phase, impacting long-term investor confidence. |
| Risk | Freemium MAU to ARR Conversion | Next 1-2 Quarters | The trajectory of Net New ARR in Q2 and Q3 to see if the "dampened" Q1 result ($400M) re-accelerates as management's reaffirmed guidance implies. | This will validate the core "phase shift" strategy of sacrificing near-term ARR for a larger user funnel. Failure to show acceleration would undermine the narrative. |
| Risk | Stock Business Decline vs. GenAI Offset | Ongoing | Commentary on the rate of decline in the ~$450M traditional stock business and whether growth in Firefly ARR (now >$250M) is sufficient to offset the drag. | This internal cannibalization presents a material drag on overall growth. Investors need to see that new, higher-value generative offerings can more than compensate for the legacy decline. |
| Opportunity | Growth of "AI-First" Applications | FY 2026 | The growth rate and absolute ARR of the "AI-first" business, tracking its progress towards the "$1 billion business" milestone cited by the CEO. | This is Adobe's primary new organic growth engine. Its trajectory is a key indicator of the company's ability to create and monetize entirely new product categories in the AI era. |
| Operational | Generative Credit Consumption Mix | Next Quarter | Continued disclosure on the mix of generative credit consumption, specifically the adoption of high-value video and audio, which are growing significantly faster than other modalities. | A shift towards higher-cost modalities like video drives faster credit depletion, which is the primary mechanism for triggering user upgrades to premium plans and credit pack purchases, directly impacting ARPU. |
Appendix: Quotes by Theme
-
CEO Transition: CEO Shantanu Narayen addressed his decision to transition after 18 years, emphasizing his continued commitment and the Board's focus on finding a product-centric leader to capitalize on the AI opportunity. This was a new development this quarter.
"There never would have been a good time given how much Adobe is part of me... I feel really good about how we've transformed our road map based on this AI and customer audiences... I would suspect it will take a few months." — Shantanu Narayen, CEO
"I'm not done yet. I just want to make sure -- make no mistake, I'm going to be laser-focused on continuing to drive the company until we have a new CEO and to make sure they are successful." — Shantanu Narayen, CEO
"I think at our core, we're always going to be a product company. And I think taking advantage and looking around the corner as it relates to the immense opportunity that AI has across creativity and marketing is the real opportunity for not just the CEO, but the company as well." — Shantanu Narayen, CEO
-
The "Phase Shift" Strategy: Prioritizing User Growth Over Immediate ARR: Management's narrative evolved from the "inflection point" of Q4 to a deliberate "phase shift" in Q1, where near-term ARR growth was intentionally "dampened" to build a larger freemium user base for future monetization.
"Importantly, we saw tremendous MAU growth in our new initiatives that dampens ARR in the short term but sets us up to deliver in the quarters ahead." — Shantanu Narayen, CEO
"The slight difference, Keith, in those businesses tend to be that in the traditional business when somebody came and bought it, you would just immediately translate that into ARR. And here, they have to see a little bit of the paywall and they have to get -- so it's a little face-shifted is how I think about it." — Shantanu Narayen, CEO
- vs Q4-FY25 (More bullish "inflection" narrative):
"Q4 was a really strong quarter. And frankly, starting to be this inflection in terms of as we see the leading indicators... I think Q4 was inflection in the early indicators, which we continue to track." — Shantanu Narayen, CEO
-
Analyst Concerns on Monetization Timeline (Persistent): Analysts directly questioned the strategy of sacrificing near-term ARR for user growth, seeking confidence in the company's ability to convert its rapidly expanding freemium funnel into paying customers.
"The dampening of ARR with new premium offerings, I guess, what gives you confidence on the back side that you can monetize this?" — Brent Thill, Analyst, Jefferies
- vs Q4-FY25 (Broader concern about innovation translating to growth):
"When can we potentially see this sort of... accelerate the totality of growth? At Adobe... because I think that's what investors really wanna see to get more confident in the stock...?" — Keith Weiss, Analyst, Morgan Stanley
-
Stock Business Headwind (New Disclosure): Management identified a new, material headwind from the faster-than-expected decline in its traditional stock photo business, and for the first time, quantified its size and impact on growth.
"In Q1, we experienced a greater-than-anticipated decline in our traditional stand-alone stock book of business. While this is happening faster than expected, our strategy is to provide customers with the choice to use stock or generative AI offerings..." — Daniel Durn, CFO
"I think as it relates to your question around stock or order of magnitude, it's about a $450 million book of business... if you take out the stock business like-for-like, instead of the 10.9% growth, it would have been approximately 11.2% growth." — Shantanu Narayen, CEO
-
AI-First as the Next Billion-Dollar Business: Management expressed high conviction in its new AI-native products, explicitly framing them as the company's next major growth engine and setting a clear long-term target.
"I would venture to say, Keith, that we should hopefully see what we had identified as the AI-first sort of book of business. That tripled, but that should be our next billion-dollar business." — Shantanu Narayen, CEO
-
AI Platform Strategy: New Surfaces are Additive, Not Competitive: Management reiterated its long-standing view that new technology platforms represent an expansion of its market opportunity, framing integrations with third-party LLMs like ChatGPT and Claude as analogous to previous platform shifts like web, mobile, and cloud.
"I definitely look at that as I looked at when iOS came along or Android came along or the browser came along, whether that's Edge or Chrome, or Mac and PC, frankly, every single environment in which people want to engage is additive to the opportunity. And if we don't think it's additive to the opportunity, we're just unnecessarily ignoring that." — Shantanu Narayen, CEO
-
AI Consumption Evolving from Exploration to Workflow Integration: Management described the 45% sequential growth in generative credit consumption as evidence of a maturing user base that is moving beyond experimentation and embedding AI into core, higher-value professional workflows.
"If you take a step back, I think when you look at the evolution of AI, it has gone from a fun thing to play with to something that's evolving and being integrated more and more into existing workflows. And now I think people are very much relying specifically on the need for AI to be part of their creative process." — David Wadhwani, President, Creativity and Productivity
-
Investment Philosophy: Balancing Margin with Growth: In response to a question about potentially lowering margins to invest more aggressively, management affirmed their strategy of reallocating savings from operational efficiencies into high-growth areas like marketing for Firefly and Express, while also funding the COGS associated with increased AI usage.
"Maybe what's not well understood is how below the surface, we're actually constantly getting more efficient as it relates to our spend and making sure that we spend that more on marketing as well as on the COGS associated with what's happening... we now track tokens and token usage within the company, and it's nice to see that token usage increase because that means that our AI products are seeing great value..." — Shantanu Narayen, CEO
Historical Performance