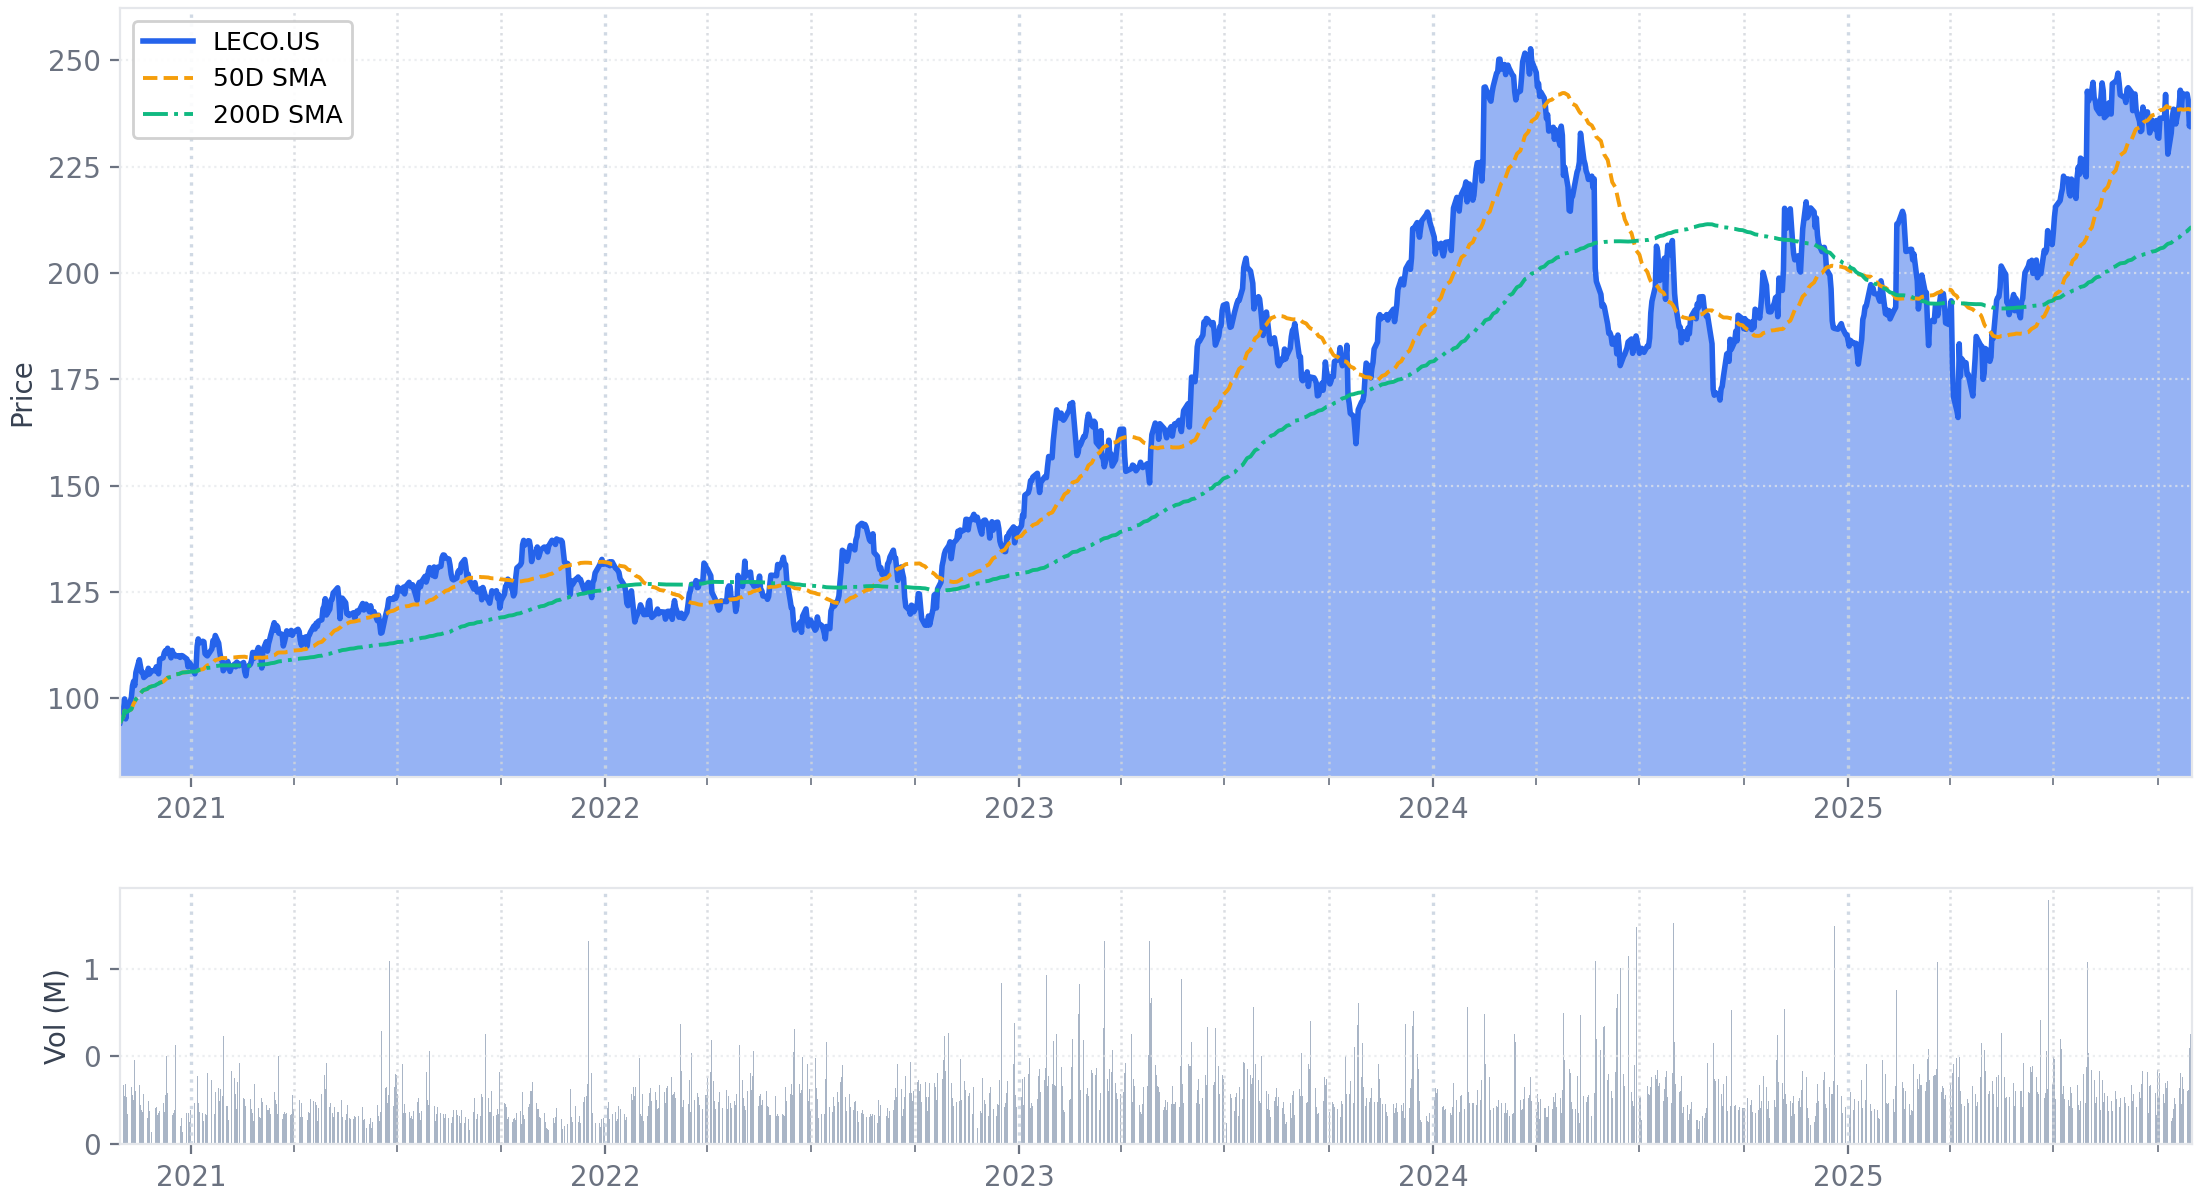
Executive Summary
Lincoln Electric reported a 7.9% increase in Q3 net sales to $1.06 billion and a 15.4% increase in adjusted EPS to $2.47, driven by strong price realization (+7.8%) that more than offset a narrowing 2.2% volume decline. The results signal a potential cyclical turn, with management noting the "first innings of a turn in demand."
The most significant development was a "broad increase in automation order rates" late in the quarter, prompting guidance for 15% to 20% sequential automation sales growth in Q4. This inflection points to a potential recovery in automotive capital spending in early to mid-2026. Further supporting this view, Americas Welding equipment volumes achieved low single-digit percent growth, the first increase in over a year.
Profitability remained resilient, with the adjusted operating margin holding at 17.4%, supported by $8 million in new permanent cost savings. The company also generated record cash flow, with a cash conversion ratio of 149%. While full-year guidance was maintained, management introduced a new headwind, citing expected "softening HVAC production" in Q4.
The quarter's performance demonstrates successful navigation of the current cycle through strong pricing and cost discipline. The positive momentum in long-cycle automation orders provides the first clear signal of a potential growth reacceleration into 2026, shifting the focus from managing a downturn to positioning for a gradual recovery.
1. Financial Performance Summary
A. Income Statement Metrics
Lincoln Electric reported a 7.9% increase in Q3 net sales to $1.06 billion, driven by a 7.8% increase in price and a 1.7% contribution from acquisitions, which more than offset a 2.2% volume decline. The company achieved a 90 basis point expansion in gross margin to 36.7% and a 10 basis point increase in adjusted operating margin to 17.4%, attributed to cost savings programs and effective cost management. Adjusted EPS grew 15.4% to $2.47, benefiting from higher operating profit and share repurchases.
| Metric | Q3 2025 | Q3 2024 | Change | Notes |
|---|---|---|---|---|
| Net Sales | $1,061.2M | $983.8M | ↑7.9% | Organic sales ↑5.6%. Price ↑7.8%, Volume ↓2.2%, Acquisitions ↑1.7%, FX ↑0.6%. |
| - Americas Welding | $691.8M | $637.0M | ↑8.6% | Driven by a 9.6% price increase that offset a 2.4% volume decline. |
| - International Welding | $219.6M | $216.2M | ↑1.6% | Volumes declined 4.2%, offset by a 3.7% acquisition benefit and favorable FX. |
| - Harris Products Group | $149.8M | $130.5M | ↑14.8% | Growth from a 11.8% price increase and 2.3% volume growth. |
| Gross Profit | $389.3M | $352.1M | ↑10.6% | Gross margin expanded 90 bps to 36.7%, aided by savings actions that offset a $5M LIFO charge. |
| Adjusted Operating Income[1] | $184.6M | $169.8M | ↑8.7% | Adjusted operating margin of 17.4% (↑10 bps), reflecting a 19% incremental margin. |
| - Americas Welding (Adj. EBIT) | $131.6M | $125.5M | ↑4.9% | Margin of 18.2% (↓60 bps) met guidance (18-19%), impacted by higher employee costs vs. prior year. |
| - International Welding (Adj. EBIT) | $25.8M | $20.1M | ↑28.4% | Margin expanded 230 bps to 11.3%, met guidance (higher end of 11-12%) due to savings and mix. |
| - Harris Products Group (Adj. EBIT) | $28.1M | $22.0M | ↑27.7% | Record margin of 18.3% (↑190 bps) beat guidance (16-17%) on volume growth and cost management. |
| Adjusted Net Income[1] | $137.2M | $122.4M | ↑12.1% | — |
| Adjusted Diluted EPS[1] | $2.47 | $2.14 | ↑15.4% | Includes a $0.07 benefit from share repurchases. |
Footnotes
- Adjusted metrics exclude special items, primarily rationalization charges and acquisition-related costs. For a full reconciliation, see the Non-GAAP Financial Measures table in the company's Q3 2025 earnings release.
B. Balance Sheet Highlights
The company's balance sheet reflects a stable debt level compared to year-end 2024. A decrease in cash was driven by investments in acquisitions, share repurchases, and working capital.
| Metric | Sep 30, 2025 | Dec 31, 2024 | Change | Notes |
|---|---|---|---|---|
| Cash and Cash Equivalents | $293.0M | $377.3M | ↓22.3% | Cash deployed for acquisitions, shareholder returns, and working capital. |
| Total Debt[1] | $1,238.5M | $1,261.1M | ↓1.8% | Comprised of $88.2M in short-term and $1,150.3M in long-term debt. |
| Net Debt[2] | $945.5M | $883.8M | ↑6.9% | Increase driven by a lower cash balance. |
| Accounts Receivable, net | $501.5M | $482.0M | ↑4.0% | — |
| Inventories | $671.5M | $544.0M | ↑23.4% | — |
| Total Equity | $1,414.6M | $1,327.4M | ↑6.6% | Increased due to retained earnings, partially offset by share repurchases. |
Footnotes
- Total Debt is the sum of Short-term debt ($88.2M) and Long-term debt, less current portion ($1,150.3M).
- Net Debt is calculated as Total Debt minus Cash and Cash Equivalents ($1,238.5M - $293.0M = $945.5M).
C. Cash Flow Analysis
Year-to-date, Lincoln Electric generated $566.2 million in operating cash flow, an increase of 12.5% year-over-year. Free cash flow increased by 15.3% to $482.2 million. The company returned a total of $413.0 million to shareholders through dividends and share repurchases in the first nine months of the year.
| Metric (YTD) | Nine Months 2025 | Nine Months 2024 | Change | Notes |
|---|---|---|---|---|
| Net Cash from Operations | $566.2M | $503.2M | ↑12.5% | Aided by lower tax payments in Q3. |
| Capital Expenditures | ($84.0M) | ($85.1M) | ↓1.3% | — |
| Free Cash Flow[1] | $482.2M | $418.1M | ↑15.3% | Represents a strong year-to-date cash conversion ratio of 119% of adjusted net income. |
| Dividends Paid | ($126.5M) | ($122.0M) | ↑3.7% | — |
| Share Repurchases | ($286.5M) | ($211.2M) | ↑35.7% | Reflects an accelerated pace of buybacks. |
Footnotes
- Free Cash Flow is calculated as Net Cash from Operations minus Capital Expenditures ($566.2M - $84.0M = $482.2M).
D. Key Financial Ratios
| Metric | TTM Sep 30, 2025 | TTM Sep 30, 2024 | Change | Notes |
|---|---|---|---|---|
| Adjusted Return on Invested Capital (ROIC) | 22.2% | 21.4% | ↑80 bps | Performance remains in the top quartile. |
| Cash Conversion Ratio (Q3) | 149% | 134% | ↑1500 bps | Management noted this as a record level of cash generation. |
| Cash Conversion Ratio (YTD) | 119% | 109% | ↑1000 bps | Exceeds the company's target of 100%. |
| Avg. Operating Working Capital to Net Sales | 18.6% | 19.1% (Q3 2024) | ↓50 bps | Improved 50 basis points versus the comparable prior year period. |
E. Operational Metrics
The company's top-line growth was primarily driven by strong price realization across all segments, which successfully compensated for modest volume declines in the welding businesses. The Harris Products Group was the only segment to post volume growth.
Change in Net Sales by Component (Q3 2025 vs. Q3 2024)
| Segment | Volume | Price | Acquisitions | FX | Total Change |
|---|---|---|---|---|---|
| Americas Welding | (2.4)% | 9.6% | 1.4% | — | 8.6% |
| International Welding | (4.2)% | — | 3.7% | 2.1% | 1.6% |
| Harris Products Group | 2.3% | 11.8% | — | 0.7% | 14.8% |
| Consolidated | (2.2)% | 7.8% | 1.7% | 0.6% | 7.9% |
2. Forward-Looking Guidance
A. Guidance Summary
Management maintained its full-year 2025 top-line and margin assumptions while raising guidance for interest expense and introducing a formal target for cash conversion. The outlook for Q4 2025 reflects traditional seasonality, with a modest sequential improvement in operating margin. The company lowered its margin expectations for the Harris Products Group, citing seasonality and softening HVAC production.
| Metric | Period | Current Guidance | Prior Guidance | Change | Management Commentary |
|---|---|---|---|---|---|
| Organic Sales & Adj. OI Margin | FY 2025 | Maintained | Low single-digit % growth; Steady to slightly up YoY | Maintained | Based on year-to-date performance, order trends, and cost management. |
| Americas Welding Adj. EBIT Margin | Remainder of 2025 | 18% – 19% (expected at high end) | 18% – 19% | Maintained | Reflects continued diligent cost management. |
| International Welding Adj. EBIT Margin | Remainder of 2025 | 11% – 12% (expected at high end) | Higher end of 11% – 12% | Maintained | Performance reflects benefits from mix, seasonality, and savings actions. |
| Harris Products Group Adj. EBIT Margin | Remainder of 2025 | 16% – 17%[1] | 17% – 18% | Lowered | The reduction is attributed to seasonality and an expected softening in HVAC production activity. |
| Interest Expense, Net | FY 2025 | Low $50M range | $45M – $50M | Raised | The increase is due to borrowings for the Alloy Steel transaction. |
| Cash Conversion Ratio | FY 2025 | Above 100% | N/A | Introduced | Formally introduced to better align with strong year-to-date performance. |
Footnotes
- The transcript states a range of "16% to 7%," which is presumed to be a typo. The summary reflects the more likely intended range of 16% to 17%.
B. Additional Notes & Commentary
- Q4 2025 Sales & Margin: Management expects traditional seasonality in sales moving from Q3 to Q4, accompanied by a modest sequential improvement in operating income margin.
- Automation Sales: A sequential increase is expected in Q4. Management projects Q4 automation sales to be 15% to 20% higher than Q3, though still below the record levels of Q4 2024. This follows Q3 automation sales of approximately $200 million.
- LIFO Charge: A LIFO charge similar to the $5 million recorded in Q3 is anticipated for Q4 2025.
- HVAC Sector: Management expects softening HVAC production in the fourth quarter, impacting the Harris Products Group.
- Capital Allocation: The company announced its 30th consecutive annual dividend increase, a 5.3% raise effective in early 2026.
3. Operational & Strategic Developments
A. Business Performance & Operations
-
Volume and Pricing Trends: Management noted that volume declines narrowed during the quarter, citing ongoing stabilization in short-cycle consumables, particularly in the Americas and Harris Products Group segments.
- A key positive development was in the Americas Welding segment, which achieved low single-digit percent volume growth in welding equipment, a notable inflection after several quarters of decline.
- Pricing in the Americas Welding segment (+9.6%) was attributed to actions taken in the first half of the year that fully matured in Q3. Management expects these price levels to hold sequentially in Q4.
- The Harris Products Group saw continued pricing power (+11.8%) related to metal costs and prior actions, along with 2.3% volume growth driven by HVAC sector strength and expanded retail presence.
-
Automation Portfolio Performance: Global automation sales were approximately $200 million in Q3, slightly below the ~$215 million run-rate expectation from Q2. Management attributed this shortfall to project timing, with the associated revenue expected to be recognized in Q4.
- A significant forward-looking development was a broad increase in automation order rates that began in late September and continued through October.
- Management noted an increase in long-cycle automation orders in October, aligning with industry surveys that suggest a reacceleration in automotive new model launches through 2029. This points to a potential inflection to growth for automotive capital spending in early to mid-2026.
-
End Market Performance: Three of the company's five end markets, representing approximately 60% of revenue, achieved steady to higher organic sales growth.
- Volume growth was achieved in General Industries, the HVAC sector, and midstream Energy.
- Heavy Industries trends improved due to easier comparisons, price, and higher customer production in construction and agricultural equipment.
- Automotive remained challenged by slow capital spending, but consumable volumes in the Americas outpaced domestic production rates.
B. Strategic Initiatives
- Higher Standard 2025 Strategy: As the company enters the final quarter of its five-year strategy, management highlighted key achievements since the 2020 baseline year:
- Operating income margin has increased by 500 basis points.
- Earnings have more than doubled, representing a high-teens percent annual compounded growth rate.
- Cost Management: The company's cost savings programs delivered an incremental $8 million in permanent savings in Q3. This is part of the broader program focused on structural improvements to the operating model.
- Capital Allocation: The company maintained its balanced capital allocation strategy.
- Growth Investment: Invested $136 million during the quarter, which included CapEx and the final investment payment for the Alloy Steel acquisition.
- Shareholder Returns: Returned $94 million to shareholders, consisting of dividends and $53 million in share repurchases.
C. Risk Factors & Headwinds
-
Persistent Headwinds:
- Deferred Capital Spending: The primary headwind remains deferred capital spending in the automation portfolio, particularly from the automotive and heavy industry sectors. While this issue has persisted for several quarters, the recent uptick in order rates suggests a potential shift in customer posture from "wait-and-see" to committing capital.
- Sluggish European Demand: The International Welding segment continues to navigate sluggish demand in the EMEA region. During the Q&A, management expressed cautious optimism about potential improvements but stated they are "not in any way counting on it," indicating no change in the near-term outlook for the region.
-
New/Evolving Headwinds:
- HVAC Sector Softening: Management explicitly guided for softening HVAC production activity in Q4. This is a new headwind that is expected to impact the Harris Products Group, which has been a consistent source of strength, and is the primary driver for the segment's lowered EBIT margin guidance.
4. Q&A Session Key Themes
A. Analyst Focus Areas
The Q&A session centered on the timing and trajectory of a potential cyclical recovery in 2026, with a significant focus on the recent positive order trends in the automation business. Analysts sought to understand if the nascent signs of improvement were sustainable and what they implied for future growth and profitability.
- Automation Cycle: The most persistent topic, carried over from prior quarters, evolved from Q2's discussion of sales stabilization to Q3's more forward-looking questions about the tangible acceleration in order rates. Management conveyed cautious optimism, confirming a "broad increase in automation order rates" but emphasizing that the significant financial impact would materialize in 2026, not Q4 2025, due to the long-cycle nature of many projects.
- Broader Demand Outlook for 2026: In response to questions on the shape of the recovery, the CEO stated he expects to see a "slow build of volume growth rather than an avalanche," tempering expectations for a rapid rebound.
- Incremental Margins: A key question focused on the progression of incremental margins as the growth driver potentially shifts from price (low leverage) to volume (high leverage). The CFO reiterated the company's operating framework:
- Current Environment (price-led growth): High-teens incremental margins.
- Volume Recovery (mid-single-digit volume growth): Mid-20s incremental margins.
- Accelerated Growth (strong automation/international contribution): Upside potential toward the low-to-mid 30s.
B. Key Challenges & Concerns
Analysts probed several areas where performance or outlook seemed to differ from prior expectations or peer commentary, prompting management to provide detailed justifications.
- Automation Underperformance in Q3: One analyst challenged the Q3 automation sales figure of ~$200 million, which was below the ~$215 million quarterly run-rate guided in Q2. Management attributed the shortfall entirely to "project timing," stating the revenue would be recognized in Q4.
- European Outlook Divergence: An analyst noted that a key competitor had recently expressed a more bullish view on Europe. Management defended their more conservative stance, stating, "at this point, it's still commentary. We're not seeing that translate into order intake for us... we would be cautiously optimistic... but we're not in any way counting on it."
- Demand Elasticity from Pricing: An analyst questioned whether the strong pricing in the Americas (+9.6%) was creating demand destruction. Management countered this concern, stating that demand has been "a little bit more resilient than that" and that volumes are now beginning to "flip towards being positive."
5. Strategic Themes & Inflection Points
A. Current Period Themes
- Dominant Narrative: Sighting a Potential Cyclical Turn: The central theme has evolved from Q2’s "confident execution" in a challenging environment to a more forward-looking narrative focused on the "first innings of a turn in demand." This was supported by the first volume growth in Americas welding equipment in over a year.
- Operational Focus: Disciplined Cost Control While Preparing for Growth: The company realized another $8 million in permanent cost savings, framing the actions as strengthening the business for the long term without compromising its ability to "capture demand in an up cycle."
- Inflection Point in Automation: The most significant development was the shift in the automation business narrative. After several quarters of a customer "wait-and-see" posture, management reported a "broad increase in automation order rates." This marks a potential inflection point, moving the conversation from risk mitigation to the initial stages of a long-cycle recovery.
B. Future Considerations
- External Environment: Cautious Optimism on Capital Spending: The tone on capital spending has become more optimistic. The recent uptick in automation orders, combined with improving heavy industry sentiment, suggests customer caution may be thawing. Management now points to a potential inflection for automotive capital spending in early to mid-2026.
- Transformation Initiatives: Validating the Long-Term Model: Management used the call to underscore the success of its five-year "Higher Standard 2025" strategy, highlighting the 500 basis point margin improvement since 2020.
- Evolving Narrative on Recovery Trajectory: The Q3 discussion pivoted to the shape of the next recovery. The CEO explicitly tempered expectations, forecasting a "slow build of volume growth rather than an avalanche," signaling a gradual, rather than a V-shaped, rebound.
6. Key Items to Monitor Next Quarter
A. Prior Quarter Monitoring Review
| Prior Item | Current Status | Management Commentary |
|---|---|---|
| Automation Order Inflection | On Track | Management reported a "broad increase in automation order rates in late September and through October," signaling the beginning of the anticipated inflection. Q4 automation sales are projected to be 15-20% higher sequentially. |
| Alloy Steel Integration & Performance | On Track | The company completed its final investment in Alloy Steel. The International Welding segment, where the business resides, reported a 230 bps YoY adjusted EBIT margin expansion to 11.3%, meeting the 11-12% guided range. |
| Harris Products Group Volume Normalization | Achieved | Q3 volumes grew 2.3%, a normalization from Q2's 11.0% surge related to a one-time channel fill, and slightly better than the "flattish" expectation. However, management now expects softening HVAC production to be a headwind in Q4. |
| Impact of Reintroduced Costs | Mixed Progress | The company held its overall adjusted operating margin steady (+10 bps YoY), but the Americas Welding segment margin declined 60 bps, with management citing challenging YoY comparisons on employee incentive costs as a primary driver. |
| Consumables and General Industries Momentum | Achieved | Management confirmed "ongoing stabilization" in short-cycle consumables demand and reported achieving volume growth in the General Industries end market, indicating the resilient trend continued and strengthened. |
B. Current Quarter Focus Items
| Category | Item | Timeline | What to Monitor | Why It Matters |
|---|---|---|---|---|
| Opportunity | Automation Order Book Conversion | H1 2026 / Ongoing | Commentary on the sustainability of the late Q3/early Q4 order acceleration. Updates on the size and composition (e.g., auto vs. general industry) of the automation backlog. | This is the clearest signal of a long-cycle recovery. Sustained order strength would validate management's call of an inflection point and provide visibility into higher-margin revenue growth for 2026 and beyond. |
| Operational | Americas Equipment Volume Momentum | Next Quarter / H1 2026 | Whether the low single-digit volume growth in Americas welding equipment seen in Q3 is sustained or accelerates. Management noted this trend showed "continued momentum in October." | Equipment sales are a leading indicator of customer confidence and capital investment in the core welding business. Sustained growth would signal a broader, more durable industrial recovery beyond short-cycle consumables. |
| Risk | Harris Products Group HVAC Headwind | Q4 2025 / Next Quarter | The magnitude and duration of the "softening HVAC production" guided for Q4. Any commentary on whether this softness is expected to persist into 2026. | The Harris segment has been a consistent source of high-margin growth. A significant or prolonged downturn in HVAC could pressure the company's overall margin mix and profitability. |
| Operational | European Order Intake vs. Cautious Outlook | Ongoing | Any change in management's cautious tone on Europe. Specifically, whether government commentary on defense spending begins to translate into tangible order intake, as management noted it has not yet. | Europe remains a key area of underperformance. An improvement would provide a significant tailwind to International segment growth and margins, but management's current skepticism, which contrasts with some peers, makes it a key uncertainty. |
| Strategic | Unveiling of Post-2025 Strategic Plan | Q4 2025 / Early 2026 | The announcement and key financial targets of the successor to the "Higher Standard 2025" strategy. Focus on new long-term targets for margin, ROIC, and earnings growth. | The current strategy drove a 500 bps margin increase and doubled earnings. The next plan will set investor expectations for long-term value creation and define the company's growth priorities for the next cycle. |
Appendix: Quotes by Theme
Management Sentiment & Strategic Confidence
-
Narrative Shifts to a Potential Cyclical Turn: Management's tone evolved from navigating a challenging environment in prior quarters to identifying the early signs of a market recovery, particularly in long-cycle businesses.
"I think what we're starting to see now is the volume not being less negative but actually starting to flip towards being positive... I think there's general optimism amongst our customer base that we're starting to see the first innings of a turn in demand." — Gabriel Bruno, CFO
vs Q2-FY25:
"Remember that when we spoke last quarter, our concern was that we had to raise prices to offset tariffs. We were anticipating a demand elasticity response... And what we've seen is that volume has been less negative than we feared." — Steven B. Hedlund, CEO
vs Q3-FY24:
"We generated solid third quarter results... despite a broad deceleration in demand... Given slowing OEM customer orders and industrial weakness... we remain cautious through the first quarter of 2025 as we expect these trends to persist in the short term." — Steve Hedlund, CEO
-
Setting Expectations for a Gradual Recovery: While optimistic about a turn, the CEO tempered expectations about the pace of the upcoming recovery, signaling a measured build rather than a sharp rebound.
"I'd expect to see a slow build of volume growth rather than an avalanche of everything suddenly breaking loose." — Steven Hedlund, CEO
Business Strategy & Transformation Signals
-
Automation Business Inflection Point: After quarters of customer delays, management signaled a clear turning point with a notable acceleration in automation orders, shifting the narrative from stabilization to future growth.
"We were encouraged by a broad increase in automation order rates in late September and through October. If this trend continues, we expect fourth quarter automation sales to be approximately 15% to 20% higher sequentially... If this momentum continues, it's just an inflection to growth for auto capital spending in our business in early to mid-2026." — Steven Hedlund, CEO
vs Q2-FY25:
"We continue to see customers defer capital spending and maintain a wait-and-see approach due to policy uncertainty... Our automation sales have stabilized around $215 million per quarter, which we expect to continue in the third quarter and possibly through year-end." — Steven B. Hedlund, CEO
vs Q3-FY24:
"Automotive sector customers continue to delay capital projects despite high quoting activity... current shifts in the automotive sector's plans could impact automation portfolio sales through the first half of 2025." — Steve Hedlund, CEO
-
Long-Term Incremental Margin Framework: In response to analyst questions about profitability in a recovery, the CFO provided a clear framework for how incremental margins are expected to perform under different volume scenarios.
"In general... when we see volumes approaching that mid-single digits, we're going to be in that mid-20s incremental margins. There is upside with automation. And as we continue to shape our international segment, which leads into upwards of 30, low to mid-30s type incrementals. But you should see more accelerated incrementals as you see an acceleration of growth... we'll see if high teens type of incrementals in this kind of environment." — Gabriel Bruno, CFO
-
Highlighting Success of Five-Year "Higher Standard 2025" Strategy: As the company's long-term strategic plan nears its conclusion, the CEO took the opportunity to quantify its success, framing current performance as the result of a multi-year transformation.
"Since 2020, our strategy baseline year, our operating income margin has increased 500 basis points... Our earnings have more than doubled at a high-teens percent annual compounded growth rate, and we have generated over 165% in total shareholder returns through the third quarter." — Steven Hedlund, CEO
Risk Assessment & Market Dynamics
-
Maintaining a Cautious and Divergent View on Europe: When challenged by an analyst on a competitor's more bullish European outlook, management defended their conservative stance, stating it is not yet supported by their own order activity.
"The commentary from the European governments about increasing defense spending and the like is encouraging. But at this point, it's still commentary. We're not seeing that translate into order intake for us. So I guess we would be cautiously optimistic that maybe Europe might get better, but we're not in any way counting on it." — Steven Hedlund, CEO
vs Q2-FY25 (Consistent Caution):
"On the EMEA side, Turkey continues to operate in a challenged economic environment as well as some project timing in Middle East and some areas of Europe. So if you back those out, core Europe is probably tracking more in the low single-digit type progression..." — Gabriel Bruno, CFO
-
Identifying a New Headwind in HVAC: Management explicitly called out a coming slowdown in the HVAC market, a key driver for the high-margin Harris Products Group, signaling a new area of pressure for Q4.
"We expect softening HVAC production in the fourth quarter... we do expect incremental softness within the HVAC markets." — Gabriel Bruno, CFO
Analyst Sentiment & Market Perception
-
Analyst Focus Shifts to the Shape of the 2026 Recovery: Analyst questions pivoted from near-term risk mitigation to the timing and trajectory of a potential 2026 recovery, focusing on the sustainability of nascent positive trends.
"Just curious now that we're in our second year of volume decline, you saw some momentum. How you would expect to see a slower recovery? Would it be kind of a recovery? Or would you see some strong growth coming out of this downturn?" — Saree Boroditsky, Jefferies
"It would be great to hear a little more on how your team is thinking about cycle positioning and the potential for demand recovery and acceleration into 2026." — Bryan Blair, Oppenheimer
Historical Performance