Executive Summary
Visa reported its strongest net revenue growth since 2022, with Q2 revenue rising 17% YoY to $11.2 billion and non-GAAP EPS increasing 20% to $3.31, significantly surpassing prior guidance. The performance was driven by resilient consumer spending, robust growth in strategic pillars, higher-than-expected currency volatility, and lower client incentives.
Operational momentum was exceptional in key growth areas. Value-Added Services (VAS) revenue grew 27% in constant dollars, now comprising 30% of total revenue, while Commercial & Money Movement Solutions (CMS) revenue growth accelerated to 24%. The quarter was marked by significant strategic inflection points, including a landmark agreement for its Pismo platform to support Wells Fargo's core banking modernization and a more than 50% sequential surge in stablecoin settlement volume to a $7.0 billion annualized run rate, as Visa deepened its role as a core blockchain infrastructure operator.
Reflecting the strong first-half performance and business momentum, management raised its full-year FY2026 guidance for both adjusted net revenue and EPS. The results and strategic wins demonstrate Visa's successful execution in expanding beyond its core network, positioning itself as a foundational technology provider for both the modernization of traditional finance and the growth of new digital ecosystems.
1. Financial Performance Summary
Visa reported fiscal second-quarter results that significantly surpassed prior guidance, with net revenue growing 17% YoY to $11.2 billion (16% in constant dollars) and non-GAAP EPS increasing 20% to $3.31. Management highlighted this as the strongest net revenue growth since 2022, driven by resilient consumer spending, stronger-than-expected currency volatility, robust performance in Value-Added Services (VAS), and lower-than-expected client incentives.
A. Income Statement Metrics
| Metric | Q2 2026 | Q2 2025 | Change | Notes |
|---|---|---|---|---|
| Net Revenues | $11.2B | $9.6B | ↑ 17% | Growth was 16% in constant dollars. Beat guidance of "low double digits" adjusted net revenue growth (Q1-26 transcript). Outperformance was driven by higher volatility, stronger VAS revenue, and lower incentives. |
| - Service Revenues | $5.0B | $4.4B | ↑ 13.0% | Recognized based on prior quarter's payments volume. |
| - Data Processing Revenues | $5.5B | $4.7B | ↑ 18.2% | Outpaced transaction growth due to pricing, strong VAS performance, and higher cross-border mix. |
| - International Transaction Revenues | $3.6B | $3.3B | ↑ 10.0% | Growth was below constant dollar cross-border volume growth, with favorable FX offset by volatility, mix, and hedging impacts. |
| - Other Revenues | $1.3B | $0.9B | ↑ 41.1% | Driven by growth in advisory, marketing services, and other value-added services. |
| - Client Incentives | ($4.2B) | ($3.7B) | ↑ 14.0% | Lower than expectations due to deal timing and performance adjustments. |
| GAAP Operating Income | $7.2B | $5.4B | ↑ 33.1% | GAAP operating margin was 64.4%, up from 56.7% in the prior year, primarily due to a lower litigation provision. |
| Non-GAAP Operating Income[1] | $7.6B | $6.5B | ↑ 17.0% | Non-GAAP operating margin was 67.9%, compared to 68.0% in the prior year. |
| GAAP Net Income | $6.0B | $4.6B | ↑ 31.5% | — |
| Non-GAAP Net Income | $6.3B | $5.4B | ↑ 17% | — |
| GAAP EPS (Diluted) | $3.14 | $2.32 | ↑ 35.3% | — |
| Non-GAAP EPS (Diluted)[2] | $3.31 | $2.76 | ↑ 19.9% | Growth was 20% in constant dollars. Beat guidance of "high end of low double digits" adjusted EPS growth (Q1-26 transcript), primarily due to stronger net revenue. |
Footnotes
- Non-GAAP Operating Income is calculated as Net Revenues ($11,230M) less Non-GAAP Operating Expenses ($3,599M) = $7,631M. The reconciliation from GAAP Operating Income ($7,234M) excludes a litigation provision ($311M), amortization of acquired intangible assets ($50M), and acquisition-related costs ($36M). Total adjustments of $397M represent 5.5% of GAAP Operating Income.
- Non-GAAP EPS excludes the after-tax impact of the litigation provision ($0.13), amortization of acquired intangible assets ($0.02), acquisition-related costs ($0.02), and net losses on equity investments ($0.01).
B. Balance Sheet Highlights
| Metric | Mar 31, 2026 | Sep 30, 2025 | Change | Notes |
|---|---|---|---|---|
| Cash and Cash Equivalents | $12.4B | $17.2B | ↓ 27.7% | Includes $665M in restricted cash for the U.S. litigation escrow. |
| Total Debt[1] | $24.0B | $25.2B | ↓ 4.7% | — |
| Net Debt[2] | $11.6B | $8.0B | ↑ 44.4% | The increase in net debt was driven by significant share repurchases during the first half of the fiscal year. |
| Shareholders' Equity | $35.7B | $37.9B | ↓ 5.9% | — |
Footnotes
- Total Debt is calculated as Current maturities of debt ($1,559M) + Long-term debt ($22,417M) = $23,976M.
- Net Debt is calculated as Total Debt ($23,976M) - Cash and Cash Equivalents ($12,404M) = $11,572M.
C. Cash Flow Analysis
| Metric (Six Months Ended) | Mar 31, 2026 | Mar 31, 2025 | Change | Notes |
|---|---|---|---|---|
| Net Cash from Operating Activities | $9.8B | $10.1B | ↓ 3.0% | — |
| Capital Expenditures | ($0.8B) | ($0.7B) | ↑ 13.2% | Represents purchases of property, equipment, and technology. |
| Free Cash Flow (GAAP)[1] | $9.0B | $9.4B | ↓ 4.2% | — |
| Dividends Paid | ($2.6B) | ($2.3B) | ↑ 10.5% | — |
| Share Repurchases (Net)[2] | ($11.5B) | ($8.4B) | ↑ 37.3% | Q2 buyback of $7.9B was the highest in company history. |
Footnotes
- Free Cash Flow (GAAP) is calculated as Net Cash from Operating Activities ($9,788M) - Capital Expenditures ($761M) = $9,027M.
- Net Share Repurchases of ($11,492M) consist of ($11,625M) in repurchases of class A common stock, partially offset by +$133M in proceeds from stock issued under equity plans.
D. Key Financial Ratios
| Metric | Q2 2026 | Q1 2026 | Change | Notes |
|---|---|---|---|---|
| Return on Equity (TTM)[1] | 62.3% | 53.6% | ↑ 8.7 pts | Improvement reflects strong trailing-twelve-month earnings relative to the equity base. |
| Net Debt to EBITDA (Non-GAAP, TTM)[2] | 0.4x | 0.2x | ↑ 0.2x | Leverage increased sequentially due to significant share repurchases but remains low. |
Footnotes
- Return on Equity (TTM) is calculated as trailing-twelve-month GAAP Net Income ($22,236M) divided by end-of-period total equity ($35,661M).
- Net Debt to EBITDA (TTM) is calculated using Net Debt at period end ($11,572M) and trailing-twelve-month Non-GAAP EBITDA ($30,349M). TTM Non-GAAP EBITDA = TTM Non-GAAP Operating Income ($29,057M) + TTM D&A ($1,292M).
E. Operational Metrics
| Metric (YoY Growth) | Q2 2026 | Q2 2025 | Notes |
|---|---|---|---|
| Payments Volume (Constant $) | ↑ 9% | ↑ 8% | Totaled $3.7 trillion for the quarter. |
| - U.S. Payments Volume | ↑ 8% | ↑ 6% | Credit grew 10%, Debit grew 7%. |
| - International Payments Volume | ↑ 10% | ↑ 9% | — |
| Cross-Border Volume (Constant $) | |||
| - Total ex. Intra-Europe | ↑ 11% | ↑ 13% | E-commerce grew 13%, travel grew 10%. |
| - Total | ↑ 12% | — | — |
| Processed Transactions | ↑ 9% | ↑ 9% | Totaled 66.1 billion for the quarter. |
| Visa Direct Transactions | ↑ 23% | ↑ 28% | Reached 3.7 billion transactions. |
| Commercial Payments Volume (Constant $) | ↑ 11% | ↑ 6% | Growth accelerated significantly from the prior year. |
| Value-Added Services Revenue (Constant $) | ↑ 27% | ↑ 22% | Reached $3.3 billion in revenue and now represents 30% of total net revenue. |
| Stablecoin Settlement Volume | $7.0B | $0.2B | Annualized run rate, up over 50% from $4.6B in Q1 2026. |
| Credentials | >5.0B | ~4.7B | Number not explicitly updated; consistent with Q1 2026 figure. |
| Tokens | >17.5B | 13.7B | Number not explicitly updated; based on Q1 2026 figure. |
2. Forward-Looking Guidance
Visa raised its full-year fiscal 2026 outlook for adjusted net revenue and EPS growth, reflecting strong year-to-date performance and increased client demand for marketing services related to the FIFA World Cup. Management now expects full-year adjusted net revenue growth in the low double-digit to low teens range, an increase from the prior "low double digits" guidance. Adjusted EPS growth was also revised up to the low teens, from "low double digits (higher in the range)."
For the upcoming third quarter, management introduced guidance for low double-digit adjusted net revenue growth, noting it should be the lowest growth quarter of the year due to higher incentive growth and a difficult comparison for currency volatility from the prior year.
A. Guidance Summary
| Metric | Period | Current Guidance | Prior Guidance (from Q1-26 Call) | Change | Management Commentary |
|---|---|---|---|---|---|
| Adjusted Net Revenue Growth | Q3 FY2026 | Low double digits | N/A | Introduced | Expected to be the lowest growth quarter of the year due to higher incentive growth and a tough volatility comp, partially offset by new pricing. Q4 growth is expected to step up ~1 point from Q3. |
| Adjusted Operating Expense Growth | Q3 FY2026 | Low teens | N/A | Introduced | A slight step-up from Q2, primarily driven by FIFA-related marketing expenses. |
| Adjusted EPS Growth | Q3 FY2026 | Mid- to high single digits | N/A | Introduced | Growth is tempered by the revenue and expense dynamics specific to the quarter. |
| Adjusted Net Revenue Growth | FY2026 | Low double-digit to low teens | Low double digits | Raised | Raised to reflect strong year-to-date results and higher anticipated VAS revenue, particularly from FIFA-related marketing services. |
| Adjusted Operating Expense Growth | FY2026 | Low double-digit to low teens | Low double digits | Raised | Raised to fund incremental, high-yielding marketing services revenue opportunities tied to increased client demand for FIFA activations. |
| Adjusted EPS Growth | FY2026 | Low teens | Low double digits (higher in the range) | Raised | Reflects the stronger revenue outlook. |
| Non-Operating Expense | FY2026 | ~$150M | $101M – $125M | Raised / Worsened | Increased due to higher debt levels and interest rate estimates. |
| Non-GAAP Tax Rate | FY2026 | Closer to the low end of 18.0% - 18.5% | 18.0% – 18.5% | Maintained (Improved Tone) | No change to the range, but management now expects the rate to be near the low end. |
Note: Guidance on an "Adjusted" basis is defined by management as non-GAAP results presented in constant dollars and excluding acquisition impacts.
B. Additional Notes & Commentary
Management's guidance is underpinned by the following key assumptions:
- Macroeconomic Environment: Assumes the continuation of broad consumer spending stability.
- Geopolitical Impact: The conflict in the Middle East has introduced near-term uncertainty, particularly for cross-border travel in the CEMEA region. However, this is expected to be offset by improvements in U.S. and Latin America inbound travel related to FIFA.
- Currency Volatility: Following higher-than-expected volatility in Q2, assumptions for Q3 and Q4 have been revised upwards to levels consistent with Q4 2025.
- Client Incentives: No material changes to full-year assumptions. Management reiterated that Q3 will see a step-up in incentive growth rate as it laps the lowest growth quarter from the prior year (Q3 2025).
- Pricing: No material changes to assumptions, with new pricing actions still weighted toward the second half of the fiscal year.
- Acquisition Impact (Nominal): For the full year, the acquisitions of Prisma and Newpay are expected to add approximately 1 point to net revenue growth, 1.5 points to operating expense growth, and 0.5 points to EPS growth on a non-GAAP nominal basis. For Q3 specifically, the expected contribution is ~1.5 points to net revenue, ~2 points to operating expense, and ~0.5 points to EPS growth.
3. Operational & Strategic Developments
Visa's second quarter was characterized by an acceleration in its core business drivers and significant progress in its long-term strategic initiatives, particularly in AI, agentic commerce, and stablecoin infrastructure. Management presented a four-pronged growth strategy, framing Visa as the "leading hyperscaler of payments," and provided tangible proof points for each pillar.
A. Business Performance & Operations
- Growth Engines Accelerate: Visa's strategic growth pillars demonstrated significant momentum, outperforming expectations.
- Value-Added Services (VAS): Revenue grew 27% in constant dollars to $3.3 billion. VAS now constitutes 30% of total net revenue. The outperformance was driven by broad-based client adoption of AI-embedded services and higher demand for marketing services.
- Commercial & Money Movement Solutions (CMS): Revenue growth accelerated to 24% in constant dollars, up from 20% in Q1. This was partly due to favorable performance adjustments and deal timing, in addition to strong underlying growth.
- Core Volume Trends: Underlying volume and transaction growth showed resilience and sequential improvement.
- Total Payments Volume: Grew 9% in constant dollars, an acceleration from 8% in Q1.
- U.S. Payments Volume: Growth accelerated to 8% from 7% in Q1. Management noted that higher tax refunds likely provided a partial tailwind and stated, "We do not see signs of the lower spend consumer weakening in our volumes."
- Cross-Border Volume: Growth (ex. intra-Europe) remained stable at 11% in constant dollars, consistent with Q1.
- Geographic Performance: Performance was strong globally, though management flagged a specific headwind in the Middle East, which caused a 2.5 percentage point step-down in CEMEA payments volume growth from Q1.
B. Strategic Initiatives
Management detailed significant advancements across four key strategic pillars, with a heavy emphasis on positioning Visa as the essential infrastructure for next-generation commerce and finance.
-
Winning in Core Payments & Money Movement:
- Issuer Processing (Pismo): Announced a landmark agreement with Wells Fargo, which will migrate to Pismo's core account ledger as part of its core banking modernization.
- New Partnerships: Expanded key relationships with TikTok (creator debit card), PayPay (mobile payments in Japan), and X (Visa Direct for "X Money").
- Acquisition: Acquired Prisma and Newpay in Argentina to modernize the country's payments infrastructure.
-
AI & Agentic Commerce: Management framed AI as a major expansion of the addressable market.
- New Capabilities: Launched Intelligent Commerce Connect as an on-ramp for agent builders and merchants.
- Microtransactions: Unveiled a proof-of-concept called Visa CLI (Command Line Interface), designed to enable programmatic payments for digital services and create a new category of commerce.
- AI in VAS: The new Visa Large Transaction Model is showing early results of up to a 5x increase in fraud value capture.
-
Stablecoins & Blockchain: Visa is solidifying its role as the primary "bridge layer" between the traditional financial system and on-chain payments.
- Settlement Volume Acceleration: The annualized run rate of stablecoin settlement volume reached $7.0 billion, a significant increase of over 50% from the $4.6 billion reported just last quarter.
- Infrastructure Role: Expanded its direct participation by becoming a validator on the Tempo network and a super validator on the Canton network, moving from participant to infrastructure operator.
-
Value-Added Services Expansion:
- Management noted that the "vast majority" of VAS revenue is linked to transactions, cards, and accounts, creating a flywheel effect with core payments growth.
C. Risk Factors & Headwinds
- Aggressive Capital Return: Visa repurchased $7.9 billion of stock, the highest quarterly buyback in company history, driving a significant increase in net debt to $11.6 billion from $6.4 billion in the prior quarter. A new $20 billion share repurchase program was also authorized.
- Geopolitical Headwinds (New/Elevated): Management explicitly identified the conflict in the Middle East as a direct headwind impacting near-term business performance in the CEMEA region and creating uncertainty for cross-border travel.
- Payments Nationalism (Persistent): In the Q&A, management addressed concerns about renewed discussions around sovereign payment infrastructures in Europe. This remains a long-standing risk requiring continuous government engagement.
4. Q&A Session Key Themes
The Q&A session was dominated by inquiries into Visa's long-term strategic initiatives, particularly Agentic Commerce and Stablecoins, as analysts sought to understand the economic models and risk frameworks for these emerging opportunities. There was also significant focus on the drivers and sustainability of the exceptional performance in Value-Added Services (VAS) and Commercial & Money Movement Solutions (CMS).
A. Analyst Focus Areas
- Agentic Commerce & Stablecoins: This was the most prominent theme. Analysts probed the unit economics, risk management, and value proposition. Management framed Visa's role as a "hyperscaling bridge layer" for stablecoins and stressed that trust will be the "limiting factor" for Agentic Commerce, positioning Visa's brand and security as key differentiators.
- Pismo's Strategic Importance: Analysts inquired about the significance of the Wells Fargo agreement. The CEO positioned the deal as a validation of the Pismo acquisition thesis: that large financial institutions globally are embarking on core platform modernization.
- Sustainability of VAS & CMS Growth: Multiple analysts probed the durability of the high growth rates in VAS (27%) and CMS (24%). Management attributed the strength to the successful execution of a multi-year strategy, new AI-driven products, and strong client demand, while acknowledging some one-time benefits in CMS.
- Cross-Border Dynamics: An analyst sought to quantify the near-term impact of the Middle East conflict and Ramadan timing on cross-border travel. The CFO emphasized the resilience and diversification of the business, expecting strength in other regions to offset regional weakness.
B. Key Challenges & Concerns
- Agentic Commerce Fraud Liability: An analyst directly challenged how Visa, as a four-party network, could manage the risk of fraudulent agent transactions. The CEO acknowledged the space is "very early" but reiterated that cardholders will be protected from fraud and that agentic commerce will bring benefits like more authenticated tokens and richer transaction data to aid in risk management.
- Payments Nationalism: A recurring concern, an analyst asked for an updated perspective on this risk, particularly in Europe. The CEO described it as a long-standing feature of the landscape that Visa has navigated for decades by operating with local teams and infrastructure.
5. Strategic Themes & Inflection Points
Visa's Q2 FY2026 narrative shifted from validating its "payments hyperscaler" strategy to demonstrating deep, tangible execution on next-generation growth pillars. Management presented a highly confident, forward-looking vision, providing concrete proof points that position Visa as essential infrastructure for both the evolution of traditional banking and the emergence of AI-driven and on-chain commerce.
A. Current Period Themes
- Dominant Narrative: Executing the Four-Pillar Growth Strategy: Management moved beyond the conceptual "Visa as a Service" stack to articulate a clear, four-pillar growth strategy, substantiated by significant announcements.
- Core Payments: The landmark Wells Fargo deal for Pismo validates the strategy to embed Visa's technology into the core infrastructure of the world's largest banks.
- AI & Agentic Commerce: This moved from a concept to a tangible product vision with the unveiling of Visa CLI, aimed at capturing the emerging market for microtransactions.
- Stablecoins & Blockchain: Visa's role evolved from a "bridge" to a foundational infrastructure operator, evidenced by its new status as a network validator.
- Value-Added Services: This pillar was framed as a key beneficiary of AI, with the new Visa Large Transaction Model creating a significant competitive advantage.
- Changes vs. Prior Periods:
- From Validation to Landmark Wins: While Q1 focused on validating the strategy with accelerating metrics, Q2 delivered a landmark commercial win with Wells Fargo, providing significant validation for the Pismo acquisition thesis.
- Elevated Geopolitical Risk: The explicit call-out of the Middle East conflict as a direct headwind marks a newly elevated near-term risk.
- Aggressive Capital Allocation: The $7.9 billion share buyback, the largest in company history, signals a more aggressive capital return posture.
B. Future Considerations
- Emerging Opportunities:
- Monetizing Microtransactions: The Visa CLI concept represents a significant new opportunity to capture value from the emerging category of programmatic, machine-to-machine payments.
- Core Banking as a Service: The Pismo-Wells Fargo agreement opens a path for Visa to become a core technology provider for large-scale banking modernization projects globally.
- Transformation Initiatives:
- From Network Participant to Infrastructure Operator: Visa's decision to become a validator on blockchain networks marks a fundamental strategic shift, embedding itself into the core of the emerging on-chain financial system.
- AI as a Foundational Competitive Moat: The development of the proprietary Visa Large Transaction Model positions AI as the core engine driving the efficacy and value of the entire VAS portfolio, creating a powerful, data-driven competitive advantage.
6. Key Items to Monitor Next Quarter
A. Prior Quarter Monitoring Review
| Prior Item | Current Status | Management Commentary |
|---|---|---|
| Stablecoin Settlement Run Rate | Ahead of Schedule | The annualized run rate accelerated significantly to $7.0 billion, up more than 50% from the $4.6 billion reported in the prior quarter, far exceeding expectations of sustained momentum. |
| Pismo Commercial Traction | Achieved | Announced a landmark agreement with Wells Fargo to use Pismo for its core banking modernization, a key validation with a large financial institution. Also signed initial clients in four new countries. |
| U.S. Debit Volume Growth Trajectory | On Track | U.S. debit volume growth accelerated modestly to 7% YoY from 6% in the prior quarter. Management attributed the overall U.S. strength in part to higher tax refunds. |
| Visa Flex Credential Expansion | On Track | While no numerical update was provided, Visa announced strategic integrations of the Flex Credential with major platforms, including PayPay in Japan and the upcoming X Money service, indicating continued progress. |
| Core Cross-Border E-commerce Momentum | On Track | Constant-dollar growth accelerated to 13% YoY, up from 12% in Q1. Management noted that cryptocurrency activity remained a slight drag, implying the underlying core business is healthy and improving. |
B. Current Quarter Focus Items
| Category | Item | Timeline | What to Monitor | Why It Matters |
|---|---|---|---|---|
| Strategic | Pismo's Large Bank Pipeline | Ongoing | Announcements of new Tier 1 bank partnerships for core banking modernization, following the landmark Wells Fargo agreement. | Validates the multi-billion dollar market opportunity for core banking modernization and solidifies Pismo's role as a primary growth driver for VAS, transforming Visa into a core technology provider for the banking industry. |
| Opportunity | Agentic Commerce & Microtransaction Monetization | Next 1-2 Quarters | Progress of Visa CLI from a proof-of-concept to scaled availability, and any early metrics or partnerships related to agentic transaction volume. | This represents a new, largely unmonetized addressable market in programmatic, machine-to-machine payments. Success would create an entirely new revenue stream and reinforce Visa's infrastructure role in the future of digital commerce. |
| Risk | Geopolitical Impact on CEMEA & Cross-Border Travel | Next Quarter | The YoY payments volume growth rate in the CEMEA region and any specific management commentary on cross-border travel trends related to the Middle East conflict. | Management explicitly identified this as a headwind that caused a 2.5 point deceleration in CEMEA volume growth in Q2. A sustained slowdown could create a drag on overall international and cross-border growth rates. |
| Strategic | Evolution of Blockchain Infrastructure Role | Ongoing | Announcements of new validator or governance roles on additional blockchains, and continued growth of the $7.0 billion stablecoin settlement run rate. | This strategy moves Visa from being a network participant to an infrastructure operator, embedding it into the core of the on-chain financial system and creating a new potential revenue stream from infrastructure services. |
| Operational | AI-Enhanced VAS Product Adoption | Ongoing | Management commentary on the client adoption rates and performance of AI-embedded services, such as the Visa Large Transaction Model, which reportedly shows up to a 5x increase in fraud value capture. | AI is being positioned as a key competitive moat for the high-growth VAS business. Strong adoption proves the ROI for clients and supports the sustainability of the segment's premium growth and margins. |
Appendix: Quotes by Theme
-
Agentic Commerce Unveiled as a Major New Growth Vector: Management dedicated significant commentary to Agentic Commerce as a key long-term growth driver, framing it as a market expansion opportunity comparable to eCommerce and mobile commerce, with a specific focus on enabling a new category of microtransactions.
"We recently launched Visa CLI as a proof of concept, which shows how easy it is for a developer, soon all of us, to use their Visa credential to pay for digital services like an image, a website builder or more via the CLI... We expect more transactions, more value-added services and therefore, more revenue in the years ahead from agentic." — Ryan McInerney, CEO
-
Stablecoin Strategy Evolves from "Bridge" to Foundational "Infrastructure Operator": Visa's role in the digital asset space has rapidly progressed. After describing itself as a "bridge" in previous quarters, management now highlights its deeper integration into the core operations of blockchain networks, supported by a significant acceleration in settlement volume.
"Running a validator node moves Visa from a blockchain participant to an infrastructure leader. And in the case of Canton, where we are a super validator, Visa also helps govern the network that validates the transaction. Ultimately, we will help operate the infrastructure that can make private regulated blockchain transactions possible." — Ryan McInerney, CEO
vs Q1-FY26:
"Visa's goal remains clear: build the secure and seamless interoperable layer between stablecoins and traditional fiat payment at scale across the world." — Ryan McInerney, CEO
-
Pismo Acquisition Thesis Validated with Landmark Wells Fargo Agreement: Following initial wins with smaller fintechs and regional banks, the partnership with Wells Fargo for core banking modernization marks a significant validation of the Pismo acquisition and its strategic importance for serving large, established financial institutions.
"We're thrilled to announce that Wells Fargo has entered into an agreement to migrate to Pismo's core account ledger as part of its core banking modernization over the coming years, reflecting the strength of the partnership between Wells Fargo and Visa." — Ryan McInerney, CEO
vs Q1-FY26:
"Our thesis, when we bought Pismo was that our clients were facing big decisions on how they could modernize their tech stacks... what we're finding is that when these big sophisticated large clients really dig through the PISMO capabilities, they're extraordinarily impressed." — Ryan McInerney, CEO
-
AI Presented as a Quantifiable Performance Driver for VAS: Management provided a specific, quantifiable impact of its proprietary AI model, framing AI not as a conceptual initiative but as a core technology that is actively enhancing product performance and creating a competitive advantage.
"Our new Visa Large Transaction Model is beginning to act as the foundational model for a variety of AI-powered fraud and risk services at Visa. Early results have shown that it can power up to a 5x increase in fraud value capture." — Ryan McInerney, CEO
-
Confidence in Consumer Resilience Despite Macro Headwinds: Management reiterated its view of a resilient consumer, explicitly stating that their data does not show weakening in lower-spend segments, even while acknowledging the conflict in the Middle East as a new headwind.
"We do not see signs of the lower spend consumer weakening in our volumes." — Christopher Suh, CFO
vs Q2-FY25:
"Focusing on the US, in Q2 and through April 21, we have not seen any signs of overall consumer spending weakening... all spend bans remain resilient and consistent with past quarters." — Ryan McInerney, CEO
-
Aggressive Capital Return Signals Deep Conviction: The company executed its largest-ever quarterly share buyback and announced a new $20 billion authorization, signaling a high degree of confidence in its future growth prospects and cash generation capabilities.
"In Q2, we bought back $7.9 billion in stock, the highest quarterly buyback in Visa's history, and a tangible sign of our capital allocation strategy at work, and our belief in the long-term value of our company." — Christopher Suh, CFO
vs Q1-FY26 Analyst Q&A:
"Our approach to capital return and share buyback has largely been programmatic... but at the same time, you know, we do take advantage when we see opportunities... we'll lean in as well, and we'll continue to look for opportunities to do that." — Christopher Suh, CFO
-
Geopolitical Risk in the Middle East Emerges as a New, Explicit Headwind: For the first time, management directly cited the conflict in the Middle East as a factor impacting financial performance and near-term outlook, a notable shift from the more generalized macroeconomic commentary of prior quarters.
"In CEMEA, we saw a step down of about 2.5 points in payments volume growth in constant dollars from Q1, primarily due to the conflict in the Middle East... The Middle East conflict has introduced some near-term uncertainty, in particular to cross-border travel spend in the CEMEA region." — Christopher Suh, CFO
-
Analyst Scrutiny Shifts to Risks of Emerging Technologies: Analyst questions moved beyond understanding the opportunity of new technologies to challenging the practical implementation and risk management, particularly concerning fraud liability in a new agentic commerce world.
"I wanted to ask about the agentic commerce discussion... I'm curious about... how can you achieve something similar with a 4-party network versus a 3-party network, when it seems that issuers are going to have to buy in to whatever rule-making you decide on?" — Craig Maurer, Analyst, FT Partners
-
Framing VAS Strength as a Result of a Multi-Year Strategic Execution: Management consistently attributes the sustained, high growth in Value-Added Services not to short-term factors, but to the successful execution of a long-term strategy involving building out dedicated business units and deploying a pipeline of new, often AI-driven, products.
"I think if you just take a step back, we laid out a very clear strategy to you all at our Investor Day a couple of years ago... I think overall, what you're seeing is us executing that strategy... These are all products that we've been deploying in market, largely AI-driven products, and they've been driving broad-based out-performance across the value-added services portfolio." — Ryan McInerney, CEO
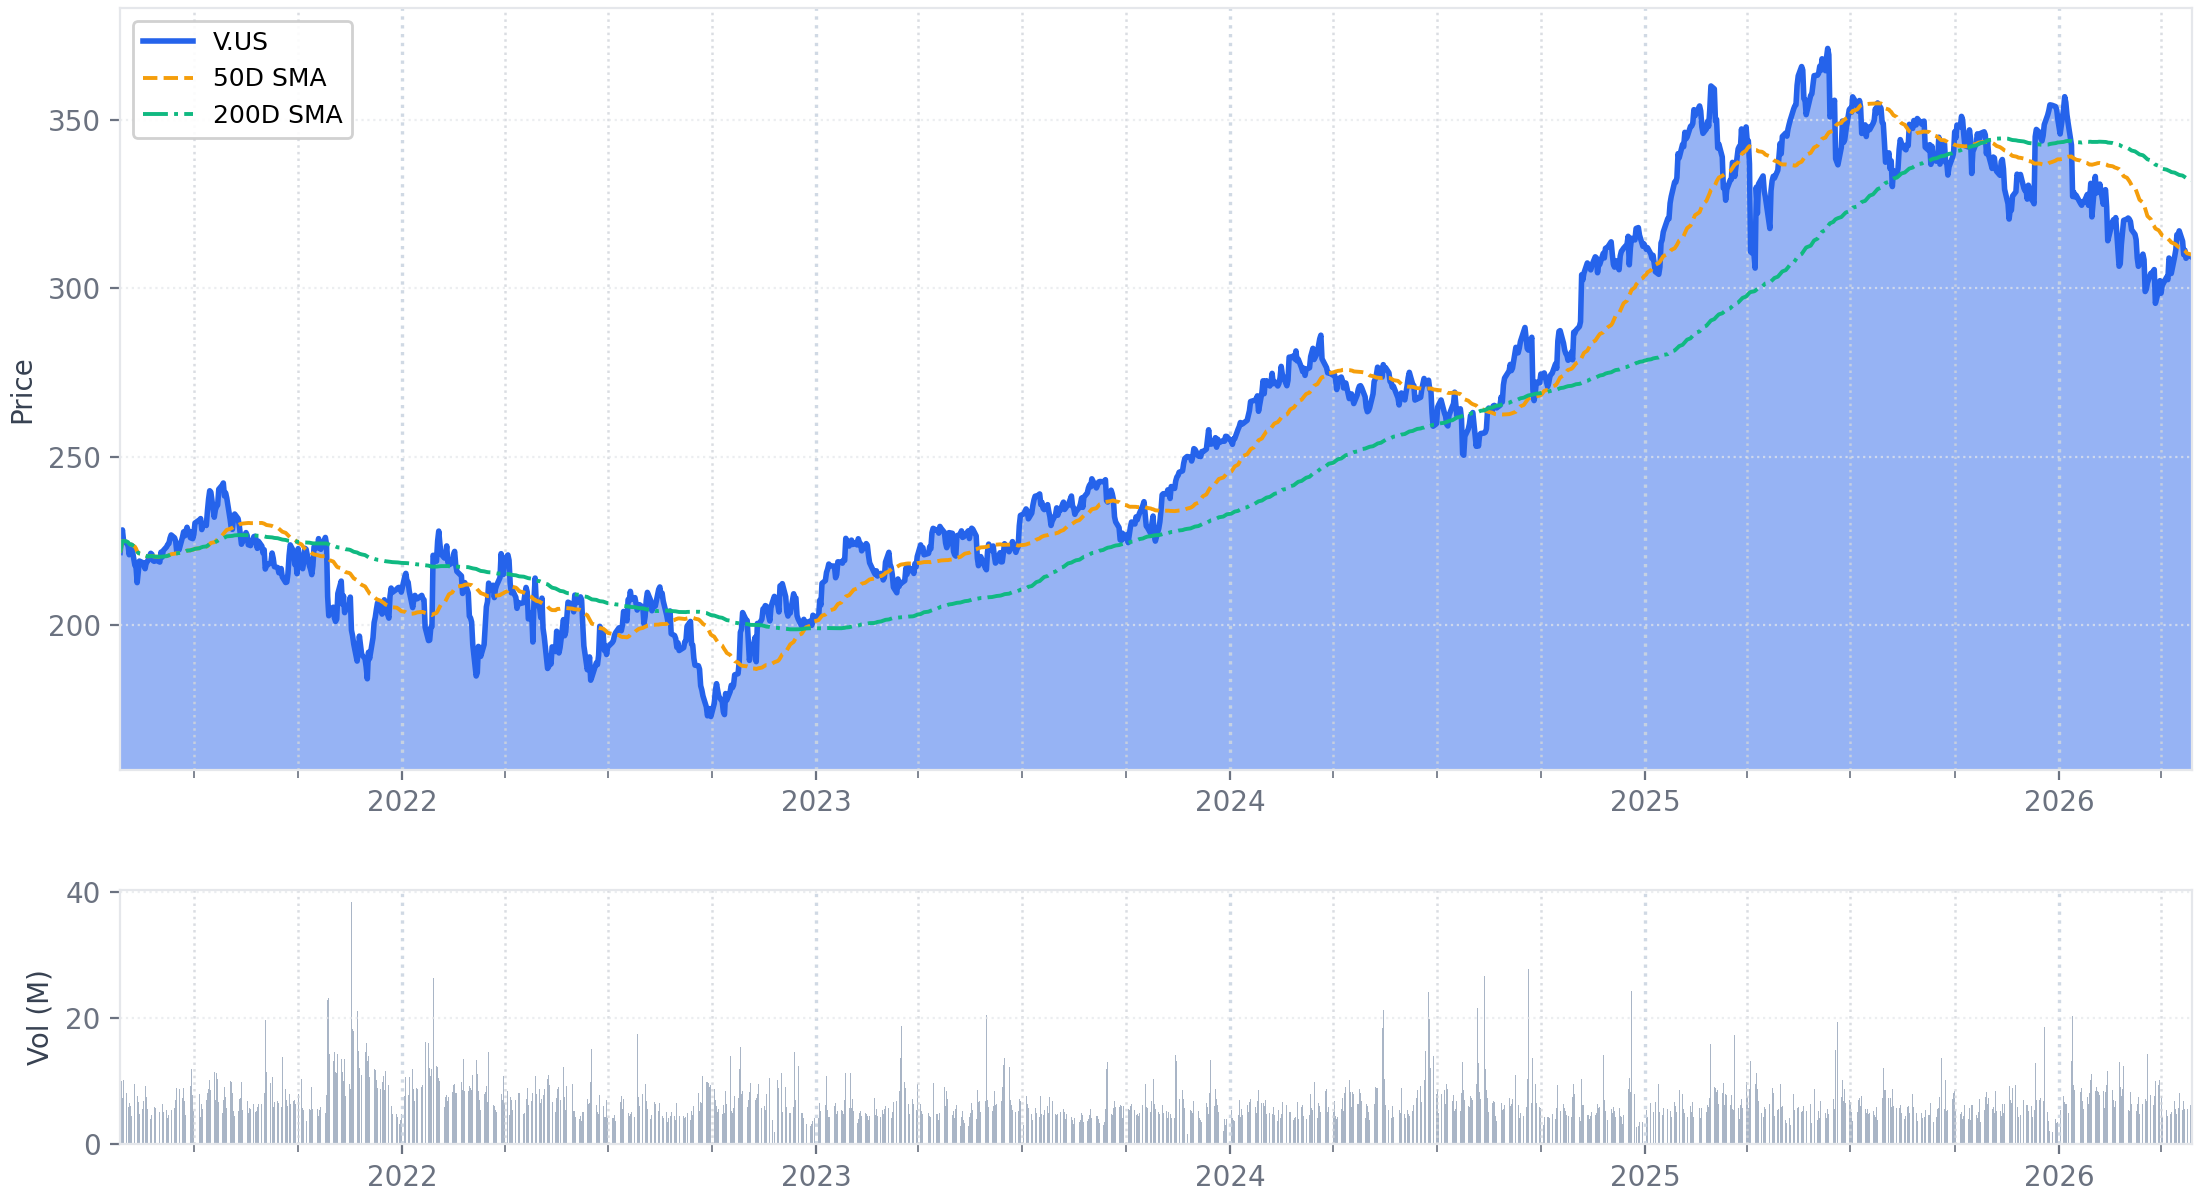
Historical Performance