Executive Summary
Kforce reported a significant operational inflection in Q1 2026, returning to year-over-year growth for the first time since 2022. Revenue reached $330.4 million, while diluted EPS of $0.46 surpassed the high end of guidance. The outperformance was primarily driven by a 60 basis point year-over-year expansion in gross margin to 27.3%, stemming from a 90 basis point improvement in Flex margins due to stronger pricing discipline and a favorable shift towards higher-value consulting work.
The positive momentum is expected to accelerate, with Q2 2026 revenue guidance of $344 million to $352 million, implying approximately 4% year-over-year growth at the midpoint. This top-line acceleration is projected to generate significant operating leverage, with the midpoint of the EPS guidance reflecting a 20% year-over-year increase.
Underlying the results are strong leading indicators, including a nearly 20% YoY increase in job orders and a recovery that management described as broad-based. Strategic initiatives are gaining traction, with the multi-shore delivery model now utilized by 60% of the company's 25 largest clients to access scarce AI talent. The company continued its aggressive capital return program, funding $18.6 million in buybacks and dividends with increased debt, signaling management's confidence in a disconnect between its operating trends and stock valuation.
The results confirm a cyclical upswing is underway, complemented by a structural improvement in profitability. This combination of accelerating demand and demonstrated pricing power positions Kforce for enhanced operating leverage as the cycle matures.
1. Financial Performance Summary
A. Income Statement Metrics
Kforce reported Q1 2026 revenue of $330.4 million, marking a return to year-over-year growth for the first time in several years. The performance met the upper end of management's prior revenue guidance ($324M–$332M). Diluted EPS of $0.46 beat the high end of guidance ($0.37–$0.45), driven by better-than-expected revenue and gross margin performance. Gross margin expanded by 60 basis points year-over-year to 27.3%, primarily due to a 90 basis point improvement in Flex gross profit margins.
| Metric | Q1 2026 | Q1 2025 | Change | Notes |
|---|---|---|---|---|
| Total Revenue | $330.4M | $330.0M | ↑ 0.1% | Met the upper end of guidance ($324M–$332M). First YoY growth since Q4 2022. |
| Technology Revenue | $306.0M | $306.3M | ↓ 0.1% | Represents 92.6% of total revenue. |
| Finance & Accounting (FA) Revenue | $24.4M | $23.7M | ↑ 2.8% | — |
| Gross Profit | $90.1M | $88.3M | ↑ 2.0% | Gross margin was 27.3%, up 60 bps from 26.7% in Q1 2025. |
| GAAP Operating Income | $12.0M | $11.6M | ↑ 3.2% | Operating margin was 3.6%, up 10 bps from 3.5% in Q1 2025. |
| GAAP Net Income | $7.9M | $8.1M | ↓ 2.7% | — |
| GAAP EPS (Diluted) | $0.46 | $0.45 | ↑ 2.2% | Beat the high end of guidance ($0.37–$0.45). |
| Adjusted EBITDA[1] | $16.9M | $16.8M | ↑ 0.9% | Adjusted EBITDA margin was 5.1%, flat YoY. |
Footnotes
- Adjusted EBITDA is a non-GAAP measure defined by the company. For Q1 2026, the reconciliation is: Net Income ($7.9M) + D&A ($1.3M) + Stock-based Comp ($3.6M) + Interest ($0.6M) + Taxes ($3.4M) = $16.9M.
B. Balance Sheet Highlights
The company ended the quarter with net debt of $90.2 million, an increase from $64.3 million at the end of Q4 2025. The increase was driven by share repurchases of $11.8 million and dividend payments of $6.8 million during a seasonally low cash flow quarter. Management noted that leverage remains conservative at 1.2x trailing 12-month EBITDA.
| Metric | Mar 31, 2026 | Dec 31, 2025 | Change | Notes |
|---|---|---|---|---|
| Cash and Cash Equivalents | $1.3M | $2.1M | ↓ 37.5% | — |
| Total Debt[1] | $94.9M | $69.7M | ↑ 36.1% | Increase driven by borrowings on the credit facility. |
| Net Debt[2] | $90.2M | $64.3M | ↑ 40.3% | Increase driven by capital returns to shareholders. |
| Accounts Receivable, net | $207.3M | $190.5M | ↑ 8.8% | Sequential increase reflects timing of cash collections. |
| Total Stockholders' Equity | $117.4M | $124.6M | ↓ 5.8% | Decrease reflects share repurchases and dividends exceeding net income. |
Footnotes
- Total Debt is calculated as Long-term debt – credit facility ($91.5M) plus Current portion of operating lease liabilities ($3.4M).
- Net Debt is calculated as Long-term debt – credit facility ($91.5M) less Cash and cash equivalents ($1.3M), consistent with management's commentary on the call.
C. Cash Flow Analysis
Operating cash flow was negative for the quarter, which management attributed to higher cash outflows associated with restructuring actions announced in Q4 and the timing of cash collections. The company expects operating cash flows to normalize and be approximately $20 million in Q2. Kforce returned $18.6 million to shareholders through share repurchases and dividends.
| (In Thousands) | Three Months Ended Mar 31, 2026 | Three Months Ended Mar 31, 2025 | Change | Notes |
|---|---|---|---|---|
| Net Cash from Operating Activities | ($4,055) | $249 | N/M | Management expects a rebound to ~$20M in positive OCF in Q2 2026. |
| Share-Based Compensation | $3,590 | $3,656 | ↓ 1.8% | Represents a material non-cash item. |
| Capital Expenditures | ($3,345) | ($4,149) | ↓ 19.4% | — |
| Free Cash Flow (GAAP)[1] | ($7,400) | ($3,900) | ↑ 89.7% outflow | — |
| Dividend Payments | ($6,821) | ($7,051) | ↓ 3.3% | — |
| Share Repurchases | ($11,683) | ($21,066) | ↓ 44.5% | — |
| Total Capital Returned[2] | ($18,504) | ($28,117) | ↓ 34.2% | Represents 2.5x the free cash flow deficit. |
| Net Debt Issuance | $25,100 | $32,800 | ↓ 23.5% | Net proceeds from the credit facility used to fund operations and capital returns. |
Footnotes
- Free Cash Flow is a non-GAAP measure, calculated as Net Cash from Operating Activities less Capital Expenditures.
- Total Capital Returned is the sum of Dividend Payments and Share Repurchases.
D. Key Financial Ratios
Management highlighted the company's leverage and return on equity metrics, indicating a stable and healthy financial profile despite the quarterly cash burn.
| Metric | Q1 2026 | Notes |
|---|---|---|
| Net Debt to Adjusted EBITDA | 1.2x | Based on trailing 12-month EBITDA; management described this as "relatively conservative." |
| Return on Equity | ~30% | Figure per management commentary. |
E. Operational Metrics
Flex gross profit margin improved across the total firm by 90 basis points year-over-year, driven by a 70 basis point improvement in bill-pay spreads and lower healthcare costs. The average bill rate in the Technology segment remained stable at approximately $90 per hour, a level maintained for the last three years.
| Metric | Q1 2026 | Q4 2025 | Q1 2025 | Notes |
|---|---|---|---|---|
| Billing Days | 63 | 62 | 63 | — |
| Total Firm | ||||
| Flex Revenue | $324.2M | $326.1M | $322.6M | ↑ 0.5% YoY, ↓ 0.6% QoQ. |
| Flex Gross Profit % | 25.9% | 25.8% | 25.0% | ↑ 90 bps YoY, driven by spread improvement and lower healthcare costs. |
| Direct Hire Revenue | $6.1M | $5.9M | $7.5M | ↓ 17.8% YoY, ↑ 3.6% QoQ. |
| Technology Segment | ||||
| Flex Revenue | $303.0M | $303.6M | $302.4M | ↑ 0.2% YoY, ↓ 0.2% QoQ. |
| Flex Gross Profit % | 25.7% | 25.7% | 24.9% | ↑ 80 bps YoY, flat sequentially. |
| Average Bill Rate | ~$90/hr | ~$90/hr | ~$90/hr | Management noted bill rates have been stable for three years. |
| Finance & Accounting Segment | ||||
| Flex Revenue | $21.3M | $22.5M | $20.1M | ↑ 5.7% YoY, ↓ 5.6% QoQ. |
| Flex Gross Profit % | 27.9% | 28.3% | 27.2% | ↑ 70 bps YoY, ↓ 40 bps QoQ. |
2. Forward-Looking Guidance
A. Guidance Summary
Kforce introduced an outlook for Q2 2026 that projects accelerating year-over-year revenue growth of approximately 4% at the midpoint. Management expects this top-line momentum to drive significant operating leverage, with the midpoint of the EPS guidance of $0.67 to $0.75 reflecting a 20% year-over-year increase. The company also reaffirmed its long-term profitability target, slightly strengthening the language to achieving "at least 8%" operating margin when revenues return to $1.7 billion.
| Metric | Period | Current Guidance | Management Commentary |
|---|---|---|---|
| Revenue | Q2 2026 | $344M – $352M | Midpoint of $348M reflects ~4% YoY growth and a similar sequential increase on a per-billing-day basis. |
| EPS (Diluted) | Q2 2026 | $0.67 – $0.75 | Midpoint reflects a 20% increase year-over-year, indicating significant operating leverage. |
| Gross Margin % | Q2 2026 | 27.7% – 27.9% | Sequential improvement reflects the alleviation of seasonal payroll taxes. |
| Operating Margin % | Q2 2026 | 5.0% – 5.4% | Significant sequential improvement from 3.6% in Q1 2026. |
| Operating Margin % | Long-Term | At least 8% | Target is for when annual revenues return to $1.7 billion. This is over 100 bps higher than the margin achieved at that revenue level in 2022. |
B. Additional Notes & Commentary
-
Billing Days:
- Q2 2026: 64 days (one additional day compared to Q1 2026 and the same as Q2 2025).
-
Q2 2026 Financial Metrics (from filing):
- Flex Margin %: 26.4% – 26.6%
- SG&A as % of Revenue: 22.1% – 22.3%
- Weighted Average Shares: Approximately 16.9 million.
- Effective Tax Rate: Approximately 31.0%.
-
Cash Flow:
- Management expects positive operating cash flows of approximately $20 million in Q2, a significant recovery from the negative $4.1 million in Q1. This is attributed to the normalization of cash collections.
-
Capital Allocation:
- Dividend: The Board of Directors approved a quarterly cash dividend of $0.40 per share, payable in June 2026.
- Share Repurchases: The company plans to continue returning excess cash to shareholders through repurchases after funding capital requirements and dividends.
3. Operational & Strategic Developments
A. Business Performance & Operations
Management reported a significant positive inflection in business activity, with leading indicators suggesting an accelerating recovery.
-
Demand Trends & Leading Indicators:
- The recovery appears broad-based, with management citing year-over-year growth in six of the company's top 10 industry sectors, with particular strength noted in information, manufacturing, and retail.
- Front-end key performance indicators (KPIs) have shown notable improvement, supporting the positive outlook:
- Client visits in Q1 were up nearly 10% year-over-year.
- Job orders increased by nearly 20% year-over-year.
- This activity translated into new assignment starts growing in the low double-digits.
- The Q1 sequential revenue decline was "meaningfully better" than the 15-year historical average, driven by lower project ends and a faster rebound in new assignments.
-
Nature of Demand:
- Clients are reportedly greenlighting long-postponed initiatives, using flexible talent to address a significant backlog of projects. This demand is not limited to AI-related work but also includes a ramp-up in traditional platform and application development.
- Management estimated that nearly 100% of roles have changed over the past five years, with most requirements now having some AI aspect embedded, even in traditional job functions.
-
Pricing and Margin Environment:
- Flex gross profit margins expanded by 90 basis points year-over-year, a key driver of the quarter's outperformance. Management attributed this primarily to internal execution rather than a change in the competitive landscape.
- 70 basis points of the improvement came from stronger bill-pay spreads, driven by more effective pricing and a higher mix of consulting-oriented work.
- 20 basis points came from lower healthcare costs.
- The average Technology bill rate remained stable at approximately $90 per hour, a level maintained for three years. This stability is achieved through a "netting effect" where the growing mix of higher-margin consulting work (which carries a 400-600 bps higher margin profile) is offsetting the downward pressure from a greater mix of lower-cost offshore and nearshore consultants.
- Flex gross profit margins expanded by 90 basis points year-over-year, a key driver of the quarter's outperformance. Management attributed this primarily to internal execution rather than a change in the competitive landscape.
B. Strategic Initiatives
Kforce continues to execute on its core strategic initiatives, which management credits for the recent market outperformance and improved profitability profile.
-
Global Delivery Model (India):
- The company's multi-shore delivery model is gaining significant traction and is seen as a key differentiator.
- Adoption has accelerated, with 60% of Kforce's 25 largest clients now utilizing the blended model, which combines domestic and offshore resources.
- Management noted that the talent pool in India is particularly strong for in-demand AI skills, helping to address talent shortages in the U.S.
- While the margin impact from the offshore business is currently "nominal," management sees it as a future opportunity for margin enrichment as the business scales.
-
AI Innovation Studio:
- Kforce recently established an AI Innovation Studio at its headquarters and associated AI pods in India.
- The initiative is designed to move beyond PowerPoint presentations to develop tangible, working prototypes for clients, helping with ideation and accelerating development cycles. This allows clients to test solutions in a dedicated environment outside of their own.
-
Enterprise Transformation (Workday): The implementation of Workday is progressing as a key long-term initiative. Management reiterated that they expect to realize more significant benefits from this platform in the second half of 2027.
-
"One Kforce" Integrated Strategy: Management stated that their go-to-market approach, which leverages the firm's full capabilities across all service offerings, is "paying dividends" and contributing to the recent success in winning more meaningful client engagements.
C. Risk Factors & Headwinds
-
Negative Cash Flow and Increased Leverage: The company experienced a negative operating cash flow of $4.1 million and negative free cash flow of $7.4 million in Q1. This, combined with returning $18.6 million to shareholders, drove an increase in net debt to $90.2 million and leverage to 1.2x TTM EBITDA. Management characterized this as a temporary issue resulting from seasonal factors and restructuring payments, and projects a strong rebound to ~$20 million in positive operating cash flow in Q2.
-
Geopolitical Uncertainty (New Mention): Management introduced a new external risk factor, noting that "heightened geopolitical uncertainty, including the conflict involving Iran has contributed to significant volatility in the global energy markets." They believe this uncertainty reinforces the value of flexible talent solutions as clients prioritize agility. This was not a factor discussed in prior quarters.
4. Q&A Session Key Themes
The Q&A session was characterized by a constructive tone, with analysts shifting focus from the sustainability of the recovery (the main theme in Q4) to understanding the specific drivers behind the accelerating growth and margin expansion.
A. Analyst Focus Areas
-
Drivers of Accelerating Growth: Analysts repeatedly probed the sources of the strong Q2 guidance. Management described the recovery as "broad-based," noting it was not concentrated in any single area but evident across enterprise and market accounts, geographies, and six of their top ten industry verticals. They supported this with strong leading indicators from Q1, including a nearly 10% year-over-year increase in client visits and a nearly 20% rise in job orders.
-
Margin Expansion Mechanics: A primary focus was on how Kforce is improving margins, particularly the 90 basis point year-over-year expansion in Flex gross profit margin. Management attributed this almost entirely to internal execution, not a change in the competitive landscape, citing a 70 basis point improvement from bill-pay spreads and a growing mix of higher-value Consulting Solutions business, which carries a margin profile that is 400 to 600 basis points higher than traditional staffing.
-
Strategic Impact of India Operations: Multiple questions explored the role of the India development center. Management clarified its strategic purpose is to "enhance the capabilities of our domestic footprint," not to capture India-native business. The model is gaining significant traction, with 60% of the company's top 25 clients now using it in a blended-shore model. A key new insight was the emphasis on India as a source of scarce talent, particularly for AI-related skills.
-
Nature of the Cyclical Recovery: Analysts questioned how a staffing recovery could occur without a broad economic recession. CEO Joe Liberatore articulated the view that while a GDP-oriented recession did not occur, the professional services sector experienced a three-year "job recession" driven by post-pandemic labor hoarding. He argued that companies have now reached a baseline headcount and must turn to flexible talent to address pent-up project demand.
-
Balance Sheet and Capital Allocation: The company’s aggressive capital return strategy was a key topic. An analyst directly questioned the practice of returning capital in excess of free cash flow. The CFO defended the strategy, stating the company is comfortable outstripping operating cash flow due to a perceived "disconnect between our operating trends...and the valuation of our stock" and that leverage at 1.2x TTM EBITDA is considered conservative.
B. Key Challenges & Concerns
The session lacked significant challenges or expressions of concern. The tone was uniformly positive, with questions aimed at understanding the mechanics of success rather than questioning the narrative. The most persistent line of inquiry was around the source of margin strength, with management successfully positioning the improvement as a durable, controllable factor rather than a temporary market condition.
5. Strategic Themes & Inflection Points
A. Current Period Themes
-
Dominant Narratives: Management's narrative has decisively shifted from recovery to accelerating growth. The achievement of year-over-year revenue growth for the first time in several years is presented as a key inflection point. The core story combines capturing broad-based demand with demonstrating significant operational leverage, driven by strong internal execution on pricing and strategic mix shifts that are expanding gross margins.
-
Changes from Prior Periods:
- Definitive Tone Shift: The tone has evolved from confident optimism in Q4 2025 to a declarative confirmation of a cyclical upswing in Q1 2026. The conversation has moved from anticipating a return to growth to delivering it and forecasting its acceleration.
- New External Risk Factor: Management introduced heightened geopolitical uncertainty (specifically the conflict involving Iran) as a new macro consideration, framed as a potential tailwind that reinforces the value of flexible talent solutions.
B. Future Considerations
-
Emerging Opportunities: The AI-driven demand cycle is maturing from a concept to a tangible growth driver. Management is building capabilities to capture this with the establishment of an AI Innovation Studio and AI pods in India, supported by a data and AI project pipeline that is up nearly 50% year-over-year.
-
External Environment: A central theme is the apparent decoupling of the company's performance from the broader macro environment. Management's view is that a multi-year "job recession" specific to the professional services sector has concluded, and a cyclical upswing is now underway for high-end technology talent.
-
Transformation Initiatives: The path to higher long-term profitability is becoming clearer. The significant gross margin expansion achieved in Q1 provides a powerful complement to the $7 million in annualized cost savings announced in Q4. Together, these factors strengthen the credibility of management's reaffirmed long-term target of achieving at least an 8% operating margin when annual revenues return to the $1.7 billion level.
6. Key Items to Monitor Next Quarter
A. Prior Quarter Monitoring Review
| Prior Item | Current Status | Management Commentary |
|---|---|---|
| Conversion of Leading Indicators to Revenue Growth | Achieved | Management's Q2 guidance for ~4% year-over-year revenue growth at the midpoint confirms that the strong leading indicators from Q4 (record client visits, strong order flow) successfully translated into an accelerating growth trajectory. |
| Realization of Cost-Saving Benefits | On Track | The Q2 guidance projects a 20% year-over-year increase in EPS, which implies significant operating leverage is materializing. Management credited refinements to headcount for providing incremental leverage. |
| Cash Flow vs. Capital Return Imbalance | On Track | The imbalance intensified in Q1, with negative operating cash flow of $4.1M and $18.6M in capital returns, driving net debt higher. However, management provided a clear forecast for this to normalize with ~$20M in positive operating cash flow expected in Q2. |
| Acceleration of Multi-Shore Delivery Model | Achieved | Management confirmed demand "continues to accelerate" and provided a new metric: the multi-shore model is now being utilized by 60% of the company's 25 largest clients, validating strong adoption. |
| Direct Hire Market Dynamics | No Update | The specific dynamics of direct hire demand between small/mid-sized businesses and large enterprises were not discussed in the current period's call. |
B. Current Quarter Focus Items
| Category | Item | Timeline | What to Monitor | Why It Matters |
|---|---|---|---|---|
| Operational | Flex Gross Margin Spread Sustainability | Next Quarter | Whether the company can maintain the strong bill-pay spreads achieved in Q1. Any deviation from management's forecast for stability would signal a change in the pricing environment or execution discipline. | The 70 basis points of spread expansion was the primary driver of the gross margin outperformance and earnings beat. Sustaining this new, higher level is critical to achieving the guided operating leverage and validating that the improvement is structural. |
| Opportunity | Conversion of Data & AI Pipeline | Next 1-2 Quarters | Evidence that the reported ~50% year-over-year growth in the data and AI pipeline is converting into booked revenue, potentially driving top-line growth above the guided mid-single-digit rate in future quarters. | This is the strongest leading indicator of future growth potential and validates the company's strategic positioning for the AI investment cycle. Successful conversion would signal a durable, multi-quarter growth tailwind. |
| Risk | Normalization of Cash Flow and Balance Sheet Leverage | Next Quarter | Whether the company delivers on its projection of ~$20 million in positive operating cash flow in Q2. Monitor the trajectory of net debt and leverage (currently 1.2x) to confirm the balance sheet stabilizes after the Q1 increase. | The aggressive capital return strategy has increased leverage and relied on debt. A failure to normalize cash flow would question the sustainability of the buyback and dividend program and could constrain future financial flexibility. |
| Strategic | Deepening of Multi-Shore Client Penetration | Ongoing | Any updates on the percentage of top clients using the multi-shore model (beyond the 60% baseline) and commentary on the size and strategic nature of these engagements, particularly related to scarce AI talent. | This model is critical for protecting overall bill rates and accessing in-demand AI talent. Deeper penetration within major accounts validates the strategy's value proposition and provides long-term, structural support for gross margins. |
| Operational | Durability of Broad-Based Demand | Ongoing | Commentary on whether the demand recovery remains widespread across multiple industry verticals and skill sets, including traditional application development, or if it narrows to specific areas. | A broad-based recovery is more durable and less susceptible to a slowdown in a single technology trend. It would confirm a healthier, more typical cyclical upswing is underway, supporting sustained, high-quality growth. |
Appendix: Quotes by Theme
-
Market Environment: Declaring the End of a Three-Year "Job Recession": Management's commentary shifted from observing a building recovery in Q4 to definitively stating that the cycle has turned. The core thesis is that a multi-year period of labor hoarding has ended, forcing companies to now rely on flexible talent to address a significant project backlog, mirroring historical recovery patterns.
"For professionally oriented roles, there has been a job recession... our belief is we've now, over the course of 3 years, organizations by natural attrition versus rightsizing have basically gotten to a baseline of workers that they can't support the work that needs to be done. So we're at that same point that we historically have seen during normal recessionary cycles." — Joseph Liberatore, CEO
vs. Q4 2025:
"Our recent momentum and operating trends suggest to us that clients may be reaching a point where they can no longer wait to execute their long-term roadmap of critical technology needs and are looking to begin addressing the significant backlog of initiatives." — David Kelly, COO
vs. Q1 2025:
"The general tonality, as we sit here today is that the earlier optimism has waned to a degree and the macro uncertainties have increased, which may delay in acceleration of investment for many companies." — Joe Liberatore, CEO
-
Leading Indicators: Providing Hard Metrics to Support the Recovery Narrative: After citing January as the "best start since 2022" in the prior quarter, management provided specific, strong quantitative leading indicators to substantiate their claims of accelerating demand.
"When you look at client visit information in the first quarter, that really is up nearly 10% year-over-year. We've had some good strength from a job order perspective as well. That's up nearly 20% year-over-year, really translating into some good new assignment starts really that also in the low double digits." — David Kelly, COO
vs. Q4 2025:
"This momentum appears to be carrying over into the first quarter as January results suggest that 2026 is our best start since 2022... I think our client visits in Q1 so far are the highest levels that I can recall maybe in our firm history." — Joseph J. Liberatore, CEO
-
Margin Expansion: Attributed to Internal Execution, Not Market Dynamics: Management was definitive that the significant 90 basis point year-over-year improvement in Flex gross margin was driven by company-specific actions—pricing discipline, sales incentives, and a strategic mix shift—rather than any change in the competitive landscape.
"I don't think the competitive environment itself is becoming any tighter or any looser. As you mentioned on the margin question in my commentary earlier, much of this is execution and mix driven within our business... I do not believe that it's a competitive change in the marketplace." — Jeffrey Hackman, CFO
-
Multi-Shore Delivery (India): Evolving from a Cost Tool to a Strategic Talent Solution: The narrative around the India delivery center has matured. Management provided a key adoption metric for the first time (60% of top clients) and shifted the emphasis from a cost-effective alternative to a strategic necessity for accessing scarce, high-demand AI talent.
"60% of our 25 largest clients are using those services in a blended model... that talent level, especially when you get into AI skills of what we're identifying and finding in India, real shortage in the U.S. We're definitely seeing much more talent availability, especially from an AI standpoint." — David Kelly, COO & Joseph Liberatore, CEO
vs. Q4 2025:
"We began to see an acceleration in demand for this offering over the last few months, which is an encouraging sign as we head into 2026." — David Kelly, COO
-
AI's Impact on Roles: Pervasive Augmentation, Not Just New Job Creation: Management articulated a nuanced view that AI's primary near-term impact is the reshaping of nearly all existing technology roles, rather than the creation of entirely new job titles, making AI skills a prerequisite across the board.
"Virtually almost 100% of what we're doing today didn't exist 5 years ago because even the traditional roles that still exist today that existed 5 years ago, now they're being augmented with certain skills in AI. The bulk of the requirements that our people are coming across, some type of AI aspect is embedded in virtually every role that we're working on." — Joseph Liberatore, CEO
-
Capital Allocation Philosophy: Justifying Increased Leverage to Capitalize on Valuation Disconnect: In response to direct analyst questions about returning capital in excess of free cash flow, the CFO articulated a clear rationale for increasing leverage, citing a perceived dislocation between the company's improving operational trends and its stock valuation.
"Certainly, in the first quarter, it looked like there was a significant dislocation between the underlying trends in the business and how the market was perceiving that with the valuation of our stock. So we're very comfortable outstripping the operating cash flows certainly in the first quarter. That led to debt of roughly $90 million, 1.2x levered." — Jeffrey Hackman, CFO
-
Analyst Sentiment & Focus: Shifting from "If" a Recovery to "How" to Model the Acceleration: Analyst questions have moved past questioning the validity of the recovery and are now focused on understanding the specific drivers of outperformance and the mechanics of the accelerating growth and margin expansion.
"Congratulations on the strong quarter and the even better guide. I was wondering if you could just talk a little bit about what you're seeing in terms of your trends by major verticals? And... can you talk about any sort of new contracts that you may have won or gains that you're seeing among existing clients?" — Mark Marcon, Analyst, Baird
vs. Q4 2025:
"If the trends kinda continue the way are, you anticipate we've kinda turned the corner and we should see positive revenue growth kinda year over year going forward for the rest of 2026." — Kartik Mehta, Analyst, Northcoast Research
-
External Risk Environment: Introducing Geopolitical Uncertainty (New Mention): For the first time in recent quarters, management explicitly cited geopolitical events as a macro risk factor, framing the resulting uncertainty as a potential tailwind that reinforces the value of flexible workforce solutions.
"Heightened geopolitical uncertainty, including the conflict involving Iran has contributed to significant volatility in the global energy markets... In this environment, clients are focused on agility. We believe uncertainty is reinforcing the value of flexible workforce solutions." — Joseph Liberatore, CEO
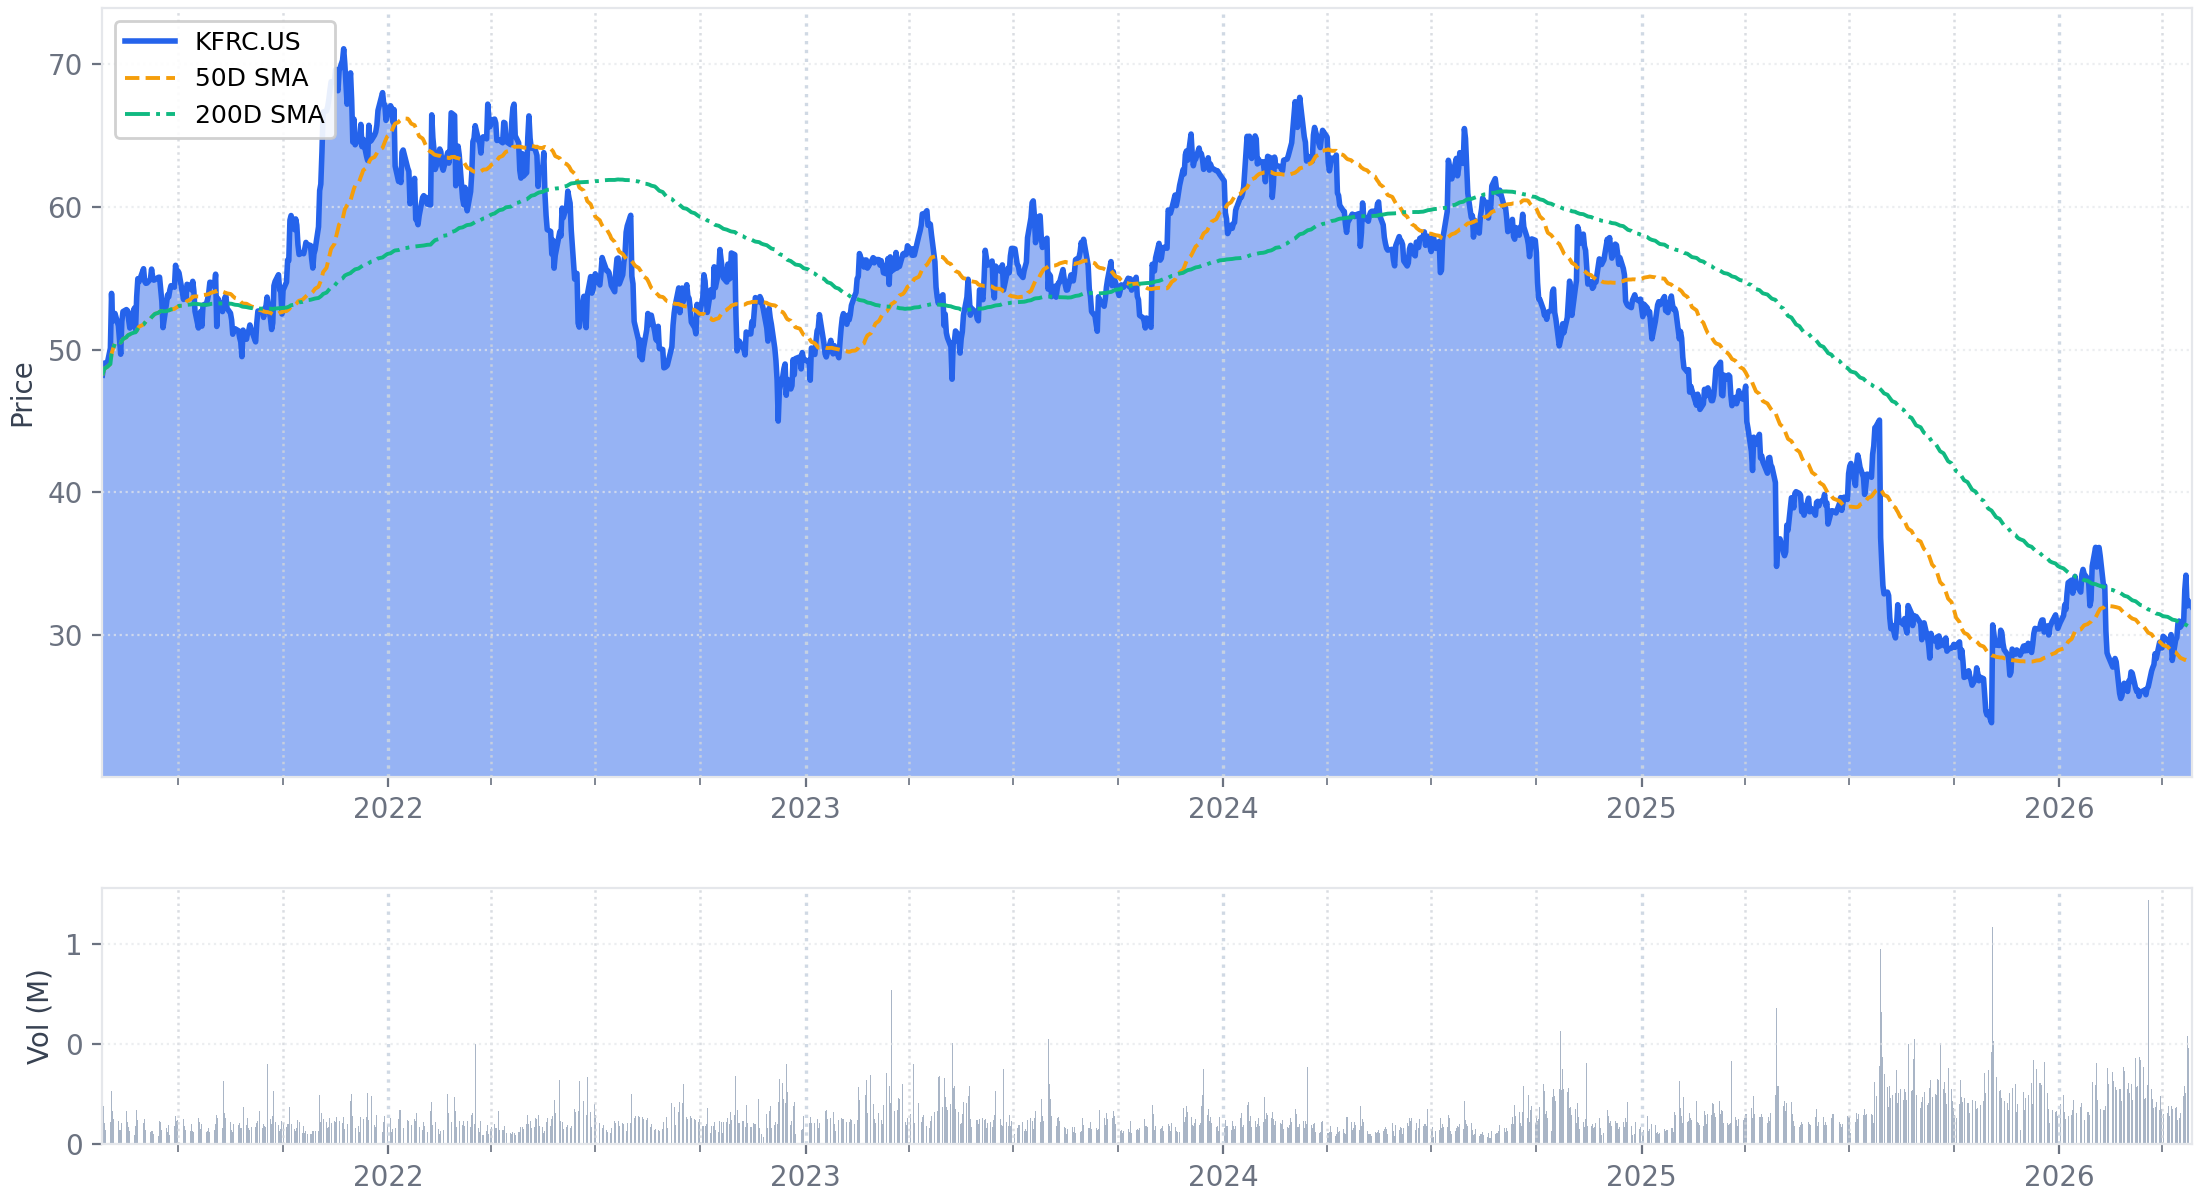
Historical Performance