Executive Summary
Sunbelt Rentals reported Q1 FY2027 rental revenue growth of 12.5% to $2,927 million, prompting an upward revision to full-year targets. Full-year FY2027 rental revenue guidance was raised to 7%–10% and adjusted EBITDA guidance to $4.92B–$5.12B. Top-line expansion was led by North America Specialty rental revenue (+25.3%), alongside 7.4% growth in General Tool. The FIFA World Cup contributed ~250 bps and the Aries acquisition added ~100 bps to quarterly rental growth.
Profitability showed divergent trends as adjusted operating profit margin expanded 60 bps to 24.4%, aided by depreciation leverage, while adjusted EBITDA margin contracted 100 bps to 42.2%. Management attributed approximately three-quarters of the EBITDA margin compression to outsized expansion in lower-margin ancillary revenues. Full-year gross rental CapEx guidance was raised to $2.75B–$3.15B to support committed mega-project and energy demand. First-quarter free cash flow contracted to $70 million due to stepped-up equipment purchases and prior-quarter landing payments, moving net leverage to 1.8x.
For investors, top-line momentum confirms expanding demand across mega projects and energy solutions, but full-year margin stabilization requires realizing fuel surcharge recoveries and navigating supplier bottlenecks as fleet investment accelerates.
1. Financial Performance Summary
A. Income Statement Metrics
| Metric | Q1 FY2027 | Q1 FY2026 | Change (%) | Notes |
|---|---|---|---|---|
| Total Revenues | $3,115M | $2,801M | +11.2% | Equipment rentals +12.5%, rental equipment sales -17.5%, new equipment/merchandise sales +6.2%. Exceeded the run-rate of initial full-year FY2027 guidance (4.5%–7.5%). |
| - Equipment Rentals Revenue | $2,927M | $2,601M | +12.5% | Aries contributed ~100 bps and the FIFA World Cup contributed ~250 bps. Exceeded the initial full-year FY2027 guidance range (5.0%–8.0%). |
| - Sales of Rental Equipment | $85M | $103M | -17.5% | Management cited higher recovery rates, pointing to demand and price stabilization in the used equipment channel. |
| - Sales of New Equipment, Merchandise and Consumables | $103M | $97M | +6.2% | Growth supported by higher sales in Specialty and Modular Solutions. |
| Revenue by Segment | — | — | — | — |
| - North America General Tool | $1,743M | $1,649M | +5.7% | Equipment rentals +7.4% to $1,648M; rental equipment sales -23.9% to $54M; new equipment/merchandise sales -4.7% to $41M. |
| - North America Specialty | $1,132M | $909M | +24.5% | Equipment rentals +25.3% to $1,070M; rental equipment sales -13.0% to $20M; new equipment/merchandise sales +31.3% to $42M. Aries contributed ~300 bps to rental revenue growth. |
| - United Kingdom | $240M | $243M | -1.2% | Equipment rentals -1.4% to $209M; rental equipment sales +22.2% to $11M; new equipment/merchandise sales -9.1% to $20M. |
| Gross Profit | $1,249M | $1,123M | +11.2% | Gross margin was flat at 40.1% vs. 40.1% in Q1 FY2026. |
| Operating Income (GAAP) | $691M | $596M | +15.9% | Operating margin expanded 90 bps to 22.2% vs. 21.3% in Q1 FY2026. |
Adjusted Operating Profit (Non-GAAP)[1] |
$759M | $667M | +13.8% | Adjusted operating margin expanded 60 bps to 24.4% vs. 23.8% in Q1 FY2026. Expansion driven by depreciation expense leverage and SG&A leverage. |
| - North America General Tool | $539M | $519M | +3.9% | Margin compressed 60 bps to 30.9% vs. 31.5% in the prior year due to higher fuel costs and repositioning expenses. |
| - North America Specialty | $373M | $300M | +24.3% | Margin was flat at 33.0% vs. 33.0% in the prior year, supported by >40% growth in ancillary revenues. |
| - United Kingdom | $20M | $20M | 0.0% | Margin expanded 10 bps to 8.3% vs. 8.2% in the prior year, reflecting operational efficiency initiatives. |
| Net Income (GAAP) | $438M | $373M | +17.4% | Net margin expanded 80 bps to 14.1% vs. 13.3% in Q1 FY2026. |
Adjusted Pre-Tax Profit (Non-GAAP)[2] |
$652M | $572M | +14.0% | Pre-tax margin expanded 50 bps to 20.9% vs. 20.4% in Q1 FY2026. |
| Diluted EPS (GAAP) | $1.07 | $0.87 | +23.0% | Basic EPS was $1.07 vs. $0.87 (+23.0%). Benefited from operating income growth and share repurchases. |
Adjusted EPS (Non-GAAP)[3] |
$1.18 | $0.98 | +20.4% | Record first-quarter adjusted EPS; benefited from higher operating profit and lower share count. |
EBITDA (Non-GAAP)[4] |
$1,283M | $1,174M | +9.3% | EBITDA margin was 41.2% vs. 41.9% in Q1 FY2026 (-70 bps). |
Adjusted EBITDA (Non-GAAP)[4] |
$1,315M | $1,210M | +8.7% | Adjusted EBITDA margin compressed 100 bps to 42.2% vs. 43.2% in Q1 FY2026. Management attributed ~75% of the year-over-year margin contraction to outsized growth in lower-margin ancillary revenues. |
| - North America General Tool | $898M | $870M | +3.2% | Margin compressed 130 bps to 51.5% vs. 52.8% in Q1 FY2026; ~50% of the compression was driven by higher fuel expenses. |
| - North America Specialty | $519M | $436M | +19.0% | Margin compressed 220 bps to 45.8% vs. 48.0% in Q1 FY2026; ~75% of the compression was driven by relative growth of ancillary revenues. |
| - United Kingdom | $61M | $65M | -6.2% | Margin compressed 130 bps to 25.4% vs. 26.7% in Q1 FY2026. |
Footnotes
- Adjusted Operating Profit reconciliation: Q1 FY2027 GAAP Operating Income of $691M excludes amortization of acquired intangibles ($29M), stock-based compensation expense, net ($26M), and restructuring costs ($6M, comprising $2M staff costs and $4M other restructuring costs), and includes other income, net ($7M), resulting in Adjusted Operating Profit of $759M. Total net adjustments of $68M represent 9.8% of GAAP Operating Income. Q1 FY2026 GAAP Operating Income of $596M excludes amortization of acquired intangibles ($28M), stock-based compensation expense, net ($23M), and restructuring costs ($13M, comprising $2M staff costs and $11M other restructuring costs), and includes other income, net ($7M), resulting in Adjusted Operating Profit of $667M (total net adjustments of $71M represent 11.9% of GAAP Operating Income). Restructuring costs relate to the corporate redomiciliation and U.S. listing, as well as the operational restructuring of the UK segment.
- Adjusted Pre-tax Profit reconciliation: Q1 FY2027 GAAP Income before provision for income taxes of $591M excludes amortization of acquired intangibles ($29M), stock-based compensation expense, net ($26M), and restructuring costs ($6M), resulting in Adjusted Pre-tax Profit of $652M. Q1 FY2026 GAAP Income before provision for income taxes of $508M excludes amortization of acquired intangibles ($28M), stock-based compensation expense, net ($23M), and restructuring costs ($13M), resulting in Adjusted Pre-tax Profit of $572M.
- Adjusted EPS reconciliation: Q1 FY2027 GAAP Diluted EPS of $1.07 excludes amortization of acquired intangibles ($0.07/share), stock-based compensation expense, net ($0.07/share), restructuring costs ($0.01/share), and tax on adjusting items (-$0.04/share), resulting in Adjusted EPS of $1.18. Total net adjustments of $0.11/share represent 10.3% of GAAP EPS. Q1 FY2026 GAAP Diluted EPS of $0.87 excludes amortization of acquired intangibles ($0.06/share), stock-based compensation expense, net ($0.05/share), restructuring costs ($0.03/share), and tax on adjusting items (-$0.03/share), resulting in Adjusted EPS of $0.98. Total net adjustments of $0.11/share represent 12.6% of GAAP EPS.
- EBITDA and Adjusted EBITDA reconciliation: Q1 FY2027 EBITDA of $1,283M is calculated as Net income ($438M) + Provision for income taxes ($153M) + Interest expense, net ($107M) + Depreciation of rental equipment ($470M) + Non-rental depreciation and amortization ($115M). Adjusted EBITDA of $1,315M adds back stock-based compensation expense, net ($26M) and restructuring costs ($6M). Total adjustments of $32M represent 2.5% of EBITDA. Q1 FY2026 EBITDA of $1,174M is calculated as Net income ($373M) + Provision for income taxes ($135M) + Interest expense, net ($95M) + Depreciation of rental equipment ($458M) + Non-rental depreciation and amortization ($113M). Adjusted EBITDA of $1,210M adds back stock-based compensation expense, net ($23M) and restructuring costs ($13M). Total adjustments of $36M represent 3.1% of EBITDA.
B. Balance Sheet Highlights
| Metric | July 31, 2026 | April 30, 2026 | Change (%) | Notes |
|---|---|---|---|---|
| Cash and Cash Equivalents | $32M | $29M | +10.3% | Unrestricted cash. Excess availability under the senior secured credit facility was $3,750M. |
Total Debt (including Leases)[1] |
$11,423M | $10,447M | +9.3% | Reflects issuance of $1.2B senior notes during the quarter and debt assumed in acquisitions. |
| - Senior Notes and Credit Facility (GAAP) | $8,556M | $7,583M | +12.8% | Comprises $550M short-term debt and $8,006M long-term debt. |
| - Operating Lease Liabilities | $2,867M | $2,864M | +0.1% | Comprises $295M current portion and $2,572M non-current portion. Represents 12.1% of total assets. |
Net Debt (including Leases)[2] |
$11,391M | $10,418M | +9.3% | Total Debt (including Leases) less Cash and cash equivalents. |
Company-Reported Net Debt (excluding Leases)[3] |
$8,524M | $7,554M | +12.8% | Senior notes and credit facility ($8,556M) less cash ($32M). Increased 15.3% vs. $7,390M as of July 31, 2025. |
| Accounts Receivable, Net | $1,929M | $1,669M | +15.6% | Net of allowance for credit losses of $119M ($105M at April 30, 2026). Represents 8.2% of total assets. |
| Inventory | $192M | $180M | +6.7% | Inventory held for sales of new equipment, merchandise, and consumables. |
| Accounts Payable | $623M | $472M | +32.0% | Reflects seasonal procurement ramp and equipment landings. |
Working Capital[4] |
($150M) | ($244M) | -38.5% | Current assets of $2,573M less current liabilities of $2,723M (includes $550M short-term debt maturities). |
| Material Balance Sheet Assets (≥10% of Assets) | — | — | — | — |
| - Rental Equipment, Net | $11,856M | $11,224M | +5.6% | Core revenue-earning fleet. Represents 50.2% of total assets ($23,613M). |
| - Goodwill | $3,778M | $3,476M | +8.7% | Increased by $302M primarily from the acquisition of Aries. Represents 16.0% of total assets. |
| - Operating Lease Right-of-Use Assets | $2,663M | $2,664M | 0.0% | Property and branch leases. Represents 11.3% of total assets. |
| Material Balance Sheet Liabilities (≥10% of Assets) | — | — | — | — |
| - Long-Term Debt | $8,006M | $7,033M | +13.8% | Senior notes and drawn term facilities. Represents 33.9% of total assets. |
| - Deferred Taxes | $2,463M | $2,394M | +2.9% | Net long-term deferred tax liability. Represents 10.4% of total assets. |
| - Non-Current Operating Lease Liabilities | $2,572M | $2,577M | -0.2% | Long-term store and facility lease commitments. Represents 10.9% of total assets. |
| Stockholders' Equity | $7,447M | $7,409M | +0.5% | Retained earnings of $7,772M offset by treasury stock at cost of ($334M). Represents 31.5% of total assets. |
Footnotes
- Total Debt (including Leases) is calculated as Short-term debt and current maturities of long-term debt ($550M) + Long-term debt ($8,006M) + Current operating lease liabilities ($295M) + Non-current operating lease liabilities ($2,572M) = $11,423M. For April 30, 2026: $550M + $7,033M + $287M + $2,577M = $10,447M.
- Net Debt (including Leases) is calculated as Total Debt (including Leases) ($11,423M) less Cash and cash equivalents ($32M) = $11,391M. For April 30, 2026: $10,447M - $29M = $10,418M.
- Company-Reported Net Debt (Non-GAAP) is defined by management as total debt under facilities and notes less cash and cash equivalents. July 31, 2026: Total debt of $8,556M less cash of $32M = $8,524M. April 30, 2026: $7,583M less cash of $29M = $7,554M. July 31, 2025: $7,413M less cash of $23M = $7,390M.
- Working Capital is calculated as Total current assets ($2,573M) less Total current liabilities ($2,723M) = ($150M). For April 30, 2026: $2,232M - $2,476M = ($244M). Current liabilities include $550M in short-term debt maturities in both periods.
C. Cash Flow Analysis
| Metric | Q1 FY2027 (Three Months Ended July 31, 2026) | Q1 FY2026 (Three Months Ended July 31, 2025) | Change (%) | Notes |
|---|---|---|---|---|
| Operating Cash Flow (GAAP) | $840M | $868M | -3.2% | Cash from operations reflected earnings growth offset by working capital usage and timing of equipment landing payments. |
- Stock-Based Compensation Expense[1] |
$26M | $23M | +13.0% | Included in operating cash flow non-cash add-backs; represents 3.1% of operating cash flow. |
Gross Capital Expenditures[2] |
($855M) | ($505M) | +69.3% | Substantial step-up to support mega projects, Specialty expansion, and Aries growth. |
| - Payments for Purchases of Rental Equipment | ($759M) | ($394M) | +92.6% | Gross rental CapEx nearly doubled to fund committed customer demand. |
| - Payments for Purchases of Non-Rental Property & Equipment | ($96M) | ($111M) | -13.5% | Facilities, delivery vehicles, and IT investments. |
Free Cash Flow (GAAP)[3] |
($15M) | $363M | N/A | Calculated as Operating Cash Flow ($840M) minus Gross Capital Expenditures ($855M). Outflow due to timing of CapEx landings. |
Free Cash Flow after Lease Payments[4] |
($19M) | $359M | N/A | Deducts finance lease principal repayments ($4M) from GAAP FCF. Operating lease payments are deducted within Operating Cash Flow. |
Free Cash Flow (Management Definition)[5] |
$70M | $468M | -85.0% | Non-GAAP company definition incorporates $85M in equipment disposal proceeds ($77M rental, $8M non-rental). |
| Dividend Payments | ($307M) | $0M | N/A | Final FY2026 dividend of $0.75/share paid under previous UK framework. (Q1 FY2026 dividend was paid in Q2). |
Net Share Repurchases / Issuances[6] |
($56M) | ($348M) | -83.9% | Common stock repurchased of $56M ($330M direct + $18M ESOT in Q1 FY2026). |
Net Share Repurchases after SBC[7] |
($82M) | ($371M) | -77.9% | Notional calculation combining net share repurchases (-$56M) and non-cash stock-based compensation (-$26M). |
Net Debt Proceeds / (Repayments)[8] |
$984M | ($92M) | N/A | Reflects proceeds from $1.2B senior notes offering ($2,191M total proceeds less $1,207M debt payments). |
Finance Lease Principal Repayments[9] |
($4M) | ($4M) | 0.0% | Reported under Cash flows from financing activities. |
Payments for Business Acquisitions (Net)[10] |
($667M) | ($20M) | +3,235.0% | Outflow primarily driven by the acquisition of Reliant Asset Management (Aries), closed May 1, 2026. |
Footnotes
- Stock-based compensation expense was $26M in Q1 FY2027 (3.1% of operating cash flow) and $23M in Q1 FY2026 (2.6% of operating cash flow).
- Gross Capital Expenditures is calculated from Cash flows from investing activities as Payments for purchases of rental equipment ($759M) + Payments for purchases of non-rental property and equipment ($96M) = $855M. For Q1 FY2026: $394M + $111M = $505M.
- Free Cash Flow (GAAP) is calculated as Net cash provided by operating activities ($840M) minus Gross Capital Expenditures ($855M) = -$15M. For Q1 FY2026: $868M - $505M = $363M.
- Free Cash Flow after Lease Payments is calculated as Free Cash Flow (GAAP) (-$15M) less Repayments of principal under finance lease liabilities ($4M, reported in financing cash flows) = -$19M. For Q1 FY2026: $363M - $4M = $359M. Operating lease payments are already captured within Operating Cash Flow via changes in operating lease liabilities (-$74M in Q1 FY2027; -$70M in Q1 FY2026) and non-cash operating lease cost add-backs ($80M in Q1 FY2027; $74M in Q1 FY2026).
- Free Cash Flow (Management Definition) is a Non-GAAP measure defined by the company as net cash provided by operating activities less net expenditure on rental and non-rental equipment. Q1 FY2027 reconciliation: Operating cash flow ($840M) - Purchases of rental equipment ($759M) - Purchases of non-rental equipment ($96M) + Proceeds from sales of rental equipment ($77M) + Proceeds from sales of non-rental equipment ($8M) = $70M. Q1 FY2026 reconciliation: $868M - $394M - $111M + $92M + $13M = $468M.
- Net Share Repurchases / Issuances represents cash paid for share buybacks in financing activities. Q1 FY2027: Common stock repurchased of ($56M) (an additional $16M was paid for tax withholding for stock-based compensation). Q1 FY2026: Common stock repurchased of ($330M) plus Common stock repurchased by the ESOT of ($18M) = ($348M).
- Net Share Repurchases after SBC is a notional net figure calculated as Net Share Repurchases (-$56M) minus Stock-Based Compensation ($26M) = -$82M. For Q1 FY2026: (-$348M) - $23M = -$371M. This combines cash repurchase outlays with non-cash equity compensation expense.
- Net Debt Proceeds / (Repayments) is calculated from financing cash flows. Q1 FY2027: Proceeds from debt ($2,191M) less Payments of debt ($1,207M) = +$984M. Q1 FY2026: Proceeds from debt ($290M) less Payments of debt ($382M) = -$92M.
- Finance lease principal payments are reported under Cash flows from financing activities as "Repayments of principal under finance lease liabilities" ($4M in Q1 FY2027 and $4M in Q1 FY2026).
- Payments for acquisition of businesses, net of cash acquired was $667M in Q1 FY2027 ($20M in Q1 FY2026). The filing notes that total capital invested in the two acquisitions during the quarter, including acquired borrowings, was $669M.
D. Key Financial Ratios
| Metric | July 31, 2026 (Q1 FY2027) | July 31, 2025 (Q1 FY2026) | Change | Notes |
|---|---|---|---|---|
Return on Investment (ROI, TTM)[1] |
14.6% | 14.6% | 0 bps | Trailing twelve-month Adjusted Operating Profit ($2,592M) divided by Adjusted Average Net Assets ($17,755M). Reported as 15% in filing summary table; was 14.0% at April 30, 2026. |
Net Leverage (Net Debt to TTM Adjusted EBITDA)[2] |
1.8x | 1.6x | +0.2x | Company-reported Net Debt ($8,524M) divided by TTM Adjusted EBITDA ($4,782M). Remains within stated target range of 1.0x to 2.0x. |
Debt to Net Income Ratio (TTM)[3] |
6.2x | 4.9x | +1.3x | Non-GAAP total debt ($8,556M) divided by preceding twelve-month Net Income ($1,391M vs. $1,528M). |
Footnotes
- Return on Investment is a Non-GAAP metric calculated by management as adjusted operating profit generated during the preceding twelve-month period ($2,592M for TTM July 31, 2026; $2,601M for TTM July 31, 2025) divided by adjusted average net assets ($17,755M for TTM July 31, 2026; $17,771M for TTM July 31, 2025). Formula: $2,592M / $17,755M = 14.60% (rounds to 15% in the filing table).
- Net Leverage is calculated as company-reported Net Debt ($8,524M) divided by Adjusted EBITDA generated during the preceding twelve-month period ($4,782M) = 1.78x (1.8x). For July 31, 2025: Net Debt ($7,390M) divided by TTM Adjusted EBITDA ($4,758M) = 1.55x (1.6x).
- Debt to Net Income Ratio is reported in the filing as total debt under facilities and notes ($8,556M for July 31, 2026; $7,413M for July 31, 2025) divided by Net income generated during the preceding twelve-month period ($1,391M for TTM July 31, 2026; $1,528M for TTM July 31, 2025). Formula: $8,556M / $1,391M = 6.15x (6.2x) vs. $7,413M / $1,528M = 4.85x (4.9x).
E. Operational Metrics
| Metric | Q1 FY2027 (July 31, 2026) | Q1 FY2026 (July 31, 2025) | Change | Notes |
|---|---|---|---|---|
| Rental Fleet Original Equipment Cost (OEC) | $20,102M | $18,964M[1] |
+6.0% | Average original cost of rental equipment increased 6.0% YoY. |
| Average Fleet Age (OEC basis) | 52 months | 50 months | +2 months | Fleet age compares to 53 months at FY2026 year-end (April 30, 2026). |
Dollar Utilization (TTM)[2] |
— | — | — | — |
| - North America – General Tool | 47% | 47% | 0 bps | Consistent with prior-year period and FY2026 year-end (47%). |
| - North America – Specialty | 77% | 74% | +300 bps | Improvement reflects higher productivity and cross-selling; was 75% at FY2026 year-end. |
| - United Kingdom | 54% | 53% | +100 bps | Reflects network optimization actions; was 53% at FY2026 year-end. |
| Rental Store Count | 1,638 | 1,569 | +69 stores (+4.4%) | Net addition of 27 stores in Q1 (from 1,611 at April 30, 2026), including 13 greenfields and 17 Specialty locations via M&A (Aries). |
| - North America – General Tool | 816 | 787 | +29 stores (+3.7%) | Up 2 stores from 814 at April 30, 2026. |
| - North America – Specialty | 638 | 590 | +48 stores (+8.1%) | Up 24 stores from 614 at April 30, 2026, driven by greenfield additions and Aries. |
| - United Kingdom | 184 | 192 | -8 stores (-4.2%) | Up 1 store from 183 at April 30, 2026; net decline reflects ongoing footprint rationalization. |
| Employee Count | 26,613 | 25,382 | +1,231 (+4.9%) | Increased to support mega projects, new branches, and acquired operations. |
| - North America | 22,408 | 21,028 | +1,380 (+6.6%) | Expansion in strategic project coverage, technician workforce, and modular personnel. |
| - United Kingdom | 4,205 | 4,354 | -149 (-3.4%) | Rationalization under ongoing restructuring initiatives. |
| Safety Performance | — | — | — | — |
| - Total Recordable Incident Rate (TRIR) | 0.46 | — | — | Highlighted on earnings call under the "Engage for Life" safety program. |
| - Lost Time Rate | 0.14 | — | — | Highlighted on earnings call. |
Footnotes
- Prior year OEC of $18,964M is calculated based on management's stated metric that original equipment cost at July 31, 2026 ($20,102M) increased 6.0% on average compared to the prior-year period ($20,102M / 1.06 = $18,964M).
- Dollar utilization is a Non-GAAP KPI defined as rental revenue earned from equipment in each month during the preceding twelve-month period divided by the average original equipment cost of the fleet during that period, measured on a segment basis.
2. Forward-Looking Guidance
A. Guidance Summary
The company raised its full-year fiscal 2027 financial guidance across top-line revenue, adjusted EBITDA, and capital expenditures following first-quarter performance that exceeded internal run-rates. Management maintained its qualitative expectations for full-year adjusted EBITDA margins to remain broadly consistent with fiscal 2026, with margin expansion weighted toward the second half of the fiscal year.
| Metric | Period | Current Guidance | Prior Guidance[1] |
Change | Management Commentary |
|---|---|---|---|---|---|
| Q2 FY2027 Financial Outlook | Q2 FY2027 | Qualitative: Sequential margin progress expected; turning corner toward H2 | N/A | Introduced (Qualitative) | Management did not provide specific quarterly quantitative guidance for Q2, but noted that margins are expected to progress sequentially following historical seasonal patterns, supported by rate momentum, operational efficiencies, and tight fleet utilization. |
| Total Revenue Growth | FY2027 | 6% to 9% growth | 4.5% to 7.5% growth | Raised (+150 bps) | Upward revision reflects Q1 outperformance (+11.2%), broad customer demand across strategic accounts, ongoing mega-project momentum, and energy solutions growth, alongside stable local non-residential construction markets. |
| Rental Revenue Growth | FY2027 | 7% to 10% growth | 5% to 8% growth | Raised (+200 bps) | Driven by broad-based volume and rate momentum across General Tool and Specialty. The Aries acquisition contributes ~100 bps to full-year rental revenue growth; Q1 World Cup activity contributed ~250 bps in Q1. Outlook does not embed aggressive rate acceleration. |
| Adjusted EBITDA | FY2027 | $4.92B to $5.12B | $4.85B to $5.05B | Raised (+$70M / +1.4%) | Represents solid year-over-year dollar growth ($4,677M in FY2026). Full-year adjusted EBITDA margin is expected to be broadly consistent with FY2026 (41.9%), with operational excellence gains offsetting mix headwinds. |
| Adjusted EBITDA Margin | FY2027 | Broadly consistent with FY2026 (41.9%) | Broadly consistent with FY2026 (41.9%) | Maintained | Reflects higher relative growth of lower-margin ancillary revenues and Specialty mix, alongside the year-one dilutive impact of Aries, balanced by second-half operational efficiency benefits and fuel surcharge recoveries. |
| Gross Rental Capital Expenditures | FY2027 | $2.75B to $3.15B | $2.45B to $2.85B | Raised (+$300M / +11.3%) | Increased investment to support committed customer project wins across mega projects, Specialty verticals, and energy solutions. Characterized as opportunity-driven fleet investment rather than speculative CapEx. |
| Net Rental Equipment Capital Expenditures | FY2027 | $2.40B to $2.80B | $2.05B to $2.45B | Raised (+$350M / +15.6%) | Reflects gross fleet additions net of used equipment disposal proceeds ($350M midpoint increase). Supported by strong fleet productivity and disciplined OEM production levels. |
| Free Cash Flow | FY2027 | Strong through-the-cycle cash generation | Strong through-the-cycle cash generation | Maintained (Qualitative) | Cash generation expected to strengthen sequentially through the balance of the year following the Q1 working capital ramp and the timing of payments for equipment landed in Q4 FY2026. |
| Greenfield Store Openings | FY2027 | ~55 locations | ~55 locations (15 General Tool, 40 Specialty) | Maintained | The company opened 13 greenfield locations in Q1 FY2027 and remains on track for the full year, with openings heavily weighted toward Specialty and modular network density. |
| Quarterly Cash Dividend | Q1 FY2027 | $0.30 per share | N/A | Introduced | Declared inaugural quarterly dividend under the new U.S. listing construct, payable October 2, 2026 (record date September 18, 2026), transitioning away from the prior UK semi-annual dividend framework. |
| Capital Markets Day Margin Target | Multi-Year (Sunbelt 4.0) | +200 bps adjusted EBITDA margin expansion | +200 bps adjusted EBITDA margin expansion | Maintained | Management reaffirmed line of sight and commitment to delivering 200 bps of adjusted EBITDA margin expansion over the course of the Sunbelt 4.0 strategic plan via operational initiatives and dynamic pricing. |
| Net Leverage Target | Long-Term | 1.0x to 2.0x Net Debt to Adjusted EBITDA | 1.0x to 2.0x Net Debt to Adjusted EBITDA | Maintained | Leverage stood at 1.8x as of July 31, 2026. Balance sheet policy remains focused on maintaining investment-grade metrics while funding organic growth, bolt-on acquisitions, and shareholder returns. |
| Modular Solutions (Aries) Scaling | Multi-Year | Significant scaling across top 50 markets | Line of sight to double business in a few years | Maintained | Aries currently operates in 14 of Sunbelt's top 50 markets. Management expects to scale the business significantly via greenfield additions, fleet investment, and platform cross-selling. |
Footnotes
- Prior guidance reflects the initial full-year fiscal 2027 outlook introduced during the Q4 FY2026 earnings conference call on June 23, 2026, and confirmed in the FY2026 annual filings.
B. Additional Notes & Commentary
-
End-Market Assumptions & Demand Drivers:
- Local Non-Residential Construction: Guidance continues to assume that local commercial construction remains in an "equilibrium" or "stable" state (starts matching completions), with no cyclical recovery or inflection point embedded into the updated financial targets. Management noted that its internal synthetic tracking has shown 16 consecutive months (since May 2025) of flat-to-positive comparisons. Positive leading indicators—such as the Dodge Momentum Index reaching new highs (with 59 commercial projects >$100M entering planning in July 2026)—support medium-term activity (typically translating to starts within 12 to 18 months), but near-term guidance remains predicated on status quo demand.
- Mega Projects: Demand is supported by high visibility across a diversified pipeline. Management stated that semiconductor projects account for only 3% of its mega-project portfolio, and data centers represent 13% (combined 16%). A full 80% of projects in the active pipeline are either upcoming, ramping, or active, representing multi-year horizons extending through 2030.
- Fleet Availability and OEM Constraints: Industry fleet additions remain constrained by manufacturer capacity discipline, particularly in high-demand categories such as telehandlers, ultra-booms, and large-scale power generation (≥300 kW). Management noted that Sunbelt's preferential allocation with OEMs protects its CapEx program while limiting speculative fleet growth across the broader industry.
-
Margin Cadence and Phasing Throughout Fiscal 2027:
- First-Half Headwinds: Adjusted EBITDA margins are expected to face ongoing mix pressure in the first half of the year due to three factors: 1) outsized growth in lower-margin ancillary revenues (ancillary grew >2x rental revenue in Q1, and >40% in Specialty); 2) early-stage load-in costs on newly awarded mega projects, where initial time utilization runs at 30% to 40% before cresting at 70% to 80% after 3 to 4 months; and 3) the first-year dilutive impact of Aries, which carries lower initial margins due to historical merchandise sales.
- Second-Half Margin Inflection: Margin expansion is projected to materialize in the second half of fiscal 2027. Drivers include the realization of fuel and delivery surcharges (which typically lag cost spikes by one quarter), operational efficiency gains from Market Logistics Operations (MLOs) and Market Service Operations (MSOs), and narrowing cost drag from fleet repositioning as local market utilization stabilizes.
- Rate Upside: Management explicitly stated that the updated revenue and EBITDA guidance does not assume accelerated rental rate gains, despite positive sequential rate momentum continuing through August 2026. Any further acceleration in pricing execution or wider deployment of dynamic customer pricing represents unbudgeted upside.
-
Depreciation Growth Phasing:
- Rental equipment depreciation grew by only 2.5% year-over-year in Q1 FY2027, substantially lagging rental revenue growth of 12.5%.
- Management indicated that depreciation growth will step up sequentially through the remaining quarters of fiscal 2027 as new equipment landings from the increased CapEx budget ($2.75B–$3.15B gross) are placed into service across General Tool and Specialty branches.
-
Aries Integration and Commercial Synergy Funnel:
- Systems integration for the Reliant Asset Management (Aries) acquisition was completed on August 1, 2026.
- In Q1 FY2027, the cross-selling funnel between Sunbelt and Aries generated 669 tracked sales leads representing $24M in potential contract value, of which $2.5M has landed and $14M is currently in active RFPs.
- Aries contributed approximately 100 bps to consolidated rental revenue growth and 300 bps to North America Specialty rental revenue growth in Q1.
-
Cash Flow and Capital Allocation Priorities:
- Management confirmed that through-the-cycle free cash flow generation will increase as the year progresses. Q1 free cash flow of $70M reflected the timing of capital payments for equipment landed in Q4 FY2026 and seasonal working capital requirements.
- Capital allocation priorities were reaffirmed in rank order:
- Organic Growth: Funding growth CapEx ($2.4B to $2.8B net rental CapEx) and ~55 greenfield locations.
- Bolt-On M&A: Targeting complementary Specialty providers, temporary site services, and regional modular tuck-ins.
- Progressive Dividends: Transitioning to quarterly U.S. distributions, commencing with the $0.30 per share dividend payable October 2, 2026.
- Share Repurchases: Discretionary repurchases conducted within the targeted 1.0x to 2.0x net leverage framework ($56M repurchased in Q1 FY2027).
3. Operational & Strategic Developments
A. Business Performance & Operations
-
Volume and Pricing Trends:
- Rental Volume Growth: Rental revenue grew 12.5% to $2,927 million in Q1 FY2027, driven by accelerated activity in mega projects, outsized demand in Specialty verticals, and live events. The 2026 FIFA World Cup contributed approximately 250 basis points to consolidated rental revenue growth (weighted 75% to 80% toward Specialty), while the acquisition of Reliant Asset Management (Aries) contributed approximately 100 basis points.
- Rental Rate Momentum: Management reported that rental rate momentum strengthened sequentially across May, June, and July, with positive momentum continuing through August 2026. This represents a qualitative shift from the "stable and resilient" rate commentary during FY2026 to proactive rate progression. Tight industry supply and demand, disciplined OEM manufacturing, and high time utilization supported pricing power.
- Revenue Mix Dynamics: Ancillary revenues (such as delivery, fuel, and erection and dismantling) grew at more than 2x the rate of pure rental revenue across the company, and surged over 40% in North America Specialty. Because ancillary services carry lower EBITDA margins (typically 10% to 15%) despite requiring little to no capital, this mix shift accounted for approximately three-quarters of the 100 basis point adjusted EBITDA margin contraction year-over-year.
- Used Equipment Pricing: Used equipment sales decreased 17.5% to $85 million, but management highlighted that recovery rates increased, signaling pricing and demand stabilization across secondary equipment markets.
-
Product and Service Updates:
- Launch of Modular Solutions: Following the acquisition of Reliant Asset Management (Aries) on May 1, 2026, the company formally established Sunbelt Rentals Modular Solutions as its 13th Specialty business line, adding mobile offices, modular complexes, and portable storage containers to its site services lineup.
- Energy Management as a Service (EMaaS): Management emphasized expanding customer power complexity as a key growth catalyst. The company's EMaaS offering integrates high-capacity power generation (≥300 kW), load bank testing, distribution switchgear, remote monitoring, and engineered backup systems. Core applications include data center commissioning (durations ranging from 8 to 12 months), utility bridge power, industrial turnaround heating, and behind-the-meter electrification.
- Integrated Site Services ("Power of Sunbelt"): The company accelerated bundled cross-selling, combining General Tool equipment with Specialty site infrastructure, including temporary fencing, ground protection mats, scaffolding, mobile structures, and temporary climate control.
-
Market Position and Segment Dynamics:
- Mega-Project Market Share: Management reiterated that Sunbelt captures at least 2x its standard market share on mega projects due to fleet scale, specialized technical personnel, and technology tracking capabilities. Large strategic accounts generated outsized revenue growth relative to the broader equipment rental sector.
- Fleet Discipline vs. Overfleeting Concerns: Out of a total fleet expansion of approximately $1.4 billion in original equipment cost (OEC) year-over-year, only ~$100 million was allocated to same-store General Tool branches (representing ~1% fleet growth at those locations), ensuring that local commercial rental markets were not oversupplied.
- Segment Contributions:
- North America General Tool: Rental revenue rose 7.4% to $1,648 million, supported by large project wins and steady local demand, while dollar utilization held steady at 47%.
- North America Specialty: Rental revenue grew 25.3% to $1,070 million, with dollar utilization expanding 300 basis points to 77%, led by Power & HVAC and Climate Control.
- United Kingdom: Rental revenue declined 1.4% to $209 million, but operational restructuring improved adjusted operating profit margin by 10 basis points to 8.3% and lifted dollar utilization 100 basis points to 54%.
B. Strategic Initiatives
-
Growth Investments:
- Aries Commercial Integration: Systems integration into Sunbelt's IT architecture was completed on August 1, 2026. In Q1, the commercial team generated 669 cross-selling leads representing $24 million in pipeline value, with >$2.5 million booked and $14 million in active RFPs. Operating in only 14 of Sunbelt's top 50 markets, Aries provides substantial runway for greenfield and tuck-in expansion.
- Network Expansion: Sunbelt opened 13 greenfield locations in Q1 FY2027 (heavily weighted toward Specialty) and added 17 locations through acquisitions, expanding the network to 1,638 locations. The full-year target of approximately 55 greenfield branches was reaffirmed.
- Fleet Investment Acceleration: Reversing the contractionary posture of FY2026 (-18.5% CapEx), management raised full-year gross rental CapEx guidance by $300 million to $2.75B–$3.15B. Spending is opportunity-driven, targeting committed mega projects, Specialty verticals, and modular fleet.
-
Operational Programs & Technology:
- Operational Excellence Programs (MLO and MSO): The company continued expanding Market Logistics Operations and Market Service Operations. Centralized hubs in clustered metropolitan markets reduce third-party hauling costs and optimize maintenance workflows by assigning complex repairs to Level 3 technicians. Management previously noted that each 1% operational efficiency improvement unlocks approximately $100 million in revenue capacity.
- Cost Recovery Mechanisms: Delivery and fuel surcharges began taking effect on the P&L, helping drive a sequential 350 basis point improvement in adjusted EBITDA margin from Q4 FY2026.
- Dynamic Customer Pricing: The dynamic pricing pilot remains active across 15 regional markets and is expanding into delivery and ancillary service pricing.
- Used Equipment Retail Channel: Scaling of the direct-to-end-user retail disposition channel continued, supporting recovery rates and used equipment margins.
C. Risk Factors & Headwinds
1. Financial Health Indicators
-
Leverage and Debt Trajectory:
- Company-reported net debt increased by $970 million (+12.8%) sequentially to $8,524 million ($11,391 million including operating leases), driven by the Aries acquisition and elevated seasonal CapEx.
- Net leverage reached 1.8x, near the upper end of the target 1.0x to 2.0x range.
- The ratio of total facility and note debt to trailing twelve-month net income expanded to 6.2x (up from 4.9x at July 31, 2025), reflecting higher debt balances and lower TTM net income ($1,391 million vs. $1,528 million).
- During the quarter, the company issued $1.2 billion in senior unsecured notes (4.950% due 2030 and 5.650% due 2036). Excess credit facility availability stood at $3,750 million.
-
Free Cash Flow Contraction and Working Capital:
- Company-defined free cash flow fell 85.0% year-over-year to $70 million, while GAAP free cash flow turned negative to -$15 million (compared to positive $363 million in Q1 FY2026).
- Operating cash flow declined 3.2% to $840 million due to working capital expansion (receivables grew by $244 million) and the settlement of trade payables for equipment landed late in Q4 FY2026.
- Working capital stood at -$150 million, including $550 million in short-term debt maturities.
-
Balance Sheet Asset Composition:
- Goodwill increased by $302 million sequentially to $3,778 million, representing 16.0% of total assets, primarily reflecting the preliminary purchase price allocation for Aries.
2. Operational Challenges
-
Mix-Driven EBITDA Margin Dilution:
- Adjusted EBITDA margin contracted 100 basis points year-over-year to 42.2%, following a 210 basis point compression across FY2026.
- Outsized growth in lower-margin ancillary revenues (>2x rental revenue growth consolidated, >40% in Specialty) and wholesale fuel costs accounted for the majority of the compression.
- Guidance for full-year adjusted EBITDA margins to remain broadly flat with FY2026 implies that margin dilution will persist into the first half of FY2027 before operational programs and surcharge recoveries take hold in the second half.
-
Operational Lags and Integration:
- Mega-Project Mobilization: Early-stage site load-ins incur initial labor and transport costs with time utilization running at 30% to 40% in months 1 to 3, before cresting at 70% to 80% over the subsequent 2 to 3 years.
- Aries Transition: Shifting the modular business from equipment sales toward a high-utilization recurring rental model involves near-term margin dilution.
-
External Supply and Market Constraints:
- OEM Production Bottlenecks: Manufacturer capacity constraints remain severe in high-demand categories (telehandlers, ultra-booms, and power generation ≥300 kW), limiting the company's ability to flex equipment deliveries if demand accelerates further.
- Flat Local Commercial Construction: Local non-residential construction remains in equilibrium rather than recovery. While planning indicators are positive, high interest rates continue to delay cyclical acceleration.
- Data Center Moratoriums: Power substation bottlenecks and municipal data center moratoriums have emerged in select markets. While project starts have largely preceded local restrictions, grid delays require increased deployment of temporary bridge power.
3. Reporting and Transparency Issues
- Granularity and Guidance Disclosures:
- Management declined to provide a precise quantitative split between rental rate changes and physical volume/utilization changes.
- Management does not issue quantitative quarterly financial guidance for revenue or EBITDA.
- While sector exposure percentages for mega projects were provided (13% data centers, 3% semiconductors), management did not disclose an updated total dollar valuation for the awarded project funnel, which had been quantified at ~$25 billion in Q4 FY2026.
4. Q&A Session Key Themes
A. Analyst Focus Areas
-
Margin Trajectory and Cadence:
- Analysts scrutinized the divergence between expanding adjusted operating profit margins (+60 bps to 24.4%) and contracting adjusted EBITDA margins (-100 bps to 42.2%), questioning the timeline for full-year margin stabilization.
- Management explained that operating profit benefited from depreciation expense growing only 2.5% against 12.5% rental revenue growth, alongside SG&A leverage. Conversely, EBITDA was diluted by ancillary services growing at more than 2x pure rental revenue and higher wholesale fuel costs.
- Management reiterated that EBITDA margins are expected to inflect in the second half of fiscal 2027 as fuel and freight surcharges (which lag cost spikes by one quarter) flow through, mega-project load-ins reach peak utilization, and MLO/MSO operational efficiencies scale.
-
Rental Rate Momentum and Pricing Levers:
- Inquiries focused on the durability of rental rate gains, the contribution of rate versus volume, and whether pricing strength stemmed from proprietary software or broader industry discipline.
- Management reported that rental rate momentum improved sequentially from May through August 2026. While the dynamic pricing pilot across 15 markets showed promise, gains were attributed primarily to foundational discipline, tight fleet utilization, and customer demand for complete solutions.
- Management emphasized that the updated guidance does not embed accelerated pricing gains, representing potential upside.
-
Fleet CapEx Guidance Increase:
- Analysts questioned the rationale behind increasing gross rental CapEx guidance by $300 million (net CapEx by $350 million) and probed where incremental fleet would be deployed.
- Management emphasized that this is non-speculative "opportunity CapEx" deployed directly into committed customer project wins across mega projects, Specialty verticals, and energy management.
-
Mega Projects, Energy Solutions, and Data Center Exposure:
- Analysts probed pipeline sustainability, the impact of municipal data center moratoriums, and power rental contract durations.
- Management clarified that semiconductor projects represent 3% and data centers 13% of the mega-project portfolio (16% combined), with 80% of projects active, ramping, or upcoming through 2030.
- Management indicated that localized power moratoriums have not halted starts; instead, grid interconnection deficits have expanded demand for bridge power, commissioning, and Energy Management as a Service (EMaaS). Commissioning assignments typically carry rental durations of 8 to 12 months.
-
Aries Commercial Progress:
- Analysts asked for early operational learnings from the Aries acquisition. Management highlighted that IT systems integration was completed on August 1, 2026, and that the commercial pipeline generated 669 cross-selling leads valued at $24 million in Q1.
B. Key Challenges & Concerns
-
Industry Overfleeting and OEM Capacity Constraints:
- Analyst Challenge: Analysts expressed concern that concurrent CapEx guidance increases across major public rental competitors could lead to industry-wide overfleeting, destabilizing rental rates if commercial construction remains subdued. Analysts also questioned whether suppliers could fulfill higher equipment orders.
- Management Response: Management countered that primary OEMs face severe capacity constraints in critical categories (telehandlers, ultra-booms, and power generation ≥300 kW), with little spare capacity available. This restricts speculative fleet acquisition across the wider industry. Furthermore, Sunbelt allocated only ~$100 million of its $1.4 billion year-over-year fleet expansion to same-store General Tool branches (~1% fleet growth), directing capital into contracted mega projects and Specialty lines.
-
Structural vs. Transitory Margin Headwinds:
- Analyst Challenge: Analysts questioned whether the rapid growth of lower-margin Specialty and ancillary revenues creates a structural cap on EBITDA margins, challenging management's Sunbelt 4.0 target of expanding margins by 200 basis points.
- Management Response: Management rejected the premise of structural margin degradation, arguing that while ancillary lines carry lower EBITDA margins, they require minimal capital and generate structurally higher return on investment (ROI). Management pointed to the 60 basis point expansion in operating profit margin, the sequential 350 basis point EBITDA margin rebound from Q4 FY2026, and reiterated its line of sight to the 200 basis point margin expansion target over the multi-year plan.
-
Pricing Granularity and Rate vs. Volume Attribution:
- Analyst Challenge: Analysts sought a specific quantitative decomposition of rental rate increases versus physical volume/utilization growth.
- Management Response: Management declined to provide a granular numerical split, stating that both volume and rates contributed positively and showed sequential momentum from May through August. Management maintained that on complex projects, equipment availability and solution expertise take precedence over modest pricing variances of 2% to 5%.
-
Power Grid Delays and Data Center Infrastructure Constraints:
- Analyst Challenge: Analysts questioned whether electric utility constraints and local moratoriums could disrupt data center buildouts.
- Management Response: Management noted that data centers comprise 13% of its mega-project portfolio and that active projects had commenced prior to local moratoriums. Furthermore, utility substation delays serve as a demand catalyst for Sunbelt's temporary power fleet, driving multi-month rental requirements for bridge power and load bank commissioning.
5. Strategic Themes & Inflection Points
A. Current Period Themes
-
Dominant Narratives:
- Top-Line Outperformance Driven by Scale: Management presented double-digit revenue expansion (total revenue +11.2%, rental revenue +12.5%) as validation of market share gains in mega projects, Specialty verticals, live events, and strategic accounts, outperforming broader industry growth.
- Integrated Solutions via the "Power of Sunbelt": Strategic focus centered on bundling General Tool, Specialty, and Modular Solutions (Aries) into a single platform to increase wallet share and customer retention on complex jobsites.
- Reframing EBITDA Compression as ROI-Accretive: Management emphasized that while outsized growth in Specialty and ancillary services compresses EBITDA margins, it enhances return on invested capital due to lower capital intensity, supported by a 60 basis point expansion in adjusted operating profit margin.
-
Operational Focus:
- Opportunity-Driven Fleet Deployment: CapEx was directed toward committed mega projects and Specialty lines, while fleet additions at mature General Tool branches were restricted to ~1% ($100 million) to preserve local market balance.
- Aries Commercial Integration: Focus shifted to converting the $24 million cross-selling lead pipeline into rental revenue and expanding modular coverage beyond 14 of the top 50 markets.
- Cost Recovery Execution: Management prioritized mechanical recovery of fuel and freight costs and the continued rollout of Market Logistics Operations (MLOs) and Market Service Operations (MSOs).
-
Changes in Tone, Messaging, and KPIs:
- Pricing Stance Shift: Management shifted from describing rental rates defensively as "stable and resilient" in FY2026 to citing sequential rate "momentum" and "swagger" from May through August 2026.
- CapEx Reversal: Management reversed FY2026's fleet contraction posture (-18.5% CapEx), raising full-year gross CapEx guidance by $300 million to meet demand.
- Technical Definition of Local Market Equilibrium: Management detailed its internal synthetic analysis tracking Dodge starts versus completions, noting 16 consecutive months (May 2025 to date) of flat-to-positive comparisons following a 28-month contraction.
- Listing and Dividend Transition: The company transitioned to U.S. GAAP reporting and instituted a U.S. quarterly dividend framework ($0.30 per share payable October 2026).
B. Future Considerations
-
Emerging Opportunities:
- Energy Management as a Service (EMaaS): Temporary power solutions represent a major expansion avenue, driven by power grid bottlenecks, data center commissioning (durations of 8 to 12 months), and industrial turnaround electrification.
- Modular Solutions Expansion: Significant whitespace remains to scale Aries across Sunbelt's top 50 metropolitan markets via greenfields, fleet additions, and tuck-in acquisitions.
- Used Equipment Retail Channel: Expanding direct-to-end-user retail sales is expected to optimize recovery rates and disposition margins.
-
External Environment:
- OEM Production Constraints: Manufacturer discipline limits industry supply in telehandlers, ultra-booms, and large generators (≥300 kW), acting as a barrier against industry-wide overfleeting.
- Power Grid Deficits: Utility interconnection delays for data centers and industrial facilities are lengthening rental durations for temporary power and load bank testing.
- Planning Lags to Physical Starts: While the Dodge Momentum Index showed strength (59 projects >$100M entered planning in July 2026), the 12- to 18-month historical lag indicates cyclical recovery in local commercial construction remains deferred to late fiscal 2027 or fiscal 2028.
-
Transformation Initiatives:
- Engineered Business Services Model: The business continues transitioning from basic equipment rental toward engineered site services, including power management, modular facilities, and complex site support under Sunbelt 4.0.
- Clustered Fleet Optimization: Implementation of centralized logistics (MLOs) and regionalized maintenance hubs (MSOs) remains central to achieving management's multi-year target of 200 basis points of adjusted EBITDA margin expansion.
6. Key Items to Monitor Next Quarter
A. Prior Quarter Monitoring Review
| Prior Item | Current Status | Management Commentary |
|---|---|---|
| Local Non-Residential Market Conditions | On Track | Management reported another quarter of stability ("equilibrium") in local commercial construction. Internal synthetic tracking showed 16 consecutive months (since May 2025) of flat-to-positive completions versus starts, ending the prior 28-month contractionary period. While the Dodge Momentum Index reached fresh highs (59 projects >$100M entered planning in July 2026), management kept full-year FY2027 guidance predicated on status quo demand without embedding an inflection point. |
| Mega-Project Pipeline Execution | On Track | Mega-project activity remained strong and diverse across the funnel. Management reported that 80% of projects in the active pipeline are active, ramping, or upcoming through 2030, with semiconductor fabrication accounting for only 3% and data centers representing 13% (16% combined). Upfront mobilization and load-in costs (where site time utilization runs at 30% to 40% in initial months before cresting at 70% to 80%) progressed as planned. |
| Aries (Modular Solutions) Integration | Ahead of Schedule | IT systems and operational integration were completed on August 1, 2026, within three months of closing. Commercial cross-selling generated 669 tracked sales leads valued at $24M ($2.5M booked and $14M in active RFPs). Aries contributed ~100 bps to consolidated rental revenue growth and ~300 bps to North America Specialty rental revenue growth in Q1 FY2027. |
| Dynamic Customer Pricing Traction | Mixed Progress | Dynamic customer pricing pilots remained active across 15 regional markets and are expanding to ancillary fees like transportation. However, management clarified that Q1 sequential rental rate gains were driven primarily by baseline operational discipline, tight fleet utilization, and platform breadth rather than the software pilot itself. Further rate acceleration is not embedded in the updated guidance and represents potential upside. |
| Ancillary vs. Pure Rental Revenue Growth | Mixed Progress | Ancillary revenues continued to significantly outpace pure rental revenue, growing at >2x rental revenue consolidated and >40% in Specialty, accounting for ~75% of the 100 bps adjusted EBITDA margin contraction year-over-year. However, sequential adjusted EBITDA margin rebounded by 350 bps from Q4 FY2026 as mechanical fuel and delivery surcharge recoveries began taking effect on the P&L. |
B. Current Quarter Focus Items
| Category | Item | Timeline | What to Monitor | Why It Matters |
|---|---|---|---|---|
| Operational | Rental Rate Momentum and Dynamic Pricing Execution | Next Quarter | Monitor the continuation of sequential rental rate gains through the autumn peak construction season following positive pricing momentum reported from May through August 2026. Track customer adoption and operational execution as the dynamic customer pricing pilot across 15 markets expands into pricing transportation, delivery, and ancillary services. | Updated full-year FY2027 guidance does not embed further rental rate acceleration, meaning ongoing pricing strength provides direct, unbudgeted upside to revenue and adjusted EBITDA margins. Sustained pricing execution is critical to absorbing annual wage inflation (~3%) and mitigating ancillary mix dilution. |
| Strategic | Modular Solutions (Aries) Cross-Selling and Network Expansion | Next Quarter | Track the conversion rate of the $24M commercial cross-selling pipeline (specifically the $14M currently in active RFPs and 669 tracked leads). Monitor progress on expanding modular capabilities beyond the current 14 of Sunbelt's top 50 metropolitan markets via greenfield openings and fleet investment, alongside the revenue mix transition from equipment sales toward higher-margin recurring rentals. | Reliant Asset Management (Aries) establishes Sunbelt's 13th specialty vertical and represents a core multi-year platform targeted to double in size. Accelerating cross-selling between General Tool, Specialty, and Modular Solutions is essential to reversing initial year-one margin drag and capturing larger site-services wallet share on complex customer projects. |
| Risk | Ancillary Revenue Mix Dilution and Surcharge Recovery Timing | Next Quarter | Monitor the growth rate disparity between lower-margin ancillary revenues and pure rental revenue (which ran at >2x consolidated and >40% in Specialty during Q1). Track the one-quarter realization lag on fuel and freight surcharges, particularly in General Tool where wholesale fuel expenses drove approximately half of segment adjusted EBITDA margin compression. | Ancillary services carry narrower EBITDA margins (10% to 15%), explaining ~75% of the consolidated 100 bps adjusted EBITDA margin contraction in Q1. Timely contractual recovery of delivery and fuel surcharges is essential to driving management's projected second-half margin inflection and achieving full-year flat EBITDA margins. |
| Risk | OEM Production Bottlenecks in Critical Fleet SKUs | Ongoing | Track equipment delivery lead times and manufacturer allocation fulfillment across high-demand categories—specifically telehandlers, ultra-booms, and power generation units ≥300 kW—given management's caution that suppliers possess "not a whole heck of a lot of flex capacity out there." | With gross rental CapEx guidance raised by $300M to $2.75B–$3.15B, top-line execution relies on timely delivery of committed fleet. Severe OEM supply bottlenecks could limit fleet deployment on awarded mega projects, while conversely serving as a structural constraint that protects industry-wide fleet utilization and pricing discipline. |
| Opportunity | Energy Management as a Service (EMaaS) & Power Grid Constraints | Ongoing | Track customer adoption and contract award values for Energy Management as a Service (EMaaS), specifically multi-month assignments for utility bridge power, load bank testing, and data center commissioning (durations of 8 to 12 months) emerging from electrical substation delays and municipal data center moratoriums. | Temporary energy solutions represent the fastest-growing vertical within Specialty, contributing to a 300 bps increase in Specialty dollar utilization (to 77%). Monetizing power grid infrastructure deficits expands Sunbelt's addressable market with structurally higher return on capital (ROI) that is independent of cyclical commercial construction starts. |
Appendix: Quotes by Theme
- Rental Rate Trajectory: Shift from Defensive "Resilience" to Active "Momentum": Management reported that rental rate momentum accelerated sequentially from May through August, framing pricing power as a function of fleet availability and commercial discipline rather than dynamic pricing software pilots alone.
"They've delivered strength in time utilization, strength in wins and strength in rental rate that progressed nicely from a momentum standpoint from May to June to July and moving forward... Think about how resilient pricing was over the last few years and look at now the momentum in pricing and momentum is required, a bit of swagger is required, and that's exactly what the team is delivering." — Brendan Horgan, CEO, Q1-FY27 Q&A
"We obviously don't comment specifically on rate. But what I will say is the momentum with rate has been improving as we've gone through the year, and we're continuing to see that in through August... supply and demand is tight. Utilization rates are up and fleet on rent is up. So all that would point to a very supportive rate environment." — Alex Pease, CFO, Q1-FY27 Q&A
vs Q4-FY26:
"We're now active with our dynamic customer pricing in 15 markets, we're beginning to scale that. It's still early days, which is why we sort of highlighted there's tailwinds as it relates to rates, that's not embedded in the guidance... rates have been stable and we're starting to see some green shoots that are positive trends." — Alex Pease, CFO, Q4-FY26 Q&A
vs Q1-FY26:
"And in the General Tool business, I'll describe that as you have, which is flat, but also very resilient." — Brendan Horgan, CEO, Q1-FY26 Q&A
- Margin Mechanics: Ancillary Revenue Mix Dilution vs. Structurally Accretive Specialty ROI: Management deconstructed the 100 basis point adjusted EBITDA margin contraction, explaining that three-quarters of the decline stemmed from outsized growth in lower-margin ancillary revenues, which nonetheless enhance long-term returns on invested capital.
"The adjusted EBITDA margin performance was consistent with our expectations, reflecting faster growth in ancillary revenues and in Specialty. Although this mix shift affects EBITDA margin, Specialty generates structurally higher returns on investment than General Tool, meaning each point of sales mix towards Specialty will, over time, enhance our return on capital." — Brendan Horgan, CEO, Q1-FY27 Prepared Remarks
"We estimate that roughly 3/4 of the year-over-year margin change reflected higher relative growth in ancillary revenue, partially offset by rate improvement. Importantly, adjusted EBITDA margin improved 350 basis points sequentially from the fourth quarter, reflecting better recovery of higher fuel and delivery costs as well as pricing momentum." — Alex Pease, CFO, Q1-FY27 Prepared Remarks
vs Q4-FY26:
"When you see specialty growth at the extremely exciting levels that it's at relative to general tool, you're always going to see a slight level of margin compression, you're also going to see ROI expansion because that segment comes with higher ROI... in the quarter, ancillaries in specialty grew north of 30% relative to pure rental growing just under 10%... All of those are very attractive high ROI revenues, come at 10%-15% margin as opposed to double-digit strong, sort of 50% or so margins in the pure rental side." — Alex Pease, CFO, Q4-FY26 Q&A
- Fleet CapEx Upward Revision & Discipline Against Local Market Overfleeting: Management raised gross rental CapEx guidance by $300 million to support committed mega-project demand while highlighting strict fleet discipline in same-store General Tool branches to prevent oversupplying local commercial markets.
"This CapEx that was deployed in the quarter and the CapEx that we have guided here today... this is very much opportunity CapEx... So if you look at it in round numbers, our fleet size is about $1.4 billion bigger at the end of July than it was last year. And if you look at where that has grown, only $100 million or so has gone to our General Tool same stores, meaning those branches only have 1% more fleet than they had a year ago and look at the growth that they delivered in the quarter, which gives us great comfort that we're not overfleeting that local non-res business." — Brendan Horgan, CEO, Q1-FY27 Q&A
"All of this capital is pointed towards -- directly towards customer demand. This is not speculative capital. It's going towards mega projects. It's going to large national strategic accounts and identified Specialty opportunities." — Alex Pease, CFO, Q1-FY27 Q&A
vs Q4-FY26:
"Full-year total CapEx declined 18.5% year-over-year to $2.2 billion, reflecting our focus on fleet replacement and supporting targeted pockets of growth, primarily in specialty. We dynamically allocate capital based on market conditions..." — Alex Pease, CFO, Q4-FY26 Prepared Remarks
vs Q1-FY26:
"When markets are experiencing the transitory headwinds we have experienced recently, we manage our capital budget to support strong utilization and rate discipline. When markets are more robust, we accelerate capital spending to capture growth and market share." — Alex Pease, CFO, Q1-FY26 Prepared Remarks
- OEM Production Capacity Constraints as a Structural Supply Governor: Addressing analyst concerns regarding competitor fleet expansion, management stated that primary equipment manufacturers face severe manufacturing constraints in high-demand product categories, curbing speculative industry additions.
"Curious, are you guys seeing a similar dynamic from your Specialty suppliers? And maybe just any color on how you think about balancing the opportunity to flex up production if demand comes in stronger versus maybe allowing the utilization rate and the dollar utilization rates to improve even further in that tightness." — Kenneth Newman, Analyst, KeyBanc, Q1-FY27 Q&A
"When it comes to primary OEMs that supply the industry, there's clear prioritization in terms of who gets the allocations first... It is fair to say for certain high-demand SKUs, so whether that be telehandlers, ultra-booms, power generation in the certainly 300 kW and above environment, there's not a whole heck of a lot of spare capacity out there... There's not a whole heck of a lot of flex capacity out there beyond that. But all of that is going to contribute to even more positive... dollar utilization, ability to inch up time utilization further, and it creates a strong rate environment." — Brendan Horgan, CEO, Q1-FY27 Q&A
vs Q1-FY26:
"We've got a bit of headroom there compared to our almost, if you will, anomalous levels of high time utilization, we had such significant supply constraint in terms of when we will increase the dial as it relates to increasing CapEx, well, that just comes down to what demand is." — Brendan Horgan, CEO, Q1-FY26 Q&A
- Local Non-Residential Construction: Technical Validation of "Equilibrium" and Leading Indicators: Management provided granular details on its proprietary synthetic analysis tracking construction starts versus completions, noting that 16 consecutive months of flat-to-positive comparisons validate baseline stability without relying on a cyclical rebound.
"If we look at sort of a 28-month period from January '23 through April 2025, we saw 28 months... where we saw completions outpacing starts in a rather meaningful way that actually led to a square footage reduction of 22%... What we've seen now from May of 2025 through today is 16 months of flat or positive. So that's how we're describing quite detailed technically how we see stability in that local nonres... And I will refer to the DMI on Slide 7. And you'll see there, once again, we have another high... And just in July alone, we saw 59 projects of over $100 million in value." — Brendan Horgan, CEO, Q1-FY27 Q&A
vs Q4-FY26:
"We're expecting it really to remain benign. Therefore, it's in this sort of stable but flat environment for the year. If there were a surprise, that would be great. It's not reflected in our rental revenue guide... For the time being in our guide, it is status quo." — Brendan Horgan, CEO, Q4-FY26 Q&A
vs Q1-FY26:
"This clearly indicates strong demand and development and we are confident that the strengthening and planning activity across our nonresidential construction end markets will lead to an increase in starts likely within a period of 12 to 24 months." — Brendan Horgan, CEO, Q1-FY26 Prepared Remarks
- Mega-Project Funnel Composition & Multi-Year Revenue Visibility: Management outlined the structural diversification of its mega-project portfolio, addressing customer concentration by clarifying that semiconductor and data center projects represent a modest portion of total activity.
"Our mega project universe is incredibly diverse. It spans entertainment venues and infrastructure projects, transportation projects. Semiconductor, which was your specific question, is only 3%. If you broaden your question to data centers more broadly, that's only 13%. So combined, that's 16% of our mega project universe. So we're certainly not over-indexed to that. The other point I'd make is of the projects in the funnel, a full 80% are either upcoming, ramping or active. So the vast majority have at least a 3-year time horizon ahead of us." — Alex Pease, CFO, Q1-FY27 Q&A
vs Q4-FY26:
"If you look in quarter four, that valuation jumped to around $25 billion. You've more than two x-ed the valuation of projects in the funnel, which points exactly to the effect that Brendan mentioned. That as we load in those projects before we're invoicing revenue, you will see some margin compression. Boy, it sure speaks to a really healthy pipeline." — Alex Pease, CFO, Q4-FY26 Q&A
vs Q1-FY26:
"Of the 832 projects that we're involved in, 64 are data centers. So it's a very broad and diverse pipeline... If I look out into 2026 and 2028, that project count grows from 830 to 1,053 representing a $1.4 trillion in potential project value." — Alex Pease, CFO, Q1-FY26 Q&A
- Energy Management as a Service (EMaaS) & Temporary Power Durations: Management highlighted expanding temporary power solutions as an operational catalyst, explaining how power grid bottlenecks and municipal data center moratoriums extend rental durations for high-capacity generation and commissioning equipment.
"Through our Energy Management as a Service offering, we're helping customers manage these needs across the project life cycle, positioning us exceptionally well to capture ongoing growth." — Brendan Horgan, CEO, Q1-FY27 Prepared Remarks
"We are seeing some of that moratorium realities coming into effect in certain localities... And then certainly, when you talk to our teams and our strategic sellers, what is to follow all of that is energy, energy, energy... Commissioning is going to be 8 to 12 months when we're specifically commissioning depending on what it is, whether it's a data center or it is a different type of project... And then, of course, there's the big piece, which is just behind the meter and general electrification..." — Brendan Horgan, CEO, Q1-FY27 Q&A
- Modular Solutions (Aries) Platform Integration & Commercial Synergy Pipeline: Management confirmed the operational integration of Reliant Asset Management (Aries) within three months of acquisition and quantified substantial early lead volume generated from bundling modular buildings with General Tool and Specialty offerings.
"Importantly, our system integration of Aries into Sunbelt was complete in early August, which will help support future needs. As we integrate modular solutions into our offering, the immediate cross-selling opportunity is evident... Modular solutions is currently in just 14 of our top 50 Sunbelt markets, and we continue to expect to significantly scale the business in the coming years." — Brendan Horgan, CEO, Q1-FY27 Prepared Remarks
"We have a great lead funnel. And to be exact, we have 669 leads that have been tracked by what is today the Sunbelt modular solutions team with an overall value of $24 million. Now to put that in perspective, that's 1 quarter worth of cross-selling, generating that level of opportunity for growth. There's over 2.5 million landed and 14 million of that, which is in actually hard RFPs." — Brendan Horgan, CEO, Q1-FY27 Q&A
vs Q4-FY26:
"We're excited to announce the acquisition of Reliant Asset Management, which creates our 13th specialty business line, Sunbelt Rentals Modular Solutions... Today, Aries is in just 14 of Sunbelt's top 50 markets, which clearly gives us substantial runway to grow density over time... that is a business that we have a clear line of sight to double in just a few years' time by way of expansion..." — Brendan Horgan, CEO, Q4-FY26 Prepared Remarks & Q&A
"Aries in terms of contribution... It's about 1% of that guide... It's also worth mentioning there, year one, that's going to be a drag on margin, even more so than specialty typically would have." — Brendan Horgan, CEO, Q4-FY26 Q&A
- Second-Half Margin Cadence & Capital Markets Day Target Reaffirmation: Management addressed analyst questions regarding margin trajectory, reiterating that full-year EBITDA margins are expected to be flat with FY2026, with margin progress weighted toward the second half as cost-recovery mechanisms and operational excellence programs mature.
"In terms of margin progression, we expect margin progression to advance as we get into the back half of the year. That really is going to be bolstered by some of the cost sort of operating excellence initiatives that we have in place... Last thing I'd say is we... are extremely committed and confident in our ability to deliver the 200 basis points of margin improvement that we talked about during our Capital Markets Day and sort of have line of sight to this level." — Alex Pease, CFO, Q1-FY27 Q&A
"We've increased our rental revenue guide, and we've actually maintained our margin. You heard Alex talk about how ancillary revenue growth is significantly outpacing that of pure rental revenue growth. And that demonstrates really the focus and the discipline and the operational excellence initiatives that the business has underway that are driving incremental margins in those ancillaries." — Brendan Horgan, CEO, Q1-FY27 Q&A
vs Q4-FY26:
"In terms of margin expectations as the year proceeds, we expect to see an improvement in the back half of the year as our operational excellence drivers gain more traction... Looking ahead, our focus remains on converting continued volume growth into margin stabilization and improvement over time." — Alex Pease, CFO, Q4-FY26 Prepared Remarks
- Event-Driven Revenue Drop-Through & Accretive Operating Margin Profile (FIFA World Cup): Management detailed the operational impact of supporting large-scale live events, confirming that the 2026 FIFA World Cup provided a significant top-line boost that was accretive to operating profit margins.
"We estimate that the contribution from our efforts to support the FIFA World Cup added another 250 basis points to rental revenue growth in the quarter." — Alex Pease, CFO, Q1-FY27 Prepared Remarks
"From a GT versus Specialty standpoint, it's 75-25, 80-20 Specialty to GT from a World Cup revenue standpoint. And look, as you would have seen in the print, it was incremental to operating -- adjusted operating income margins. And that's the important thing to us because ultimately, that's going to be also accretive from an ROI standpoint." — Brendan Horgan, CEO, Q1-FY27 Q&A
vs Q4-FY26:
"I think it's really important to mention that we have a lot of one-time activity related to non-construction events, particularly around things like FIFA, the World Cup event. That's around a $70 or so million kind of one-time effect." — Alex Pease, CFO, Q4-FY26 Q&A
"Alex is a bit thinking I shouldn't have said the $70 million number if for no other reason than he was not talking about Q4 to be clear, more anticipated revenue from a series of FIFAs, UFC fights, and other things that we are very active in in Q1." — Brendan Horgan, CEO, Q4-FY26 Q&A
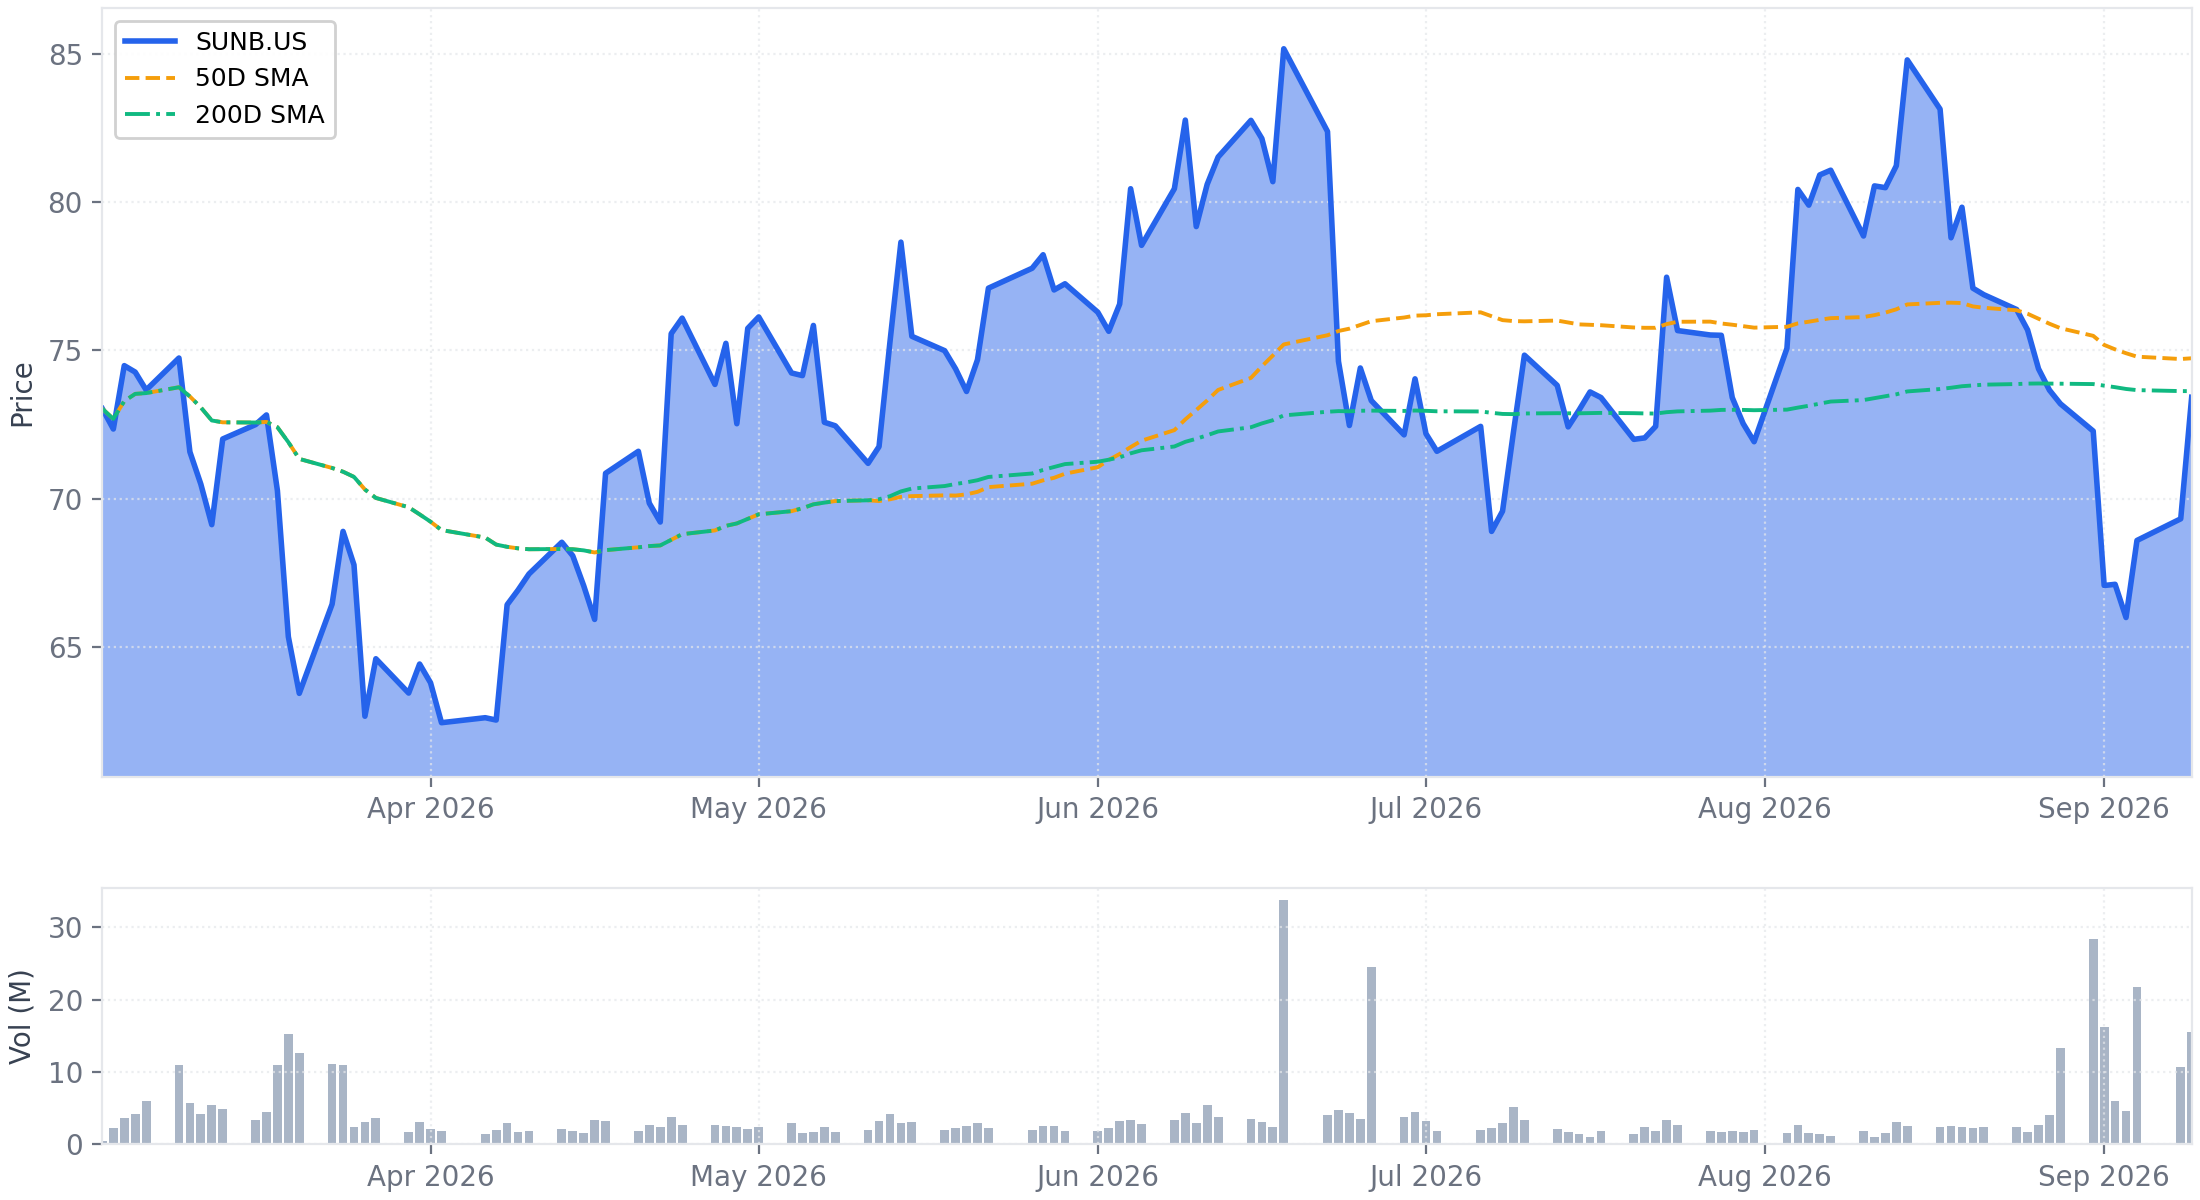
Historical Performance