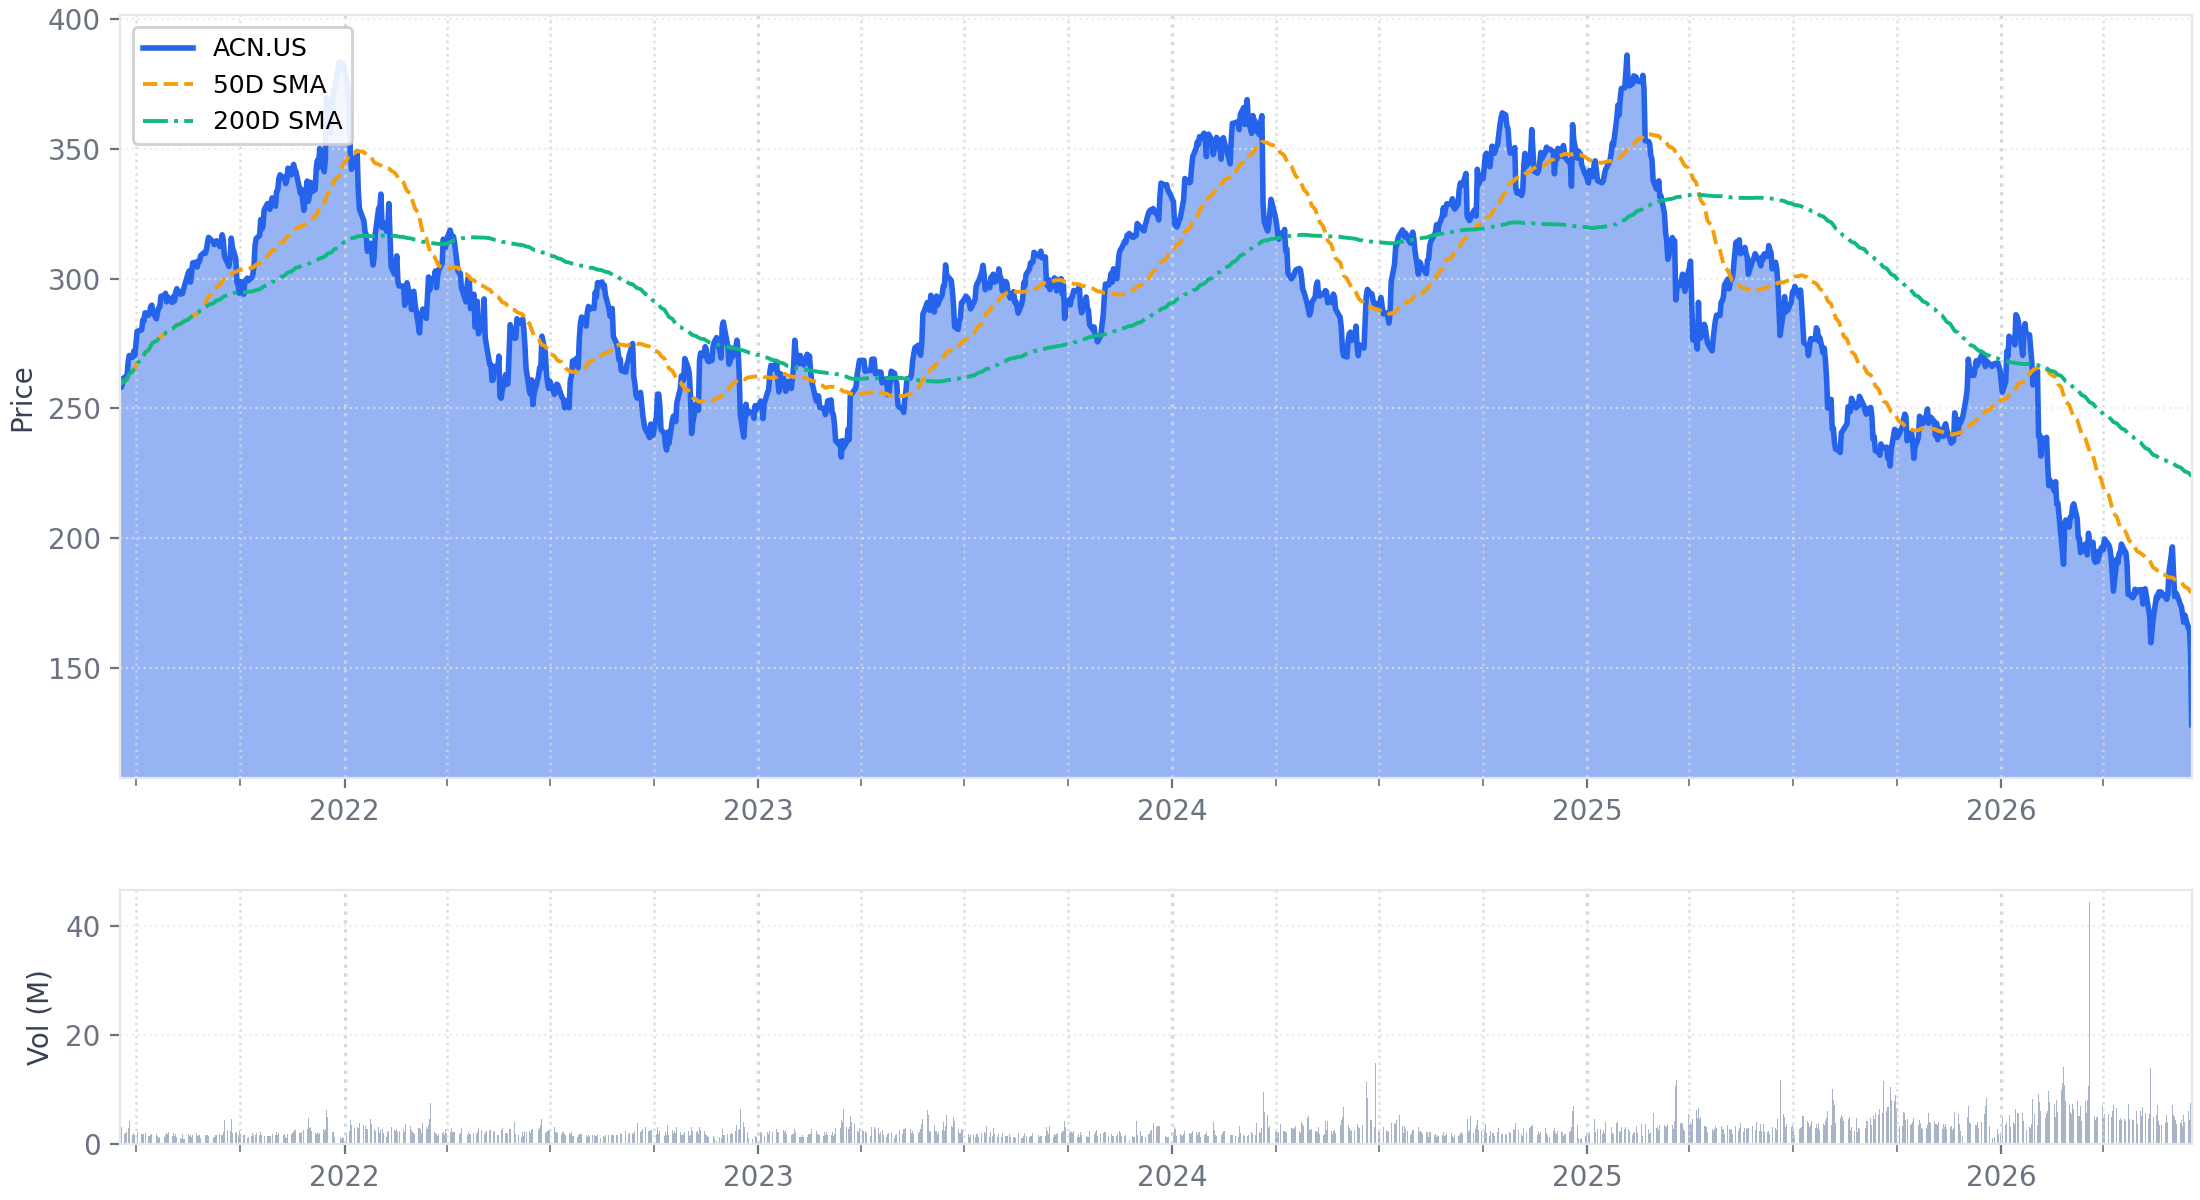
Executive Summary
Accenture reported solid Q3 results with revenue of $18.72 billion, representing 3% growth in local currency that landed above the midpoint of guidance, along with 8.9% EPS growth. This performance, however, was tempered by newly materialized geopolitical headwinds. Management quantified a revenue impact of approximately $100 million and a sales impact of $400 million from the Middle East conflict, which also contributed to the slippage of large managed services deals into FY2027.
Reflecting the increased uncertainty, the company trimmed the top end of its full-year revenue growth outlook to 3% to 4% in local currency, down from a prior range of 3% to 5%. Management signaled that "more of the guided range is in play" for Q4, indicating a wider band of potential outcomes.
Concurrent with this near-term caution, Accenture announced its most significant strategic pivot of the year, nearly doubling its planned FY2026 acquisition spend to approximately $9 billion from $5 billion. This is driven by a major expansion into the Operational Technology (OT) security market through the acquisitions of Dragos, runZero, and NetRise, a move intended to create a new, platform-led growth engine.
The quarter highlights a dual narrative: while aggressively deploying capital to expand its addressable market and evolve its business model for long-term growth, Accenture now faces tangible near-term risks that are impacting current sales cycles and creating a more uncertain outlook.
1. Financial Performance Summary
A. Income Statement Metrics
Accenture reported Q3 FY2026 revenues of $18.72 billion, an increase of 3% in local currency (LC), landing above the midpoint of its guided range. Performance was broad-based, with Managed Services growing 5% LC and Consulting growing 1% LC. GAAP operating margin expanded by 20 basis points to 17.0%, and GAAP diluted EPS grew 8.9% to $3.80, reflecting solid profitability and operating leverage.
| Metric | Q3 FY2026 | Q3 FY2025 | Change | Notes |
|---|---|---|---|---|
| Revenue | $18.72B | $17.73B | ↑3% LC (+5.6% USD) | Met guidance, above the midpoint of 1%-5% LC ($18.35B-$19.0B) provided in Q2. |
| Consulting | $9.33B | $9.01B | ↑1% LC (+3.6% USD) | Revenue growth impacted by an estimated $100M headwind from the Middle East conflict. |
| Managed Services | $9.39B | $8.72B | ↑5% LC (+7.7% USD) | Growth driven by mid-single-digit growth in technology and high single-digit growth in operations. |
| Revenue by Geographic Market | ||||
| Americas | $9.14B | $8.97B | ↑1% LC (+1.9% USD) | Growth was approx. 3% LC excluding a 1.5% impact from the U.S. Federal business. |
| EMEA | $6.87B | $6.23B | ↑4% LC (+10.3% USD) | Growth led by the U.K. and Italy, partially offset by declines in Germany and the Middle East. |
| Asia Pacific | $2.71B | $2.53B | ↑8% LC (+7.0% USD) | Growth led by Japan, Australia, and Singapore. |
| Gross Margin | 32.8% | 32.9% | ↓10 bps | — |
| GAAP Operating Income | $3.18B | $2.98B | ↑6.5% | — |
| GAAP Operating Margin | 17.0% | 16.8% | ↑20 bps | Margin expansion achieved while continuing to invest in the business. |
| GAAP Net Income[1] | $2.34B | $2.20B | ↑6.4% | — |
| GAAP Diluted EPS | $3.80 | $3.49 | ↑8.9% | — |
Footnotes
- Represents Net Income Attributable to Accenture plc.
B. Balance Sheet Highlights
Accenture ended the quarter with a net cash position of $1.78 billion after including lease liabilities. The cash balance decreased from the end of FY2025, primarily reflecting significant capital returns to shareholders and acquisition spending. Days Services Outstanding (DSO) increased slightly to 48 days.
| Metric | May 31, 2026 | Aug 31, 2025 | Change | Notes |
|---|---|---|---|---|
| Cash and Cash Equivalents | $10.17B | $11.48B | ↓11.4% | Decrease reflects $8.2B YTD returned to shareholders and $3.0B in acquisitions. |
| Total Debt[1] | $8.39B | $8.18B | ↑2.6% | Includes long-term debt and material lease liabilities. |
| Long-Term Debt | $5.14B | $5.15B | ↓0.1% | Debt levels remained stable. |
| Lease Liabilities | $3.25B | $3.03B | ↑7.3% | A material debt-like obligation. |
| Net Cash[2] | $1.78B | $3.30B | ↓46.1% | The company maintains a positive net cash position, though reduced from year-end. |
| Receivables & Contract Assets | $16.37B | $15.17B | ↑7.9% | DSO increased to 48 days from 47 days at year-end and 46 days in Q2 FY26. |
| Total Shareholders' Equity | $33.01B | $32.24B | ↑2.4% | — |
Footnotes
- Total Debt is calculated as Current portion of long-term debt and bank borrowings + Long-term debt + Current and Non-current Lease Liabilities. May 31, 2026: $112.8M + $5,029.4M + $750.9M + $2,495.6M = $8,388.7M. Aug 31, 2025: $114.5M + $5,034.2M + $729.0M + $2,305.2M = $8,182.9M.
- Net Cash is calculated as Cash and Cash Equivalents - Total Debt. May 31, 2026: $10,165.2M - $8,388.7M = $1,776.5M. Aug 31, 2025: $11,478.7M - $8,182.9M = $3,295.8M.
C. Cash Flow Analysis
For the nine months ended May 31, 2026, Accenture generated $8.78 billion in free cash flow, a substantial increase from the prior-year period. The company returned $8.21 billion to shareholders through share repurchases and dividends, an increase of $1.3 billion over the same period last year.
| Metric (Nine Months Ended) | YTD FY2026 | YTD FY2025 | Change | Notes |
|---|---|---|---|---|
| Share-Based Compensation Expense | $1.64B | $1.65B | ↓0.6% | Represents a significant non-cash expense at 17.7% of Operating Cash Flow. |
| Operating Cash Flow | $9.27B | $7.56B | ↑22.6% | Strong cash generation from operations. |
| Capital Expenditures | ($0.49B) | ($0.49B) | — | — |
| Free Cash Flow (GAAP)[1] | $8.78B | $7.07B | ↑24.2% | — |
| Share Repurchases | ($5.19B) | ($4.15B) | ↑25.1% | Reflects an accelerated share buyback program. |
| Dividend Payments | ($3.01B) | ($2.78B) | ↑8.3% | The quarterly dividend was increased by 10% year-over-year. |
| Cash Returned to Shareholders[2] | ($8.21B) | ($6.93B) | ↑18.5% | — |
| Debt Repayments/Issuances (Net) | $0 | $4.13B | N/A | No net debt activity in the current period versus a large issuance in the prior-year period. |
Footnotes
- Free Cash Flow is calculated as Net cash provided by operating activities less Purchases of property and equipment. YTD FY2026: $9,267.9M - $492.5M = $8,775.4M. YTD FY2025: $7,560.3M - $492.1M = $7,068.2M.
- Cash Returned to Shareholders is the sum of cash used for Share Repurchases and Dividend Payments. YTD FY2026: $5,193.3M + $3,012.8M = $8,206.1M.
D. Operational Metrics
New bookings were $19.32 billion, representing a book-to-bill ratio of 1.03x. While total bookings were down slightly year-over-year, Consulting bookings remained solid with a 1.10x book-to-bill. The company secured 30 large-client deals over $100 million, bringing the year-to-date total to 104, a 13% increase over the prior year, indicating continued demand for large-scale reinvention programs.
| Metric | Q3 FY2026 | Q3 FY2025 | Change | Notes |
|---|---|---|---|---|
| New Bookings | $19.32B | $19.7B | ↓3% LC (-2.0% USD) | Impacted by approximately $400M in the Middle East and deal slippage in EMEA. |
| Consulting Bookings | $10.26B | — | — | Prior year breakdown not provided. |
| Managed Services Bookings | $9.06B | — | — | A couple of large opportunities moved into FY2027 for company-specific reasons. |
| Book-to-Bill Ratio[1] | 1.03x | 1.11x | ↓8 pts | Consulting book-to-bill was 1.10x; Managed Services was 0.96x. |
| Large Client Deals (> $100M) | 30 | 30 | Flat | Year-to-date total of 104 deals is a 13% increase over the same period last year. |
| Headcount | ~799,000 | ~790,000 | ↑1.1% | Up from ~786,000 in the prior quarter. |
Footnotes
- Book-to-Bill Ratio is calculated as New Bookings / Revenue. Q3 FY2026: $19.32B / $18.72B = 1.03x.
2. Forward-Looking Guidance
A. Guidance Summary
Accenture adjusted its full-year guidance, narrowing and lowering the top end of its revenue growth forecast while raising the low end of its EPS range. The company introduced Q4 guidance that reflects continued macro uncertainty, particularly from the indirect impacts of the Middle East conflict. The most significant change was a substantial increase in the full-year acquisition spend forecast to approximately $9 billion, driven by major investments in OT cybersecurity.
| Metric | Period | Current Guidance | Prior Guidance | Change | Management Commentary |
|---|---|---|---|---|---|
| Revenue | Q4 FY2026 | $17.75B – $18.4B | N/A | New | Represents 1% to 5% growth in local currency, assuming a negative 0.5% FX impact. Management noted that "more of the guided range to be in play for Q4" due to macro uncertainty. |
| Revenue Growth (LC) | FY 2026 | 3% to 4% | 3% to 5% | Narrowed & Lowered | The top end of the range was lowered by 100 bps. Excluding the federal business impact, growth is expected to be 4% to 5%. |
| Adjusted Operating Margin | FY 2026 | 15.8% | 15.7% – 15.9% | Narrowed | Implies a 20 basis point expansion over adjusted FY2025 results, landing within the prior guided range. |
| Adjusted Diluted EPS | FY 2026 | $13.78 – $13.90 | $13.65 – $13.90 | Raised & Narrowed | Represents 7% to 8% growth over adjusted FY2025 results. The bottom end of the range was increased. |
| Free Cash Flow | FY 2026 | $10.8B – $11.5B | $10.8B – $11.5B | Maintained | Reflects a strong free cash flow to net income ratio of 1.3. |
| Cash Returned to Shareholders | FY 2026 | At least $9.5B | At least $9.3B | Raised | Demonstrates continued commitment to returning a substantial portion of cash to shareholders. |
B. Additional Notes & Commentary
- Acquisition Spend: The company now expects to invest approximately $9 billion in acquisitions in FY2026, a significant increase from the $5 billion guided in the prior quarter. This is driven by the announced acquisitions in OT security (Dragos, runZero, NetRise), which are expected to close in the fiscal year.
- Inorganic Contribution: The full-year revenue guidance continues to include an estimated inorganic contribution of approximately 1.5%. Management noted they expect to enter FY2027 with slightly under 2% of inorganic growth contribution from the deals closed in FY2026.
- Foreign Exchange Impact: For the full fiscal year, the company continues to assume a positive 2% tailwind to U.S. dollar revenues.
- Tax Rate: The annual adjusted effective tax rate guidance was narrowed to 24.0% to 25.0%, from a prior range of 23.5% to 25.5%.
- U.S. Federal Business: Management expects the headwind from the federal business to anniversary in Q4, with the segment returning to growth during the quarter.
- Capital Structure Optimization: Accenture expects to access the long-term debt market to increase liquidity for M&A spend and general corporate purposes, while planning to maintain a strong investment-grade credit rating.
3. Operational & Strategic Developments
A. Business Performance & Operations
Management characterized the quarter's performance as solid execution in a complex environment. Demand for large-scale reinvention programs remains the primary driver, evidenced by the year-to-date total of 104 client deals exceeding $100 million, a 13% increase over the same period last year. However, new headwinds emerged that impacted results and the near-term outlook.
- Impact of Middle East Conflict: The most significant new factor was the conflict in the Middle East, which created a direct and indirect financial impact.
- Management quantified a revenue headwind of approximately $100 million compared to expectations, consisting entirely of consulting work. This was split evenly between the direct impact on the company's Middle East business and indirect effects on discretionary spending globally.
- The indirect impact materialized in the last few weeks of the quarter, primarily affecting the Products industry and, to a lesser extent, Resources.
- Sales were impacted by approximately $400 million, concentrated in the Middle East and EMEA, attributed to longer decision-making cycles.
- Managed Services Deal Timing: Bookings were also affected by a couple of large managed services opportunities that were pushed into FY2027 for "company-specific reasons." Management clarified this was not a demand issue but a timing shift of large, lumpy deals.
- AI Demand Trajectory: The company continues to see the adoption of AI as a long-term tailwind, with demand building each quarter.
- Management noted seeing "exciting green shoots" as clients with more advanced digital foundations begin to undertake larger, more complex AI transformation programs.
- The company initiated advanced AI projects with another 100 clients during the quarter.
- Average AI project sizes have shown a steady increase, though they remain small relative to the company's overall scale.
- Commercial Model Evolution: The trend towards fixed-price contracts continues, with management confirming in the Q&A that this type of work remains over 60% of the business and is still increasing. This model is applied similarly across both consulting and managed services.
B. Strategic Initiatives
Accenture announced several major strategic initiatives aimed at expanding its total addressable market (TAM), creating new platform-led growth engines, and pivoting towards more non-FTE (Full-Time Equivalent) revenue models. These moves represent a significant acceleration of the strategy outlined in the prior quarter.
- Major Expansion into OT Security Platform: The company announced its largest strategic move of the year, acquiring a majority stake in Dragos and all of runZero and NetRise to create a unified Operational Technology (OT) security platform.
- Strategic Rationale: Management framed this as a critical move to secure the physical infrastructure (power grids, manufacturing, data centers) that underpins the AI revolution. They stated that "you cannot have an AI revolution without critical infrastructure," which is currently most vulnerable at the OT level.
- Market Opportunity: The investment more than triples Accenture's TAM in the OT security market, which is experiencing double-digit growth. The acquisitions are expected to contribute approximately $208 million in Annual Recurring Revenue (ARR) growing at 48%.
- Business Model: This initiative establishes a new platform-led, non-FTE commercial model, building on the company's existing $10 billion cybersecurity services business.
- Launch of "Accenture Edge" to Target Mid-Market: The company is launching a new business unit to formally target the mid-market, defined as companies with revenues between $300 million and $3 billion.
- Strategic Rationale: Management identified this as a $240 billion addressable market growing at high-single digits. The initiative is designed to structurally offset the persistent weakness in smaller, discretionary projects within large enterprises by tapping into a new client segment.
- Go-to-Market: The model is ecosystem-led, providing solutions that are faster to deploy and right-sized for mid-market clients. It will feature seamless integration with Avanade, the company's joint venture with Microsoft.
- Accelerated Capital Deployment: Driven by the OT security acquisitions, Accenture dramatically increased its planned M&A spend for the fiscal year.
- The company now expects to deploy approximately $9 billion in capital for acquisitions in FY2026, a substantial increase from the $5 billion guided in the prior quarter.
- This aligns with the stated strategy of acquiring assets in higher-growth areas and shifting the business mix towards more platform and IP-led revenue.
C. Risk Factors & Headwinds
- New/Escalated Risk: Macro Uncertainty from Geopolitical Conflict: While the Middle East conflict was flagged as a risk in the prior quarter, its financial impact has now materialized and is expected to persist.
- Current Impact: The conflict directly reduced Q3 revenue by an estimated $100 million and bookings by $400 million.
- Forward-Looking Impact: Management expects the indirect effects on discretionary spending, which began late in Q3, to continue through Q4. This uncertainty was the primary reason for stating that "more of the guided range is in play" for the fourth quarter. This represents a significant increase in near-term risk compared to the prior quarter, when management saw "no significant financial impact."
- Persistent Headwind: U.S. Federal Business: The U.S. Federal business continued to be a drag on growth, impacting the Americas region by approximately 1.5% in the quarter. However, management reiterated their expectation from Q2 that this headwind will be anniversaried in Q4, with the business expected to return to growth in the final quarter of the fiscal year.
- Persistent Issue: Weak Discretionary Spending: The cautious spending environment for smaller, discretionary projects at large enterprises continues. The new geopolitical headwinds appear to be exacerbating this trend. Accenture's strategic launch of the mid-market focused "Accenture Edge" is a direct response intended to mitigate this persistent challenge over the long term.
4. Q&A Session Key Themes
A. Analyst Focus Areas
The Q&A session was dominated by questions seeking to understand the implications of Accenture's aggressive strategic pivots, particularly the $9 billion M&A plan and the major push into OT security. This theme is a direct and intensified continuation from the prior quarter, where the initial $5 billion M&A acceleration was a key topic. Analysts also focused heavily on the newly materialized geopolitical headwinds and their impact on the Q4 outlook.
- Strategic Rationale and Risk of OT Security Acquisitions: The most prominent topic was the acquisition of Dragos, runZero, and NetRise. Analysts probed the strategic thesis, the potential for integration risk from combining three assets, and the prioritization of security as a key AI enabler.
- Management Response: CEO Julie Sweet framed the move as a long-term strategic play to secure critical physical infrastructure, which she argued is a prerequisite for the AI revolution. She strongly downplayed integration risk, stating Dragos provides a strong core platform and the combination immediately simplifies procurement for clients ("one buy, not three").
- Impact of Middle East Conflict on Guidance: Analysts sought to quantify the impact of the Middle East conflict on the Q4 forecast and understand the assumptions behind the wide 1%-5% revenue growth range.
- Management Response: Management confirmed that the indirect impact on discretionary spending, which began in the last few weeks of Q3, is expected to persist through Q4. They clarified that the low end of the Q4 guidance range assumes these negative trends continue or worsen, while the high end would require stabilization or an improvement.
- Consulting Bookings vs. Revenue Disconnect: A key point of inquiry was the divergence between four consecutive quarters of strong consulting bookings and the more "tepid" 1% local currency revenue growth in the quarter.
- Management’s Explanation: Management attributed the slow revenue conversion primarily to the $100 million revenue headwind from the Middle East, which was entirely concentrated in consulting. They anticipate a "tick up" in consulting growth in Q4, supported by the strong backlog and the anniversarying of the U.S. Federal business headwind.
B. Key Challenges & Concerns
Analysts directly challenged management's narrative on several fronts, reflecting increased uncertainty about the near-term outlook and the risk profile of the company's strategic moves.
- Concern: Integration Risk of Large, Multi-Part Acquisitions: An analyst explicitly raised the concern of "above-average risk" in "stitching together the three OT security assets."
- Management’s Rebuttal: The CEO firmly rejected this premise, arguing the move reduces complexity for clients and builds upon an existing strong platform. The forceful rebuttal underscored management’s conviction in the strategic fit and execution plan.
- Concern: Lack of Near-Term Visibility: The wide Q4 guidance range prompted multiple questions aimed at sensitizing the potential outcomes. This reflects analyst unease with the degree of uncertainty being signaled, a notable shift from the more confident and raised guidance of the prior quarter.
- Concern: AI-Driven Budget Displacement: An analyst questioned whether heavy client spending on AI infrastructure and tokens was pressuring their budgets for traditional services.
- Management’s Response: Management stated they are not seeing a material negative impact on services spend. In fact, they see an emerging opportunity in helping clients optimize token usage, similar to how they built a FinOps practice to optimize cloud spend.
5. Strategic Themes & Inflection Points
A. Current Period Themes
- Dominant Narrative: Executing Through Headwinds While Aggressively Pivoting to New Markets: Management's narrative is a dual-track story of delivering solid results despite newly materialized geopolitical headwinds, while simultaneously launching its most significant strategic pivots in recent years. The focus is on long-term market expansion and business model evolution, even as near-term uncertainty has increased.
- Operational Focus: Aggressive Capital Deployment for Strategic Market Creation: The most significant operational theme is the massive acceleration of the M&A strategy. The planned capital deployment has been raised to $9 billion from $5 billion in the prior quarter, driven by the intent to build a new, platform-led OT security business.
- Change in Tone: Increased Caution on Near-Term Outlook: Compared to the confident guidance raise in Q2, management’s tone regarding the Q4 outlook is notably more cautious. The explicit statement that "more of the guided range is in play" due to macro uncertainty marks a distinct shift, directly reflecting the financial impact of the Middle East conflict which was only a monitored risk in the prior quarter.
B. Future Considerations
- Emerging Opportunities: Deliberate Expansion of Total Addressable Market (TAM): The launch of the Accenture Edge mid-market business and the major investment in an OT Security Platform represent a clear strategic initiative to expand the company's TAM. This is a direct response to persistent weakness in discretionary spending at large enterprises and is intended to create new, structural growth drivers.
- External Environment: Geopolitical Conflict as a Material Headwind: The Middle East conflict has evolved from a flagged risk in Q2 to a tangible headwind impacting Q3 revenue and bookings, and it is the primary driver of uncertainty in the Q4 outlook. Its persistence and potential to weigh on global discretionary spending is now a key external factor for the near term.
- Transformation Initiatives: Accelerating the Pivot to Non-FTE, Platform-Led Revenue: The OT security acquisitions represent the most significant step to date in Accenture's long-term strategy to shift towards non-FTE, IP-led commercial models. This was an emerging theme in the prior quarter with the Ookla acquisition but has now been elevated to a central, heavily funded pillar of the company's future growth strategy, signaling a fundamental evolution of its business model.
6. Key Items to Monitor Next Quarter
A. Prior Quarter Monitoring Review
The following table reviews the status of key items identified in the prior quarter (Q2 FY2026) based on management’s commentary and results from the current quarter (Q3 FY2026).
| Prior Item | Current Status | Management Commentary |
|---|---|---|
| Execution of Accelerated M&A Strategy | On Track | The company significantly accelerated this strategy, increasing its full-year acquisition spend forecast to approximately $9 billion, up from $5 billion in Q2. This was driven by the announced acquisitions of Dragos, runZero, and NetRise to build a new OT Security platform. |
| Growth in Non-FTE Revenue Streams | On Track | Management reinforced this strategic pivot with the OT Security acquisitions, which are expected to contribute $208 million in ARR growing at 48%. The company also highlighted other platform-led acquisitions like Alfahealth, demonstrating continued execution on shifting to non-FTE models. |
| U.S. Federal Business Recovery | On Track | Management reiterated their expectation that the U.S. Federal business will anniversary its headwind and return to growth in Q4 FY2026. The business represented a ~1.5% drag on Americas growth in Q3. |
| Large Deal Momentum | On Track | The company secured 30 deals over $100 million in the quarter, bringing the year-to-date total to 104, a 13% increase over the same period last year. This continues to signal strong demand for large-scale reinvention programs. |
| AI Ecosystem Partner Bookings Growth | On Track | Management confirmed the company is "on track to more than double our bookings from our key emerging AI and data partners compared with FY 2025," reaffirming this key AI growth metric. |
B. Current Quarter Focus Items
The following table outlines the key non-guidance metrics and developments to monitor, based on the Q3 FY2026 earnings call.
| Category | Item | Timeline | What to Monitor | Why It Matters |
|---|---|---|---|---|
| Risk | Geopolitical Impact on Discretionary Spend | Next Quarter (Q4 FY2026) | Commentary on whether the indirect impact on discretionary spend, which began late in Q3, stabilized, worsened, or improved during the fourth quarter. | This materialized from a monitored risk into a $100M revenue headwind and is the primary driver of the increased uncertainty and wide 1%-5% growth range for the Q4 outlook. The outcome will set the tone for the initial FY2027 forecast. |
| Strategic | Execution & Integration of OT Security Platform | Ongoing / FY 2027 | Confirmation of the successful closing of the Dragos, runZero, and NetRise acquisitions. Monitor for early commentary on integration progress, client reception, and updates on the platform's ARR and growth trajectory. | This is the company's largest strategic move of the year and the cornerstone of its pivot to platform-led, non-FTE revenue models. Successful execution is critical to justifying the $9 billion M&A budget and creating a new, high-growth, high-margin business. |
| Opportunity | "Accenture Edge" Mid-Market Launch & Traction | Next Quarter / FY 2027 | Initial commentary on the launch and early market traction of the Accenture Edge business. Look for any qualitative feedback on pipeline development, client wins, or ecosystem partner engagement. | This initiative is designed to structurally offset the persistent weakness in smaller, discretionary projects at large enterprises. Gaining early traction is key to validating the strategy of tapping into the $240 billion mid-market TAM as a new growth driver. |
| Operational | Consulting Revenue Re-acceleration | Next Quarter (Q4 FY2026) | Whether consulting revenue growth accelerates in Q4 from the 1% LC growth in Q3, as projected by management. | Validating the re-acceleration is crucial to proving that the Q3 slowdown was a one-time event due to the $100M geopolitical headwind and not a sign of a broader issue with backlog conversion or underlying demand. |
| Risk | Managed Services Large Deal Conversion | Ongoing / FY 2027 | Commentary on the health of the large managed services deal pipeline, particularly whether there is any further slippage of large deals into later fiscal years or if the pipeline is converting as expected. | Large deals are a core driver of bookings and future revenue. While management downplayed the Q3 slippage as timing-related, a pattern of delays could signal increased sales cycle complexity, impacting future growth visibility. |
Appendix: Quotes by Theme
-
Strategic Rationale for Aggressive M&A Pivot to OT Security: Management framed the major acquisitions in Operational Technology (OT) security not just as a market expansion, but as a foundational necessity for the entire AI revolution, justifying the significant capital outlay.
"This is about long-term growth and really a massive market... You can't have an AI revolution unless you have critical infrastructure... and you can't have that without OT security. 95% of spend in the past has been about IT security, and OT security is a much bigger market and critical need." — Julie Sweet, CEO
-
Escalation of Geopolitical Risk from Monitored Concern to Material Headwind: The impact of the Middle East conflict evolved from a potential risk with no financial impact in Q2 to a direct, quantified headwind in Q3, significantly increasing near-term uncertainty.
"We saw a revenue impact of approximately $100 million compared to our expectations, which was all consulting type of work... Sales in the Middle East were impacted by approximately $400 million and also in EMEA due to longer decision-making." — Julie Sweet, CEO (Q3-FY26)
- vs Q2-FY26:
"Currently, we are not seeing any significant financial impact. While we know the environment is more uncertain given the conflict, we always call it like we see it... Our range for Q3 and the full year reflect our best view today... It does not take into account a significant escalation." — Angie Park, CFO
-
Increased Caution on Near-Term Outlook: Management's tone shifted from confidence in Q2 to explicit caution for Q4, directly citing the late-quarter emergence of indirect geopolitical impacts on discretionary spending.
"Because the indirect impact really started in the last few weeks and mostly in discretionary spend, we do think that there will be more impact in Q4, which is why we're saying that more of the range is in play." — Julie Sweet, CEO (Q3-FY26)
- vs Q2-FY26:
"Based upon the information we have today, we are increasing key elements of our full year guidance... our guided range, we do aim for the top. We'll see how things play out, but it's our best view." — Angie Park, CFO
-
Maturation of AI Demand Narrative: While still framing AI as a long-term tailwind, the commentary evolved to highlight the emergence of larger, more complex AI programs from clients with mature digital foundations, signaling a new phase of adoption.
"Finally, clients with more advanced digital cores are starting to take on larger AI programs. Exciting green shoots... When we look at the AI projects themselves, while still small, there's been a steady increase in the average size." — Julie Sweet, CEO (Q3-FY26)
- vs Q2-FY26:
"And third, clients with more advanced digital cores are starting to take on larger AI programs. We also are seeing more moving from proof of concept to production, while others are still at the beginning of their journey." — Julie Sweet, CEO
-
Explanation for Consulting Revenue Slowdown: In response to analyst questions about the disconnect between strong consulting bookings and tepid revenue growth, management directly attributed the near-term weakness to the geopolitical headwind.
"...we did see it tick down, and it was the result of the indirect and the direct impact of the Middle East. The $100 million that we called out was all in consulting type of work. We do expect in Q4... a tick up, which is comprised of both the AFS returning to growth as well as we've had four consecutive quarters... of consulting bookings growth." — Angie Park, CFO (Q&A)
-
Analyst Sentiment Shift from Opportunity to Risk: Analyst questions pivoted from focusing on the upside potential of AI in Q2 to probing near-term risks in Q3, including M&A integration, bottom-line protection, and the impact of geopolitical headwinds.
"Is there above-average risk here because you're stitching together the three assets, and it sounds like there's going to be some initial dilution... What are you doing to protect the bottom line to the extent that you see maybe if we start to lean more towards the bottom end of the range?" — Tien-Tsin Huang, Analyst, JPMorgan (Q3-FY26)
- vs Q2-FY26:
"What kind of quantitative evidence should investors be looking at to help substantiate the view that Accenture is a net beneficiary of AI?... Any reason to not think the upper part of the full year 3% to 5% range is a pretty plausible outcome?" — Jason Kupferberg, Analyst, Wells Fargo
-
Launch of Mid-Market Strategy to Offset Discretionary Spend Weakness: Management introduced "Accenture Edge" as a new business to structurally address the persistent challenge of weak discretionary spending in large enterprises by targeting a new, high-growth client segment.
"We estimate that the mid-market... is a $240 billion addressable market for us, growing high single digits... Going into the mid-market in a big way is going to allow us to structurally offset the challenge on the discretionary spend for large enterprises through this." — Julie Sweet, CEO
-
Positioning M&A as a Tool for Business Model Evolution: Management explicitly linked the accelerated M&A strategy to a long-term plan to shift towards higher-growth, non-FTE commercial models, moving beyond simple capability acquisition.
"It's much easier to go into new categories or to provide new kinds of value, and switch to non-FTE models. You've seen that with what we just did with cybersecurity... We're going to continue to move ourselves into non-FTE, in part by these acquisitions that will then drive organic growth." — Julie Sweet, CEO
Historical Performance