Executive Summary
Meta reported strong Q1 results, with revenue growing 33% YoY to $56.3B, providing the financial firepower for its intensified AI investment cycle. Management raised its full-year 2026 CapEx guidance by $10B to $125B–$145B, citing higher component costs. This commitment was further solidified by a massive $107B step-up in multi-year contractual commitments for infrastructure, locking in an aggressive, long-term spending trajectory.
To manage this spend, the company is implementing efficiency measures, announcing a plan to reduce its employee base in May 2026. The investment is supported by tangible progress, including the release of its first advanced model, MuSpark, and strong AI-driven results in the core business, such as a 10% lift in Instagram Reels time spent. Monetization tools also showed significant scale, with the Value Optimization suite's annual revenue run rate doubling to over $20B.
The quarter reinforces Meta's 'all-in' strategy on achieving leadership in 'Personal Super Intelligence.' While the core business is performing exceptionally well, the escalating and open-ended investment cycle, now facing hardware cost inflation, continues to prioritize long-term AI positioning over near-term free cash flow and capital returns, a pivot underscored by the absence of share repurchases for a second consecutive quarter.
1. Financial Performance Summary
This summary reflects Meta's performance for the first quarter of fiscal year 2026, which ended on March 31, 2026. All financial figures are sourced from the company's SEC filing. All comparisons are year-over-year (YoY) unless otherwise specified.
A. Income Statement Metrics
Meta reported Q1 revenue of $56.3B, a 33% YoY increase (29% in constant currency), landing near the high end of its prior guidance range. The performance was driven by a 33% YoY increase in Family of Apps (FoA) advertising revenue, supported by a 19% increase in ad impressions and a 12% increase in average price per ad.
Reported net income and EPS were significantly impacted by a one-time $8.03B tax benefit. Excluding this item, adjusted net income was $18.7B and adjusted diluted EPS was $7.31.
| Metric | Q1 2026 | Q1 2025 | Change | Notes |
|---|---|---|---|---|
| Total Revenue | $56.31B | $42.31B | ↑ 33.1% | Growth was 29% in constant currency. Met guidance of $53.5B–$56.5B. |
| Family of Apps (FoA) Revenue | $55.91B | $41.90B | ↑ 33.4% | FoA advertising revenue grew 33% to $55.02B. |
| Reality Labs (RL) Revenue | $402M | $412M | ↓ 2.4% | Lower Quest headset sales were partially offset by growth in AI glasses revenue. |
| GAAP Operating Income | $22.87B | $17.56B | ↑ 30.3% | |
| FoA Operating Income | $26.90B | $21.77B | ↑ 23.6% | |
| RL Operating Loss | ($4.03B) | ($4.21B) | ↓ 4.3% | Operating loss narrowed slightly compared to the prior year. |
| GAAP Operating Margin | 40.6% | 41.5% | ↓ 90 bps | Margin was stable, reported as 41% in both periods in the filing. |
| GAAP Net Income | $26.77B | $16.64B | ↑ 60.9% | Includes a significant one-time tax benefit. |
| Adjusted Net Income[1] | $18.74B | — | — | Excludes an $8.03B tax benefit related to R&D expenditure treatment. |
| GAAP Diluted EPS | $10.44 | $6.43 | ↑ 62.4% | |
| Adjusted Diluted EPS[1] | $7.31 | — | — | EPS would have been $3.13 lower without the tax benefit. |
Footnotes
- Q1 2026 GAAP Net Income and Diluted EPS include an $8.03 billion income tax benefit. This benefit is related to updated U.S. Treasury guidance on the tax treatment of previously capitalized R&D costs. Excluding this non-cash benefit, Net Income would have been $18.74B ($26.77B - $8.03B) and Diluted EPS would have been $7.31 ($10.44 - $3.13), as stated by management and confirmed in the filing. The adjustment represents 42.8% of the adjusted Diluted EPS.
B. Balance Sheet Highlights
Meta's liquidity remains strong with $81.2B in cash and marketable securities. The company's net debt position increased during the quarter, driven by higher operating lease liabilities and a reduction in cash.
| Metric | Mar 31, 2026 | Dec 31, 2025 | Change | Notes |
|---|---|---|---|---|
| Cash & Marketable Securities | $81.18B | $81.59B | ↓ 0.5% | Liquidity position remains stable. |
| Total Debt[1] | $86.77B | $83.90B | ↑ 3.4% | Increase driven primarily by higher operating lease liabilities. |
| Long-Term Debt | $58.75B | $58.74B | Flat | |
| Operating Lease Liabilities | $28.02B | $25.15B | ↑ 11.4% | |
| Net Debt[2] | $5.59B | $2.31B | ↑ 142.0% | The company's net debt position more than doubled during the quarter. |
| Accounts Receivable, net | $17.47B | $19.77B | ↓ 11.6% | Seasonal decrease following the Q4 holiday period. |
| Total Assets | $395.25B | $366.02B | ↑ 8.0% | Growth driven by a $18.4B increase in Property and Equipment, net. |
| Shareholders' Equity | $243.68B | $217.24B | ↑ 12.2% | Increased due to strong net income. |
Footnotes
- Total Debt is calculated as Long-Term Debt plus Operating Lease Liabilities (current and non-current). For Q1 2026: $58,748M + $2,414M + $25,607M = $86,769M. For Q4 2025: $58,744M + $2,213M + $22,940M = $83,897M.
- Net Debt is calculated as Total Debt less Cash and Marketable Securities. For Q1 2026: $86,769M - $81,180M = $5,589M. For Q4 2025: $83,897M - $81,592M = $2,305M.
C. Cash Flow Analysis
Meta generated $12.4B in Free Cash Flow during the quarter, an increase of 19.9% YoY, as strong operating cash flow growth outpaced higher capital expenditures. The company did not repurchase any shares for the second consecutive quarter, instead paying $1.3B in dividends.
| Metric | Q1 2026 | Q1 2025 | Change | Notes |
|---|---|---|---|---|
| Net Cash from Operations | $32.23B | $24.03B | ↑ 34.1% | Driven by strong net income. |
| Capital Expenditures[1] | $19.84B | $13.69B | ↑ 44.9% | Investments in servers, data centers, and network infrastructure continue to ramp. |
| Free Cash Flow[2] | $12.39B | $10.33B | ↑ 19.9% | |
| Share Repurchases | $0 | ($12.75B) | N/A | No shares were repurchased, consistent with the prior quarter. |
| Dividend Payments | ($1.35B) | ($1.33B) | ↑ 1.5% |
Footnotes
- Capital Expenditures includes Purchases of property and equipment ($18,997M) and Principal payments on finance leases ($843M).
- Free Cash Flow is calculated as Net Cash from Operations minus Capital Expenditures.
D. Key Financial Ratios
The company's profitability and leverage metrics reflect the impact of the one-time tax benefit on net income and the ongoing infrastructure investment on its balance sheet.
| Metric | TTM as of Q1 2026 | TTM as of Q1 2025 | Change | Notes |
|---|---|---|---|---|
| Return on Equity (ROE)[1] | 32.5% | 33.2% | ↓ 70 bps | TTM ROE remains strong and stable. |
| Net Debt to EBITDA[2] | 0.05x | (0.25x) | Shift to Net Debt | Leverage remains minimal despite the shift from a net cash position. |
Footnotes
- Return on Equity (ROE) is calculated on a trailing twelve-month (TTM) basis using Adjusted Net Income to exclude the one-time tax benefit in Q1 2026 for comparability. TTM Adjusted Net Income = $67.1B. Average Shareholders' Equity = $206.5B.
- Net Debt to EBITDA is calculated on a TTM basis. Net Debt at period end = $5.59B. TTM EBITDA calculated as TTM Operating Income ($88.6B) + TTM Depreciation & Amortization ($20.7B) = $109.3B.
E. Operational Metrics
User and engagement metrics showed continued strength, driving monetization. Headcount declined slightly on a sequential basis but remained up year-over-year.
| Metric | Q1 2026 | Q1 2025 | Change | Notes |
|---|---|---|---|---|
| Family Daily Active People (DAP) | 3.56B | 3.42B (est.) | ↑ 4% | QoQ decline was attributed to internet disruptions in Iran and access restrictions in Russia. |
| Ad Impressions | — | — | ↑ 19% | Growth was healthy across all regions. |
| Average Price per Ad | — | — | ↑ 12% | Broad-based growth driven by ad performance improvements and better macro conditions. |
| Headcount | 77,986 | 77,114 | ↑ 1% | Headcount was down 1% sequentially from Q4 2025 (78,865). |
2. Forward-Looking Guidance
Management raised its full-year 2026 capital expenditure guidance, citing higher component pricing and additional data center costs. The outlooks for total expenses and operating income for the fiscal year remain unchanged from the prior quarter.
A. Guidance Summary
The following table outlines the company's financial outlook. All figures are sourced from the company's Q1 2026 earnings release and conference call.
| Metric | Period | Current Guidance | Prior Guidance (from Q4 2025 Call) | Change | Management Commentary |
|---|---|---|---|---|---|
| Total Revenue | Q2 2026 | $58.0B – $61.0B | N/A | Introduced | Guidance assumes an approximate 2% foreign currency tailwind to YoY growth. |
| Total Expenses | FY 2026 | $162.0B – $169.0B | $162.0B – $169.0B | Maintained | The outlook for total expenses remains unchanged. |
| Capital Expenditures | FY 2026 | $125.0B – $145.0B | $115.0B – $135.0B | Raised | The increase reflects expectations for higher component pricing and additional data center costs for future capacity. |
| Operating Income | FY 2026 | > FY 2025 Level | > FY 2025 Level | Maintained | Management continues to expect absolute operating income dollars will be above the FY2025 level. |
| Tax Rate | FY 2026 | 13% – 16% | 13% – 16% | Maintained | This range applies to the remaining quarters of 2026, assuming no changes to the tax landscape. |
B. Additional Notes & Commentary
- Capital Commitments: The company's contractual commitments saw a $107B step-up in Q1, driven by multi-year cloud deals and infrastructure purchase agreements intended to secure future capacity.
- Headcount Reduction: Management disclosed a plan to reduce the size of its employee base in May, stating a belief that a "leaner operating model" will help offset its substantial infrastructure investments and allow the company to move more quickly.
- Legal and Regulatory Headwinds: Management reiterated ongoing risks from legal and regulatory matters in the EU and the U.S.
- Specifically noted were continued scrutiny on youth-related issues and additional trials scheduled for 2026 in the U.S. that management stated "may ultimately result in a material loss."
3. Operational & Strategic Developments
A. Business Performance & Operations
- Advertising Engine Strength: The core advertising business demonstrated robust health, driven by a 19% YoY increase in ad impressions and a 12% YoY increase in average price per ad. Management attributed the pricing strength to improved ad performance, better macroeconomic conditions compared to Q1 2025, and currency tailwinds.
- AI-Driven Engagement Gains: Significant improvements in content recommendation systems, powered by AI, led to notable engagement growth.
- On Instagram, ranking enhancements drove a 10% lift in Reels time spent.
- On Facebook, total video time increased by more than 8% quarter-over-quarter, the largest such gain in four years.
- These gains were attributed to technical advances, including doubling the length of user interaction data for training models and increasing the speed of indexing new content. As a result, same-day posts now constitute over 30% of recommended Reels, more than double the level from a year ago.
- Monetization & Commerce Scaling: The company continues to advance monetization across its platforms through AI-powered tools and new ad surfaces.
- Ad System Performance: Enhancements to the Lattice and GEM model architectures drove a more than 6% increase in conversion rates for landing page view ads. The expansion of its adaptive ranking model resulted in a 1.6% increase in conversion rates across major surfaces.
- Advertiser Tools: Adoption of Gen AI ad creative tools is scaling, with 8 million advertisers now using at least one such tool. Advertisers using the video generation feature saw more than 3% higher conversion rates in tests.
- Business Messaging: Weekly conversations facilitated by Business AIs grew 10x since the beginning of the year, from 1 million to over 10 million.
- Commerce Products: The annual revenue run rate for the Value Optimization suite more than doubled YoY to over $20B. The Partnership Ads product also saw its revenue run rate more than double YoY to $10B.
- Reality Labs & AI Devices:
- AI Glasses: Daily usage of the company's AI glasses has tripled year-over-year. The company released new "optics" versions designed for all-day wear.
- Quest Headsets: Lower sales of Quest headsets partially offset the growth from AI glasses, leading to a slight YoY decline in the segment's revenue.
B. Strategic Initiatives
- "Personal Super Intelligence" Vision: The central strategic theme is the development and deployment of AI agents. The CEO articulated a vision focused on building "personal and business agents to billions of people," differentiating Meta's approach as one that "amplifies people's ability" rather than replacing them.
- Meta Super Intelligence Labs (MSL): The lab released its first model, MuSpark, which now powers the Meta AI assistant. Management stated the lab is on track and is already training more advanced models.
- Massive Infrastructure Investment & Commitments: The company is accelerating its infrastructure build-out to support its AI ambitions, a strategy underscored by several key developments.
- Increased CapEx: The full-year 2026 CapEx guidance was raised, primarily due to higher component costs (specifically memory pricing).
- $107B Step-Up in Commitments: The company entered into multi-year cloud deals and infrastructure purchase agreements, resulting in a $107B increase in contractual commitments during the quarter to secure future capacity.
- Efficiency Focus ("Meta Compute"): To improve the efficiency of this investment, the company is rolling out over 1 gigawatt of its own custom silicon developed with Broadcom, alongside AMD chips, to complement its NVIDIA systems.
- Organizational Restructuring: In conjunction with its increased investments, management is taking steps to create a "leaner operating model." The CFO confirmed a plan to reduce the size of the employee base in May 2026 to help offset investment costs and increase operational speed.
C. Risk Factors & Headwinds
- Massive Investment Cycle (Persistent & Escalating): The primary financial theme is the intensification of the company's investment cycle. The decision to raise the 2026 CapEx guidance and the massive $107B step-up in off-balance-sheet commitments reaffirm that the company is prioritizing long-term AI leadership over near-term financial metrics.
- Balance Sheet Impact: This strategy continues to reshape the balance sheet. Net debt more than doubled sequentially to $5.6B.
- Capital Allocation Shift: For the second consecutive quarter, the company did not repurchase any shares, reinforcing the strategic pivot to allocate all available capital toward infrastructure investment and dividends.
- Operational & External Headwinds:
- Regulatory Scrutiny (Persistent): Management reiterated that it continues to monitor legal and regulatory risks in the EU and the U.S. with no new updates on resolution. Specific mention was made of ongoing scrutiny related to youth issues and a number of trials scheduled for 2026 in the U.S. that "may ultimately result in a material loss," consistent with commentary from previous quarters.
- Supply Chain & Cost Inflation (New Emphasis): The explicit reason provided for raising the 2026 CapEx outlook was "higher component pricing." This highlights a direct financial risk from supply chain inflation and cost management challenges for critical AI hardware.
4. Q&A Session Key Themes
A. Analyst Focus Areas
The Q&A session was dominated by questions seeking to understand the return on investment (ROI) and tangible product roadmap for the company's escalating AI investments, a direct and intensified continuation of the central theme from the prior quarter.
-
Justifying the Investment & Defining ROI (Recurring & Intensified): The primary line of inquiry focused on the "signposts" management is watching to ensure its massive capital expenditures will generate healthy returns. Analysts sought to understand the framework for evaluating the investment in the absence of a near-term monetization strategy, especially given the dynamic outlook for 2027 CapEx.
- Management’s Response: Mark Zuckerberg reiterated the company's long-term playbook: 1) build leading models, 2) convert them into products that scale to billions of users, and 3) monetize once scale is achieved. He emphasized tracking technical progress and user adoption as the key near-term milestones rather than specific financial metrics. Susan Li added that the company has historically underestimated its compute needs, suggesting that investment levels will remain substantial as new opportunities are identified.
-
AI Product Roadmap & Timeline (New Specificity): With the release of the MuSpark model, analyst questions shifted from the high-level research effort to the tangible product cadence. Analysts pressed for details on when to expect new consumer or business products built on the new models and what the "unlock" from MuSpark enables.
- Management’s Response: Management communicated that the product teams are now "unlocked" to build on a strong internal model. However, Zuckerberg deliberately tempered expectations on timing, stating he is more focused on product quality than hitting a specific date, noting, "There aren't that many that I would want to give to my mother." He indicated that the product roadmap and vision will come into focus over subsequent quarters.
-
Competitive AI Strategy & Vision: Analysts explored Meta's strategic positioning within the broader AI landscape, questioning its focus on consumer applications versus developer tools and its path to self-improving models.
- Management’s Response: Zuckerberg differentiated Meta's vision as being uniquely focused on "personal super intelligence" to empower individuals, contrasting it with what he described as others' focus on centralized AI for societal productivity. He confirmed that while the primary goal is building consumer and business agents, achieving recursive self-improvement in models is a "table stakes" necessity to remain a leading lab and is a core focus.
-
Sustainability of Core Business Growth: An analyst questioned whether the significant gains from ranking and recommendation model improvements were becoming "long in the tooth."
- Susan Li provided a detailed and confident rebuttal, outlining a multi-faceted roadmap for future engagement growth. Key initiatives include scaling model complexity, using longer user interaction histories for training, making recommendations more personalized to real-time interests, and integrating LLMs to provide more granular user feedback. This response signaled strong internal conviction in the continued runway for the core advertising and engagement engine.
B. Key Challenges & Concerns
The primary tension throughout the Q&A was the disconnect between the unprecedented scale of Meta's announced investments and the lack of a clear, quantifiable, and near-term monetization framework. Analysts consistently challenged management to provide more concrete financial guardrails and timelines.
- Vague ROI Framework: The most significant concern, carried over from the prior quarter, is the ambiguity around how and when the massive infrastructure spend will translate into profitable revenue streams. When asked for key factors to watch over the next 12-24 months, management's response centered on the qualitative "shape" of product scaling and technical progress, offering little in the way of financial metrics for investors to model.
- Uncapped Investment Horizon: When questioned about the 2027 CapEx outlook, Susan Li's response that the company has "continued to underestimate our compute needs" signaled that a ceiling for investment has not been established. This lack of a defined endpoint for the investment cycle remains a key area of uncertainty and concern for analysts trying to forecast future free cash flow.
- Ambiguous Product Timelines: Management's refusal to commit to a specific product launch cadence for its new AI agents was a recurring point of challenge. While emphasizing a focus on quality, the lack of a timeline makes it difficult to assess when new, non-advertising revenue streams might begin to contribute meaningfully, leaving the core ads business to fund the entirety of the investment for the foreseeable future.
5. Strategic Themes & Inflection Points
This quarter, Meta's narrative transitioned from quantifying its massive investment cycle to demonstrating the first tangible outputs of that strategy. The company is doubling down on its "all-in" AI investment, now reinforced by massive off-balance-sheet commitments, while simultaneously introducing an efficiency counter-narrative through planned headcount reductions.
A. Current Period Themes
- From Financial Escalation to Product Realization: The dominant theme has evolved from the prior quarter's focus on the financial scale of the AI investment to the initial product delivery. The release of the MuSpark model and the upgraded Meta AI assistant marks a pivotal shift, moving the conversation from planning the spend to showcasing the early capabilities that are now "unlocking" product development teams.
- Defining the "Personal Super Intelligence" Vision: Management dedicated significant time to articulating a consumer-centric AI vision focused on "amplifying people's ability" through personal and business agents. This is a deliberate effort to differentiate Meta's strategy from competitors perceived as focusing more on enterprise productivity or centralized AI, carving out a unique, individual-empowerment narrative.
- Reinforcing Investment Scale with Off-Balance Sheet Commitments: Beyond raising the 2026 CapEx guidance, the disclosure of a $107B step-up in multi-year contractual commitments for cloud and infrastructure signals a locked-in, long-term investment strategy. This materially expands the company's total capital obligation far beyond a single year's budget, underscoring the depth of its commitment.
- Efficiency as a Counter-Narrative: Juxtaposed with the escalating spend, management introduced a strong efficiency theme. The plan for a headcount reduction in May and the emphasis on a "leaner operating model" are being positioned as necessary disciplines to offset massive infrastructure costs and increase operational velocity.
B. Future Considerations
- The Uncapped Investment Horizon Continues: Management's commentary that the company has "continued to underestimate our compute needs" reiterates the message from the prior quarter, signaling that the investment cycle remains open-ended. The raised 2026 CapEx guidance should not be viewed as a potential peak, leaving future free cash flow generation as a key point of uncertainty.
- Monetization is Explicitly a Long-Term Goal: The CEO clearly communicated that the focus for new AI products, particularly Meta AI, will be on scaling engagement for at least the next year, with monetization to follow. This confirms that the highly profitable core advertising business will be expected to fund the entirety of the AI investment for the foreseeable future.
- The Key Metric Shifts from Technical Progress to Product Adoption: With the first advanced model now released, the critical signpost for success is evolving. The focus will shift from the technical capabilities of Meta's models to its ability to convert that technology into products that achieve mass-market adoption. The key metric to watch is no longer just model performance but the user growth and engagement of Meta AI and other agentic products.
- Supply Chain Inflation Emerges as a Tangible Risk: The explicit call-out of "higher component pricing" as a primary driver for the increased CapEx guidance introduces a new external risk factor. While the level of investment is a strategic choice, hardware cost inflation represents a tangible pressure that could further strain financial models and challenge the ROI of the infrastructure build-out.
6. Key Items to Monitor Next Quarter
A. Prior Quarter Monitoring Review
The following table provides an update on the key items identified for monitoring in the prior quarter's analysis (Q4 2025).
| Prior Item | Current Status | Management Commentary |
|---|---|---|
| Reality Labs "Peak Loss" | No Update | Management did not reiterate the "peak loss" guidance from the prior quarter. Q1 2026 RL operating loss of $4.0B was slightly narrower YoY, but no new full-year outlook was provided. |
| Initial "Personal Superintelligence" Product Rollout | Achieved | Management announced the release of its first model, MuSpark, from Meta Super Intelligence Labs, which is now powering a "significantly upgraded new version of Meta AI." |
| Free Cash Flow Generation vs. CapEx Burn | No Update / Risk Escalated | Management provided no update on the full-year FCF outlook. However, the risk has intensified as the full-year 2026 CapEx guidance was raised by $10B at the midpoint, increasing pressure on FCF generation. |
| Capital Return Policy (Share Repurchases) | On Track | The company did not repurchase any shares in Q1 2026, continuing the pause from Q4 2025 and reinforcing the strategic shift to prioritize internal investment over buybacks. |
| Execution of "MetaCompute" Partnerships | On Track | While no new JVs were announced, the company disclosed a $107B step-up in contractual commitments, including multi-year cloud and infrastructure purchase agreements, demonstrating significant progress in securing long-term capacity. |
B. Current Quarter Focus Items
The following table outlines the key non-guidance metrics and developments to monitor in the upcoming quarters.
| Category | Item | Timeline | What to Monitor | Why It Matters |
|---|---|---|---|---|
| Risk | CapEx Inflation & Supply Chain Pressure | FY 2026 | Any further increases to the $125B–$145B CapEx guidance or specific commentary on component cost trends, particularly for memory and other critical AI hardware. | Management explicitly cited "higher component pricing" as the primary reason for raising CapEx guidance. This introduces a tangible external risk that could further pressure free cash flow and challenge the ROI of the infrastructure build-out. |
| Strategic | Execution of Contractual Commitments | Ongoing / Multi-Year | The financial impact of the $107B step-up in commitments, including how these off-balance-sheet obligations translate into on-balance-sheet assets and operating expenses (e.g., cloud spend, depreciation) in future periods. | This massive, long-term commitment locks the company into an aggressive spending trajectory far beyond a single year's budget. Its execution will dictate Meta's operational capacity and financial profile for years to come. |
| Operational | Impact of Planned Headcount Reduction | Q2 2026 ("May") | The scale and scope of the announced layoffs and any subsequent impact on key project velocity, employee morale, and operating expense run-rates. | This is a significant efficiency measure intended to offset massive infrastructure spending. Its successful execution is critical to management's goal of creating a "leaner operating model" without disrupting progress on key AI and monetization initiatives. |
| Opportunity | Meta AI Adoption & Engagement | Next 1-2 Quarters | Sustained growth in user adoption and engagement metrics for the upgraded Meta AI assistant following the MuSpark launch. Monitor for specific user numbers, session growth, and signs of product-market fit. | With the first advanced model now deployed, the key success metric shifts from technical capability to achieving scaled product adoption. This is the critical prerequisite for the long-term monetization strategy of building a leading personal AI assistant. |
| Strategic | Evolution of AI Monetization Framework | Ongoing | Any management commentary on potential monetization models for AI agents, such as premium subscriptions, API access, or transaction-based fees, and the timeline for initial testing. | The core investor concern remains the lack of a clear, near-term monetization plan for the massive AI spend. Any signal that the company is moving from a "scale first" to a "test monetization" phase would be a major strategic inflection point. |
Appendix: Quotes by Theme
-
The "Personal Super Intelligence" Vision: Differentiating Meta's Mission from the Industry Management articulated a distinct, human-centric vision for AI, positioning it as a tool for individual empowerment rather than centralized productivity, a consistent theme that was given sharper philosophical framing this quarter.
"My view of AI is very different from many others in the industry. I hear a lot of people out there talk about how AI is going to replace people. Instead, I think that AI is going to amplify people's ability to do what you want... My view is that human progress has always been driven by people pursuing their individual aspirations... People will be more important in the future, not less. Meta believes in empowering individuals." — Mark Zuckerberg, CEO
vs. Q4-FY25 (Vision Introduced):
"Our vision is building personal superintelligence. We're starting to see the promise of AI that understands our personal context, including our history, our interests, our content, and our relationships." — Mark Zuckerberg, CEO
-
The Investment Cycle Remains Uncapped: Acknowledging a Consistent Underestimation of Compute Needs Management reinforced the open-ended nature of the investment cycle, evolving its language from being "capacity constrained" to explicitly stating a pattern of underestimating its long-term needs, signaling that spending will likely remain elevated.
"Our experience so far has been that we have continued to underestimate our compute needs even as we have been ramping capacity significantly... our expectation is that compute will become even more central to the business going forward." — Susan Li, CFO
vs. Q4-FY25 (Framed as "Capacity Constrained"):
"We do continue to be capacity constrained." — Susan Li, CFO (Q&A)
-
Managing Expectations on AI Product Timelines: A Shift from Anticipation to Patience and Quality Following the first major model release, the narrative shifted from building anticipation for the launch to managing expectations for the next wave of products, emphasizing a focus on quality over speed.
"I think some of the stuff we are more focused on quality than hitting a specific date... there aren't that many that I would want to give to my mother. And I think getting to like that quality bar is something that I care about more than hitting a specific week for launching or something like that... the picture is going to come into focus a lot more over the subsequent quarters." — Mark Zuckerberg, CEO (Q&A)
vs. Q4-FY25 (Building Anticipation for Upcoming Launches):
"I have to say upfront that I think my answers to a lot of your questions on this particular call may be somewhat unfulfilling... over the coming months, we're going to start shipping our new models and products... I expect our first models will be good, but more importantly, we'll show the rapid trajectory that we're on." — Mark Zuckerberg, CEO
-
Analyst Scrutiny Intensifies on ROI: The Central Question Persists With the initial AI model now released, analyst focus sharpened from the path to building the model to the financial justification and "signposts" for the massive investment. Management's response remained consistent with its long-term playbook: scale first, monetize later.
"I wanted to ask you just about the level of investment you're making in sort of the signposts you're watching to ensure you're going to generate ROIC... what are you sort of watching foremost just to make sure that you're on the right path to generating healthy ROIC on all this CapEx and infrastructure spend?" — Brian Nowak, Analyst (Morgan Stanley)
Management's Response:
"The formula for our company has always been build experiences that can get to billions of people and focus on monetizing them once you get to scale... I don't think we have a very precise plan for exactly how each product is going to scale month-over-month or anything like that. But I think we have a sense of the shape of where these things need to be." — Mark Zuckerberg, CEO (Q&A)
-
Efficiency as a Counter-Narrative: Offsetting the Spend with a "Leaner" Model (New Theme) Management introduced a significant new efficiency initiative, explicitly linking a planned headcount reduction to the need to offset its massive infrastructure investments and increase operational speed.
"As we grow our infrastructure spend, we remain committed to operating efficiently, and we recently shared internally that we plan to reduce the size of our employee base in May. We believe a leaner operating model will allow us to move more quickly while also helping to offset the substantial investments we're making." — Susan Li, CFO
-
Hardware Inflation Emerges as a Tangible Headwind (First Mentioned This Quarter) For the first time, management explicitly cited supply chain inflation as a primary driver for raising its CapEx guidance, introducing a new external risk factor to its financial model.
"We are increasing our infrastructure CapEx forecast for this year. Most of that is due to higher component costs, particularly memory pricing..." — Mark Zuckerberg, CEO
-
The Locked-In Nature of the Investment: A Massive Step-Up in Long-Term Commitments The disclosure of a $107B increase in contractual obligations reveals the multi-year, locked-in scale of the investment strategy, which extends far beyond the annual CapEx budget and represents a significant escalation from prior partnership announcements.
"These multiyear cloud deals and our infrastructure purchase agreements drove a $107 billion step-up in our contractual commitments this quarter." — Susan Li, CFO
vs. Q4-FY25:
"Dina Powell McCormick also joined us as president and vice chairman. She will lead our efforts to partner with governments, sovereigns, and strategic capital partners to expand our long-term capacity..." — Mark Elliot Zuckerberg, CEO
-
Confidence in the Core Engine's Runway: A Consistent Message of Sustained Innovation Management expressed continued confidence in its ability to drive further engagement and monetization from its core apps, reiterating a consistent and detailed roadmap for improving its recommendation systems, which are critical to funding the long-term AI vision.
"First of all, there is still a lot of room to continue improving recommendations over the rest of the year... we're going to continue to improve our data infrastructure... We also are focused on making the recommendations even more personalized... And then finally, we're continuing to make improvements to our sort of LLM based tuning algorithm features..." — Susan Li, CFO (Q&A)
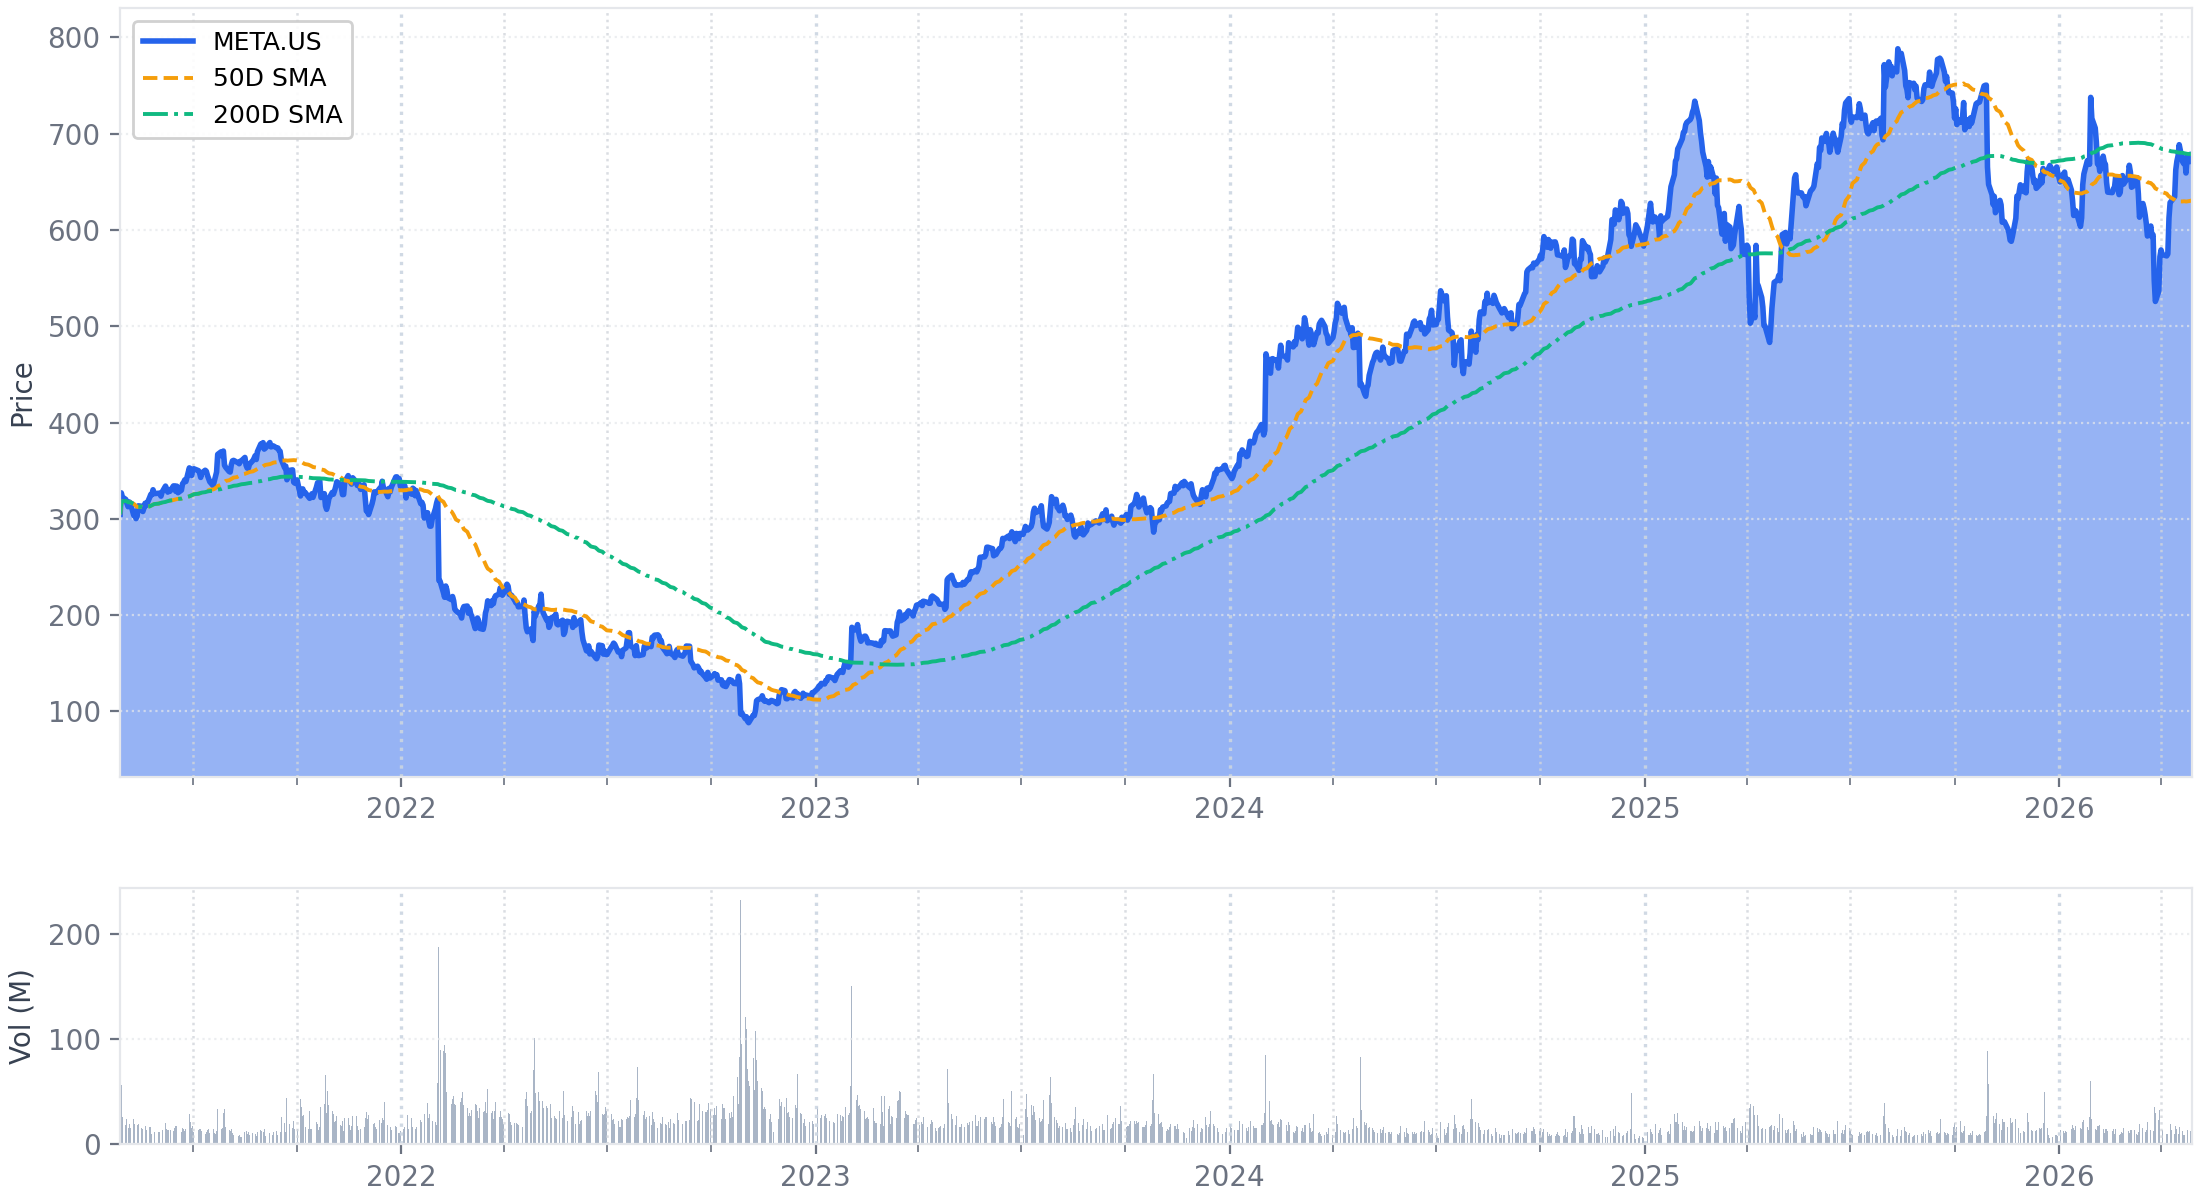
Historical Performance