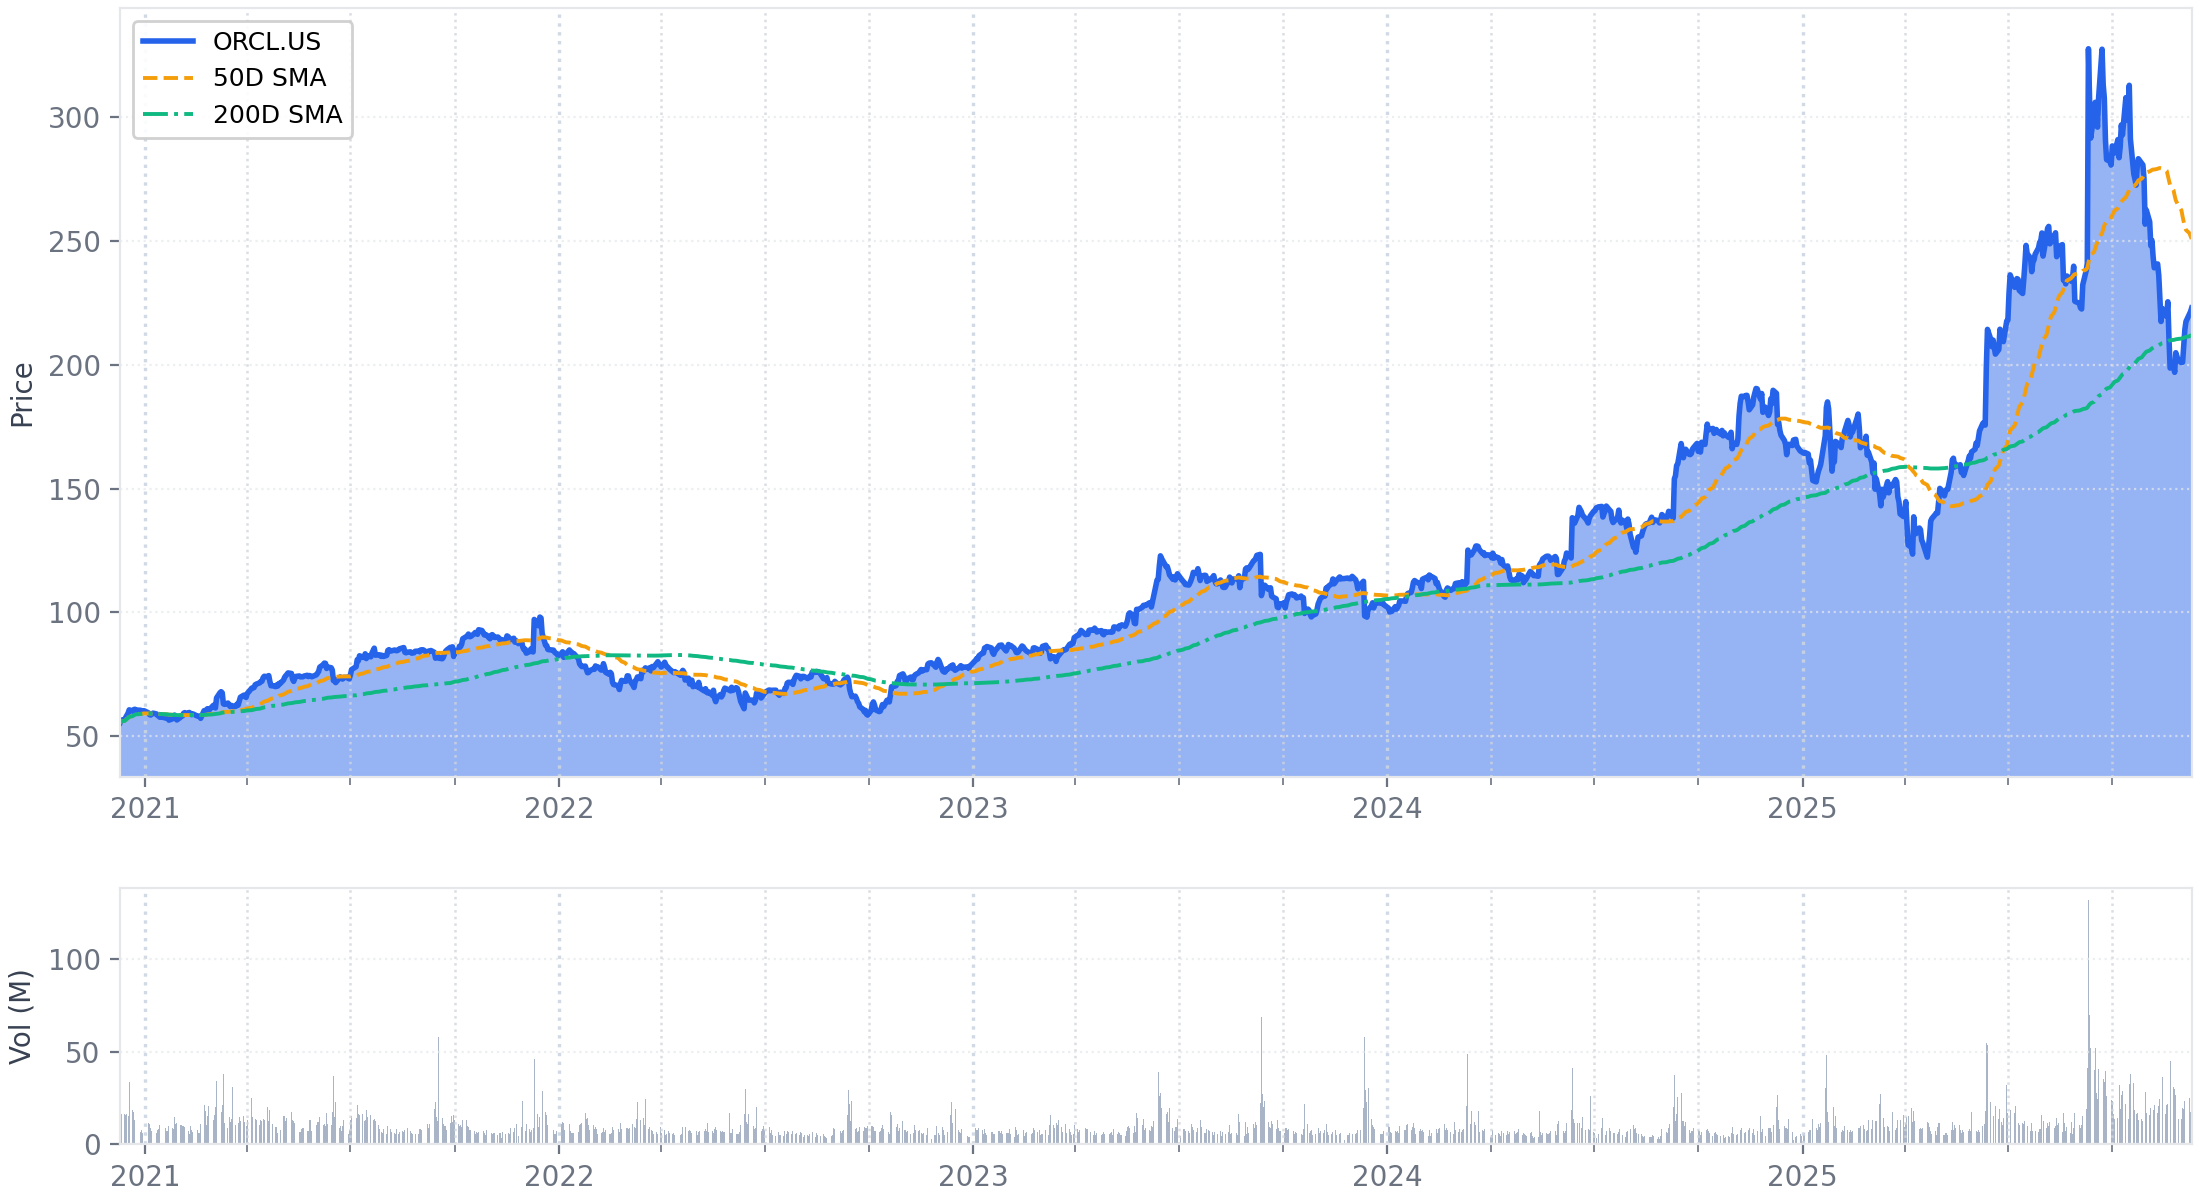
Executive Summary
Oracle's Q2 results significantly beat earnings guidance, driven primarily by a one-time gain, while underlying business momentum continued to accelerate. Total revenue grew 13% in constant currency to $16.1 billion, meeting the high end of guidance. Non-GAAP EPS of $2.26 substantially beat the $1.61-$1.65 forecast, an outperformance largely attributable to a $2.7 billion pre-tax gain from the sale of its interest in Ampere.
Operationally, the company's AI-driven demand soared, with Cloud Infrastructure (IaaS) revenue growth accelerating to 66% CC. This translated into another monumental increase in the backlog, as Remaining Performance Obligations (RPO) grew by $68 billion sequentially to $523.3 billion, fueled by new large-scale contracts. The sale of Ampere also marked a major strategic pivot to "chip neutrality," positioning Oracle as a hardware-agnostic cloud provider.
To support this historic backlog, management again raised its FY2026 CapEx forecast by $15 billion to approximately $50 billion. This aggressive investment cycle deepened the cash burn, with quarterly free cash flow deteriorating to negative $10.0 billion. Guidance for Q3 points to further acceleration, with revenue growth projected at 16-18% CC. The investment thesis now hinges on Oracle's ability to execute this unprecedented capital deployment and convert its massive, secured backlog into profitable revenue.
1. Financial Performance Summary
Oracle reported Q2 FY2026 results that beat guidance, driven by a significant one-time gain and continued momentum in its cloud infrastructure business. Total revenue grew 13% in constant currency (CC) to $16.1 billion, meeting the high end of the +12% to +14% CC guidance range issued in the prior quarter. The key highlight was Non-GAAP EPS of $2.26, which substantially beat the guided range of $1.61 to $1.65. This outperformance was primarily due to a $2.7 billion pre-tax gain from the sale of the company's interest in Ampere, a factor not included in the original guidance.
Cloud infrastructure (IaaS) revenue growth accelerated to 66% in constant currency, while Remaining Performance Obligations (RPO) surged 438% year-over-year to $523.3 billion, reflecting new large-scale commitments from customers including Meta and NVIDIA.
A. Income Statement Metrics
| Metric (Non-GAAP unless noted) | Q2 FY2026 | Q2 FY2025 | Change (CC) | Change (USD) | Notes |
|---|---|---|---|---|---|
| Total Revenue | $16.06B | $14.06B | +13% | +14% | Met guidance of +12% to +14% CC. |
| Cloud Revenue | $7.98B | $5.94B | +33% | +34% | Met guidance of +32% to +36% CC. |
| - Cloud Infrastructure (IaaS) | $4.08B | $2.43B | +66% | +68% | Represents an acceleration from 54% CC growth in Q1. |
| - Cloud Application (SaaS) | $3.90B | $3.50B | +11% | +11% | Growth accelerated from 10% CC in Q1. |
| Software Revenue | $5.88B | $6.06B | -5% | -3% | |
| Hardware Revenue | $0.78B | $0.73B | +5% | +7% | |
| Services Revenue | $1.43B | $1.33B | +6% | +7% | |
| Operating Income (GAAP) | $4.73B | $4.22B | +9% | +12% | |
| Operating Income (Non-GAAP)[1] | $6.72B | $6.10B | +8% | +10% | |
| Net Income (GAAP) | $6.14B | $3.15B | +89% | +95% | Includes a $2.7B pre-tax gain from the sale of interest in Ampere. |
| Net Income (Non-GAAP) | $6.60B | $4.21B | +54% | +57% | Also includes the gain from the sale of interest in Ampere. |
| Diluted EPS (GAAP) | $2.10 | $1.10 | +86% | +91% | Includes Ampere sale gain. |
| Diluted EPS (Non-GAAP)[2] | $2.26 | $1.47 | +51% | +54% | Beat guidance of $1.61 - $1.65 USD. The beat was driven by the gain from the Ampere sale, which was not in the original guidance. |
Footnotes
- Non-GAAP Operating Income Reconciliation: GAAP Operating Income of $4,731M excludes stock-based compensation ($1,156M), amortization of intangible assets ($407M), acquisition-related expenses ($21M), and restructuring costs ($406M). Total adjustments of $1,990M represent 42.1% of GAAP Operating Income.
- Non-GAAP EPS Reconciliation: GAAP EPS of $2.10 reflects adjustments for stock-based compensation, amortization of intangibles, acquisition-related expenses, restructuring costs, and related income tax effects. The $2.7B pre-tax gain from the Ampere sale was included in both GAAP and Non-GAAP results.
B. Balance Sheet Highlights
| Metric | Nov 30, 2025 | May 31, 2025 | Change (Since FYE) | Notes |
|---|---|---|---|---|
| Cash & Marketable Securities[1] | $19.77B | $11.20B | +76.4% ↑ | Cash position increased significantly, aided by proceeds from the Ampere sale and debt issuance. |
| Total Debt[2] | $124.39B | $104.10B | +19.5% ↑ | Total debt increased due to new senior note issuances during the period. |
| - Notes Payable & Borrowings | $108.08B | $92.57B | +16.8% ↑ | |
| - Operating Lease Liabilities | $16.31B | $11.54B | +41.4% ↑ | Increase reflects expansion of data center footprint. |
| Net Debt[3] | $104.62B | $92.90B | +12.6% ↑ | Net debt increased despite higher cash balances due to a larger increase in total debt. |
| Short-term Deferred Revenues | $9.94B | $9.39B | +5.9% ↑ | |
| Stockholders' Equity | $30.46B | $20.97B | +45.2% ↑ |
Footnotes
- Cash & Marketable Securities: Calculated as Cash and cash equivalents + Marketable securities. Q2 FY26: $19,241M + $525M = $19,766M. FYE 2025: $10,786M + $417M = $11,203M.
- Total Debt: Calculated as Notes payable and other borrowings (current + non-current) + Operating lease liabilities (non-current). Q2 FY26: $8,091M + $99,984M + $16,311M = $124,386M. FYE 2025: $7,271M + $85,297M + $11,536M = $104,104M.
- Net Debt: Calculated as Total Debt - Cash & Marketable Securities. Q2 FY26: $124,386M - $19,766M = $104,620M. FYE 2025: $104,104M - $11,203M = $92,901M.
C. Cash Flow Analysis
For the first six months of FY2026, Oracle's cash flow reflects its aggressive investment phase to support massive RPO growth. Capital expenditures of $20.5 billion far outpaced operating cash flow, resulting in a negative free cash flow of $10.3 billion year-to-date. Management noted that Q2 operating cash flow was $2.1 billion against CapEx of $12.0 billion, leading to a negative free cash flow of approximately $10.0 billion for the quarter alone.
| Metric | Six Months Ended Nov 30, 2025 | Six Months Ended Nov 30, 2024 | Change (YoY) | Notes |
|---|---|---|---|---|
| Operating Cash Flow | $10.21B | $8.73B | +16.9% ↑ | |
| Capital Expenditures | ($20.54B) | ($6.27B) | +227.4% ↑ | Reflects significant investment in data center capacity to support new AI contracts. |
| Free Cash Flow (GAAP)[1] | ($10.33B) | $2.46B | -520.3% ↓ | The substantial cash burn is a direct result of upfront investments to service the large RPO backlog. |
| Dividend Payments | ($2.85B) | ($2.22B) | +28.3% ↑ | Dividend maintained at $0.50 per share. |
| Share Repurchases/Issuances (Net)[2] | $1.10B | ($891M) | N/A | The company was a net issuer of stock, primarily from employee stock plans. |
| Debt Repayments/Issuances (Net)[3] | $16.64B | $1.74B | +856.0% ↑ | Net issuance reflects financing activities to fund capital expenditures. |
Footnotes
- Free Cash Flow (GAAP): Calculated as Net cash provided by operating activities - Capital expenditures. YTD FY26: $10,206M - $20,535M = ($10,329M). YTD FY25: $8,731M - $6,273M = $2,458M.
- Share Repurchases/Issuances (Net): Calculated from financing activities. YTD FY26: Proceeds from issuances ($1,308M) - Payments for repurchases ($95M) - Shares repurchased for tax withholdings ($109M) = $1,104M. YTD FY25: $307M - $300M - $898M = ($891M).
- Debt Repayments/Issuances (Net): Calculated from financing activities. YTD FY26: Proceeds from issuances ($17,880M) + Net proceeds from commercial paper ($886M) - Repayments ($2,122M) = $16,644M.
D. Key Financial Ratios
| Metric | Q2 FY2026 | Q2 FY2025 | Change (bps) | Notes |
|---|---|---|---|---|
| GAAP Operating Margin | 29.5% | 30.0% | -50 bps ↓ | Margin compression reflects higher operating expenses related to cloud build-out. |
| Non-GAAP Operating Margin | 41.8% | 43.3% | -150 bps ↓ | |
| GAAP Net Margin | 38.2% | 22.4% | +1,580 bps ↑ | Margin expansion driven by the $2.7B pre-tax gain from the Ampere sale. |
| Non-GAAP Net Margin | 41.1% | 29.9% | +1,120 bps ↑ |
Footnotes
- Ratios are calculated based on data from the Income Statement table in Section 1.A.
E. Operational Metrics
| Metric | Q2 FY2026 | Change (YoY) | Notes |
|---|---|---|---|
| Total RPO | $523.3B | +433% | Increased by $68B sequentially from Q1. Driven by new contracts with Meta, NVIDIA, and others. |
| Current RPO (next 12 months) | — | +40% | Growth accelerated from 25% in the prior quarter. |
| IaaS Growth Metrics (CC) | |||
| GPU-related Revenue Growth | — | +177% | |
| Cloud Database Services Revenue Growth | — | +30% | |
| Autonomous Database Revenue Growth | — | +43% | |
| Multi-cloud Consumption Growth | — | +817% | |
| SaaS Growth Metrics (CC) | |||
| Strategic Back-office Apps Revenue Growth | — | +16% | Growth rate consistent with Q1. |
| Fusion ERP Revenue Growth | — | +17% | |
| NetSuite ERP Revenue Growth | — | +13% | |
| Industry Cloud Apps (Combined) Revenue Growth | — | +21% | |
| Operational Scale | |||
| Cloud Regions (Live) | 147 | — | 64 more regions are planned. |
| Cloud App Go-Lives | 330 | — | Represents multiple customer go-lives per day during the quarter. |
2. Forward-Looking Guidance
Oracle provided guidance for Q3 and updated its full-year outlook for capital expenditures and FY2027 revenue, reflecting the impact of the substantial increase in its RPO backlog. The company anticipates a significant acceleration in revenue growth for the upcoming quarter but maintained its full-year FY2026 revenue target. A notable change was the decision to increase the FY2026 CapEx forecast by $15 billion to support the accelerated build-out of data center capacity.
A. Guidance Summary
| Metric | Period | Current Guidance | Prior Guidance (from Q1 FY26 Call) | Change | Management Commentary |
|---|---|---|---|---|---|
| Total Revenue Growth (CC) | Q3 FY2026 | +16% to +18% | N/A | Introduced | Represents a significant acceleration from Q2's 13% growth. |
| Total Cloud Revenue Growth (CC) | Q3 FY2026 | +37% to +41% | N/A | Introduced | Implies continued strong momentum in cloud infrastructure and applications. |
| Non-GAAP EPS (USD) | Q3 FY2026 | $1.70 - $1.74 | N/A | Introduced | Represents 16% to 18% growth in USD. |
| Total Revenue | FY2026 | $67B | $67B (implied from 16% growth) | Maintained | "Our full-year FY 2026 revenue expectation of $67 billion remains unchanged." |
| Capital Expenditures | FY2026 | ~$50B[1] | "around $35 billion" | Raised | "We now expect fiscal 2026 CapEx will be about $15 billion higher than we forecasted after Q1." |
| Total Revenue (Incremental) | FY2027 | +$4B | N/A | Introduced | "We now expect $4 billion of additional revenue in FY 2027" due to faster conversion of the new RPO backlog. |
Footnotes
- Calculated figure: Prior guidance of ~$35B + $15B increase = ~$50B.
B. Additional Notes & Commentary
- Currency Impact (Q3 FY2026): Management anticipates a 2% to 3% positive effect on revenue and a 6¢ positive effect on EPS, assuming current exchange rates.
- RPO Conversion: The new RPO booked in Q2 is expected to convert to revenue sooner than typical contracts because it relates to opportunities where "we have near-term capacity available."
- Capital & Profitability Discipline: Management emphasized a disciplined approach to expansion, stating they will "pursue further business expansion, only when it meets our profitability requirements, and the capital is available on favorable terms."
- Financing Strategy: To fund growth, management highlighted multiple options beyond public debt, including customers bringing their own chips and suppliers leasing chips, which would "synchronize our payments with our receipts and borrow substantially less than most people are modeling."
- Investment Grade Rating: The company reaffirmed its commitment to maintaining its investment-grade debt rating.
3. Operational & Strategic Developments
Oracle's Q2 was marked by an acceleration in its infrastructure build-out, a strategic pivot towards enabling enterprise AI on private data, and a significant reorganization of its applications sales force. The company secured massive new contracts that swelled its backlog, while simultaneously outlining a more flexible capital strategy to fund the required expansion.
A. Business Performance & Operations
- Leadership Presentation: The Q2 earnings call featured a notable change in executive participation. The call was led by Co-CEOs Mike Sicilia and Clay Magouyrk, along with Principal Financial Officer Doug Kehring. This differs from prior calls, including Q1, which were led by CEO Safra Catz.
- Accelerating Capacity Delivery: OCI revenue growth accelerated to 66% CC, supported by a significant ramp-up in capacity. The company handed over close to 400 megawatts of data center capacity and 50% more GPU capacity in Q2 than in Q1.
- Cloud Applications Reorganization: Management completed a major sales reorganization, combining its industry-specific and Fusion application sales teams into a single "One Oracle" organization to drive cross-selling synergies. Cloud Applications revenue grew 11% CC, and deferred revenue for the segment grew 14%, supporting management's expectation for continued acceleration.
- Multi-Cloud Expansion: The multi-cloud footprint expanded to 45 live regions across AWS, Azure, and GCP, with 27 more planned. Consumption grew 817% YoY, and new programs were launched to accelerate adoption.
B. Strategic Initiatives
- Primary Initiative: Enterprise AI on Private Data: CTO Larry Ellison detailed a strategy focused on enabling AI models to perform multi-step reasoning on customers' private enterprise data. This is delivered through the "Oracle AI Data Platform," which unifies and vectorizes data from Oracle and third-party sources, making it accessible to leading AI models available in the Oracle Cloud. Management views this market as potentially "larger and more valuable" than AI training.
- Flexible Capital & Financing Strategy: In response to questions about the capital required for its build-out, management outlined several financing models beyond direct cash purchases. These include arrangements where customers bring their own chips and models where suppliers lease chips to Oracle, which are designed to better synchronize payments with revenue and reduce upfront capital needs.
- Ecosystem and Partnership Expansion: The company continues to enrich its platform by expanding partnerships. Marketplace consumption grew 89% year-over-year, and Oracle added new AI models from Google, OpenAI, and xAI to its cloud, reinforcing its position as a neutral platform.
- Product Miniaturization and Alloy Program: The company launched "Dedicated Region 25," a full OCI environment in a compact three-rack footprint. Consumption for Dedicated Region and Alloy grew 69% year-over-year.
C. Risk Factors & Headwinds
- Financial Health - Deepening Negative Free Cash Flow (Persistent & Worsening): The company's aggressive investment cycle has led to a significant cash burn. Free cash flow for Q2 was negative $10.0 billion, driven by $12.0 billion in capital expenditures. Year-to-date free cash flow stands at negative $10.3 billion. To fund this expansion, total debt has increased significantly, reaching $124.4 billion (including operating leases).
- Operational Challenges - Execution at Unprecedented Scale (Persistent & Heightened): The central risk remains the ability to execute an unprecedented infrastructure build-out. The FY2026 CapEx forecast was raised by $15 billion to approximately $50 billion. Successfully managing supply chains and construction at this scale is critical.
- Infrastructure Fungibility: An analyst raised the issue of risk associated with a large customer potentially being unable to pay. Management stated that its AI infrastructure is standard and can be securely re-provisioned to another customer in "a matter of hours." They believe strong demand from over 700 AI customers mitigates this risk.
4. Q&A Session Key Themes
The Q&A session focused on the financial and operational mechanics of Oracle’s massive infrastructure expansion. Analysts shifted to more granular questions aimed at understanding the capital intensity, profitability, and risk profile of the new business model.
A. Analyst Focus Areas
- Capital Intensity and Financial Model for AI Build-Out: This was the most prominent theme, with analysts seeking to understand the capital required to fund the RPO backlog and the underlying cash flow dynamics. Management responded by detailing its flexible financing strategy, including customer-supplied and supplier-leased hardware, stating they expect to need "substantially less" capital than the $100 billion+ some analysts had modeled.
- Path to OCI Profitability: Analysts drilled down on the margin profile of the new AI business. Management stated the key driver for achieving its 30-40% gross margin target is the overall mix of operational versus in-progress data centers. The fastest way to improve aggregate margins is to "deliver capacity faster."
- Cloud Applications Growth Confidence: An analyst questioned the basis for management's confidence in accelerating applications growth. Management cited its integrated suite strategy, an "AI halo effect," the completed "One Oracle" sales reorganization, and deferred revenue for the segment growing faster than recognized revenue as key drivers.
B. Key Challenges & Concerns
- Execution and Financial Risk at Unprecedented Scale: The central underlying concern among investors is the financial viability and operational feasibility of Oracle's plan. Questions regarding capital needs, cash flow models, margin ramps, and customer default risk all point to a deep-seated concern about executing a historic, capital-intensive build-out without compromising financial health.
- Margin Pressure & Profitability Ramp: The primary question on margins revolved around the timeline to achieve targeted profitability. Management tied margin performance directly to operational execution speed, clarifying that profitability is a function of how quickly they can bring their large-scale data centers online.
- Balance Sheet Risk: The significant financial strain from the massive capital investment cycle, reflected in the deep negative free cash flow, was a key concern. Management sought to mitigate these concerns by detailing its flexible financing models and the fungibility of its infrastructure, while also committing to maintaining its investment-grade debt rating.
5. Strategic Themes & Inflection Points
Oracle's Q2 call marked a shift from the demand-centric narrative of the prior quarter to a pragmatic focus on execution, financing, and strategic positioning. The tone evolved from astonishment at the scale of new business to a detailed operational roadmap for delivering on it.
A. Current Period Themes
- Dominant Narratives: The primary story has matured from securing unprecedented demand to executing the build-out and managing the capital intensity. Two new, significant narratives emerged:
- Flexible Capital Strategy: Management introduced a multi-faceted approach to funding its expansion, including customer-supplied and supplier-leased hardware, to mitigate the cash burn from its massive CapEx plan.
- Strategic Pivot to "Chip Neutrality": The sale of its interest in Ampere signals a deliberate move away from vertical integration in silicon, positioning Oracle as an agile, neutral platform that can deploy any CPU or GPU its customers demand.
- Operational Focus: The singular priority is accelerating data center capacity delivery, underscored by the decision to raise the FY2026 CapEx forecast by another $15 billion to approximately $50 billion. A secondary focus is the completed reorganization of the applications sales force, which is now expected to drive cross-selling and accelerate SaaS growth.
- Changes in Messaging and Tone: The tone shifted from the "shock" of the Q1 RPO surge to a more operational and financially-grounded discussion. The enterprise AI strategy, centered on the "AI Data Platform," was articulated with significantly more clarity than the "AI Database" concept introduced in Q1.
B. Future Considerations
- Emerging Opportunities: The core emerging opportunity remains the monetization of the AI Data Platform to unlock the enterprise AI market on private data. The new multi-cloud universal credits and reseller programs are designed to further accelerate database adoption within competitor clouds.
- External Environment: Oracle is actively reinforcing its position as a neutral utility for the AI ecosystem. The "chip neutrality" policy and support for all major AI models position OCI as an agnostic platform.
- Transformation Initiatives: The company’s transformation into a capital-intensive, hyper-growth infrastructure provider is accelerating, with negative free cash flow deepening to -$10.0 billion for the quarter. The introduction of flexible financing models is a critical initiative to manage the financial strain of this phase.
- Comparison with Prior Periods: The sale of Ampere represents a material pivot from the company's long-standing strategy of vertical integration. The explicit discussion of financing options beyond debt is also a new element, directly addressing investor concerns about the massive cash burn.
6. Key Items to Monitor Next Quarter
A. Prior Quarter Monitoring Review
| Prior Item | Current Status | Management Commentary |
|---|---|---|
| Execution of ~$35B CapEx Plan & RPO Conversion | On Track / Upgraded | The plan was significantly expanded. Management raised the FY2026 CapEx forecast by $15 billion to approximately $50 billion to support an accelerated conversion of its massive RPO backlog into revenue. |
| Adoption and Impact of the "Oracle AI Database" | On Track | The strategy was further detailed and rebranded as the "Oracle AI Data Platform." Management emphasized it is a key differentiator for enabling AI on private enterprise data, stating "All our database and application customers want to do this." |
| Sustainability of RPO Growth Post-Q1 Surge | Achieved | Oracle demonstrated continued momentum by adding another $68 billion in RPO sequentially, bringing the total to $523.3 billion. This was driven by new large contracts with customers including Meta and NVIDIA. |
| Multi-Cloud Database Revenue Trajectory | On Track | Growth remains exceptionally strong, with multi-cloud consumption reported at +817% YoY. The company expanded its footprint to 45 live regions and launched new programs to accelerate customer adoption. |
| Path to Positive Free Cash Flow Amidst Peak Investment | Delayed | The cash burn intensified significantly, with Q2 free cash flow at negative $10.0 billion. In response, management introduced a new flexible financing strategy (e.g., customer-supplied chips) to mitigate future cash burn. |
B. Current Quarter Focus Items
| Category | Item | Timeline | What to Monitor | Why It Matters |
|---|---|---|---|---|
| Risk | Execution of ~$50B CapEx Plan & Cash Flow Management | FY2026 (Ongoing) | The quarterly CapEx run-rate against the new ~$50B annual forecast and the resulting quarterly free cash flow figure. Any updates on the mix of financing models being utilized. | The entire investment case hinges on executing this massive build-out, now with an even higher capital forecast. The ability to manage the deep negative free cash flow is critical to maintaining financial stability. |
| Strategic | Effectiveness of Flexible Financing Models | Next 1-2 Quarters | Specific deals or commentary confirming the use of customer-supplied hardware or supplier-leasing models. Quantification of the impact of these models on CapEx or cash flow. | This new strategy is Oracle's primary mechanism to mitigate the immense cash burn from its build-out. Its success is essential to fund growth without overly stressing the balance sheet and to validate management's claim of needing to borrow "substantially less" than modeled. |
| Opportunity | Cloud Applications Re-acceleration Post-Reorg | Next Quarter | The growth rate of Cloud Applications revenue versus the 11% reported in Q2. The growth trend in Cloud Applications deferred revenue (14% in Q2) as a leading indicator. | Management has high confidence that the completed "One Oracle" sales reorganization will drive growth. Demonstrating acceleration would validate the strategy and prove a key growth driver outside of the OCI narrative. |
| Strategic | Impact of "Chip Neutrality" Strategy | Ongoing | Announcements of new large customer wins leveraging non-NVIDIA hardware (e.g., AMD). Commentary on how this strategy is influencing win rates against competitors. | The sale of Ampere and pivot to being hardware-agnostic is a major strategic shift. It positions Oracle as a more flexible partner, which could attract a wider range of AI clients and de-risk its supply chain. |
| Operational | OCI Gross Margin Trajectory | Ongoing | Any management commentary on OCI gross margins. The velocity of new capacity delivery (e.g., megawatts per quarter) and the mix between operational versus in-progress data centers. | With CapEx surging, investors are focused on the path to profitability for the new infrastructure. Management has tied margin improvement directly to the speed of execution in bringing new, high-margin AI data centers online. |
Appendix: Quotes by Theme
-
Emergence of a Flexible Capital Strategy to Mitigate Cash Burn: In response to heightened analyst concerns over capital intensity, management introduced a multi-faceted financing strategy for its massive build-out, moving beyond traditional debt and cash to models that better align payments with revenues. This was a new, significant theme this quarter.
"We have some other interesting models that we've been working on. One of them is that customers can actually bring their own chips. And in those models, Oracle obviously doesn't have to incur any capital expenditures... Similarly, we have different models... where some vendors are actually very interested in a model where they rent their capacity rather than selling their capacity." — Clay McGork, CEO
- vs Q1-FY26 (Focus was on the scale of CapEx, not the financing model):
"Given our RPO growth, I now expect fiscal year 2026 CapEx will be around $35 billion." — Safra Catz, CEO
-
Strategic Pivot to "Chip Neutrality" with Ampere Divestiture: Oracle announced the sale of its interest in Ampere, marking a significant strategic shift away from vertical integration in silicon toward an agnostic, customer-centric hardware strategy.
"Oracle sold Ampere because we no longer think it is strategic for us to continue designing, manufacturing and using our own chips in our cloud datacenters. We are now committed to a policy of chip neutrality where we work closely with all our CPU and GPU suppliers." — Lawrence Ellison, Chairman and CTO
-
Heightened Confidence in Cloud Applications Re-acceleration: Management expressed strong conviction that its Cloud Applications business would accelerate, citing the completion of a major sales reorganization and leading indicators like deferred revenue growth. This addresses the slight moderation in SaaS growth seen in the prior quarter.
"Deferred revenue for apps growing at 14% now. You know, faster than the in-quarter revenue growth of 11%. For all those reasons, I'm optimistic on our apps business going forward... We're on the back end of a sales reorg that was focused on unified selling, across our applications portfolio." — Mike Cecilia, CEO
- vs Q1-FY26 (Acknowledging slightly slower growth in the segment):
"Cloud application revenue was $3.8 billion, up 10%, while our strategic back-office application revenue was $2.4 billion, up 16%." — Safra Catz, CEO
-
Shift from Securing Demand to Executing at Unprecedented Scale: The operational narrative evolved from the Q1 focus on the historic RPO bookings to a Q2 emphasis on the massive, tangible delivery of data center capacity, demonstrating execution against the backlog.
"In the last quarter, we handed over close to 400 megawatts of data center capacity to our customers. We also delivered 50% more GPU capacity this quarter than Q1." — Clay McGork, CEO
- vs Q1-FY26 (Focus was on the speed of a single project and the scale of new contracts):
"We just turned over a giant data hall to one of our customers. And the acceptance time... was one week... At the end of Q1, remaining performance obligations or RPO now top $455 billion." — Lawrence Ellison, Chairman and CTO & Safra Catz, CEO
-
Refinement of Enterprise AI Strategy from "Database" to "Platform": Management's messaging around its key enterprise AI initiative evolved, broadening from the "AI Database" concept in Q1 to a more comprehensive "AI Data Platform" that unifies all enterprise data sources for AI reasoning.
"The Oracle AI data platform makes all your data accessible to AI models not just Oracle databases... data from other databases. Cloud storage from any cloud... Using our AI data platform, you can unify all your data and reason on all of your data using the very latest AI models." — Lawrence Ellison, Chairman and CTO
- vs Q1-FY26 (The concept was introduced as the "Oracle AI Database"):
"With the introduction of our new AI database, we added a very important new way for you to store your data in our database. You can vectorize it... then we made it very easy for our customers to directly connect all their databases... to the world's most advanced AI reasoning models." — Lawrence Ellison, Chairman and CTO
-
Clarifying the Path to OCI Profitability: When pressed on the timeline to reach target margins for AI workloads, management clarified that profitability is not a function of time but of execution velocity—specifically, the mix of operational versus in-progress data centers.
"What actually matters much more is the overall mix of the data centers that we have online... the best way to improve margins quickly, is to actually go out and deliver capacity faster. That ends up very rapidly ensuring that we get to that 30 to 40% gross margin profile." — Clay McGork, CEO
-
Analyst Focus Shifts from Awe at Demand to Scrutiny of Financial Viability: The tone of analyst questions evolved distinctly from Q1, where they were "blown away" by the RPO numbers, to a more focused and pragmatic inquiry in Q2 on the capital required to fund the growth and the underlying financial model.
"Oracle is clearly the destination of choice for the most sophisticated AI customers but this is a far more capital-intensive proposition... Very specifically, how much money does Oracle need to raise to fund its AI growth plans ahead?" — Brad Zelnick, Analyst (Q2-FY26)
- vs Q1-FY26 (Analyst tone was one of astonishment):
"Listen. Even I am sort of blown away by what this looks like going forward... this is a career event happening right now, and it looks it's just amazing." — John DiFucci, Analyst
-
Addressing Customer Concentration Risk with Infrastructure Fungibility: For the first time, management directly addressed the operational risk of a large customer default on a dedicated data center, emphasizing the standardized and fungible nature of its cloud infrastructure.
"When you ask the question of, well, how long does it take to transfer capacity from one customer to another? It's on the order of hours... we have a customer base of a lot of demand such that whenever we find ourselves with capacity that's not being used, it very quickly gets allocated and provisioned." — Clay McGork, CEO
Historical Performance