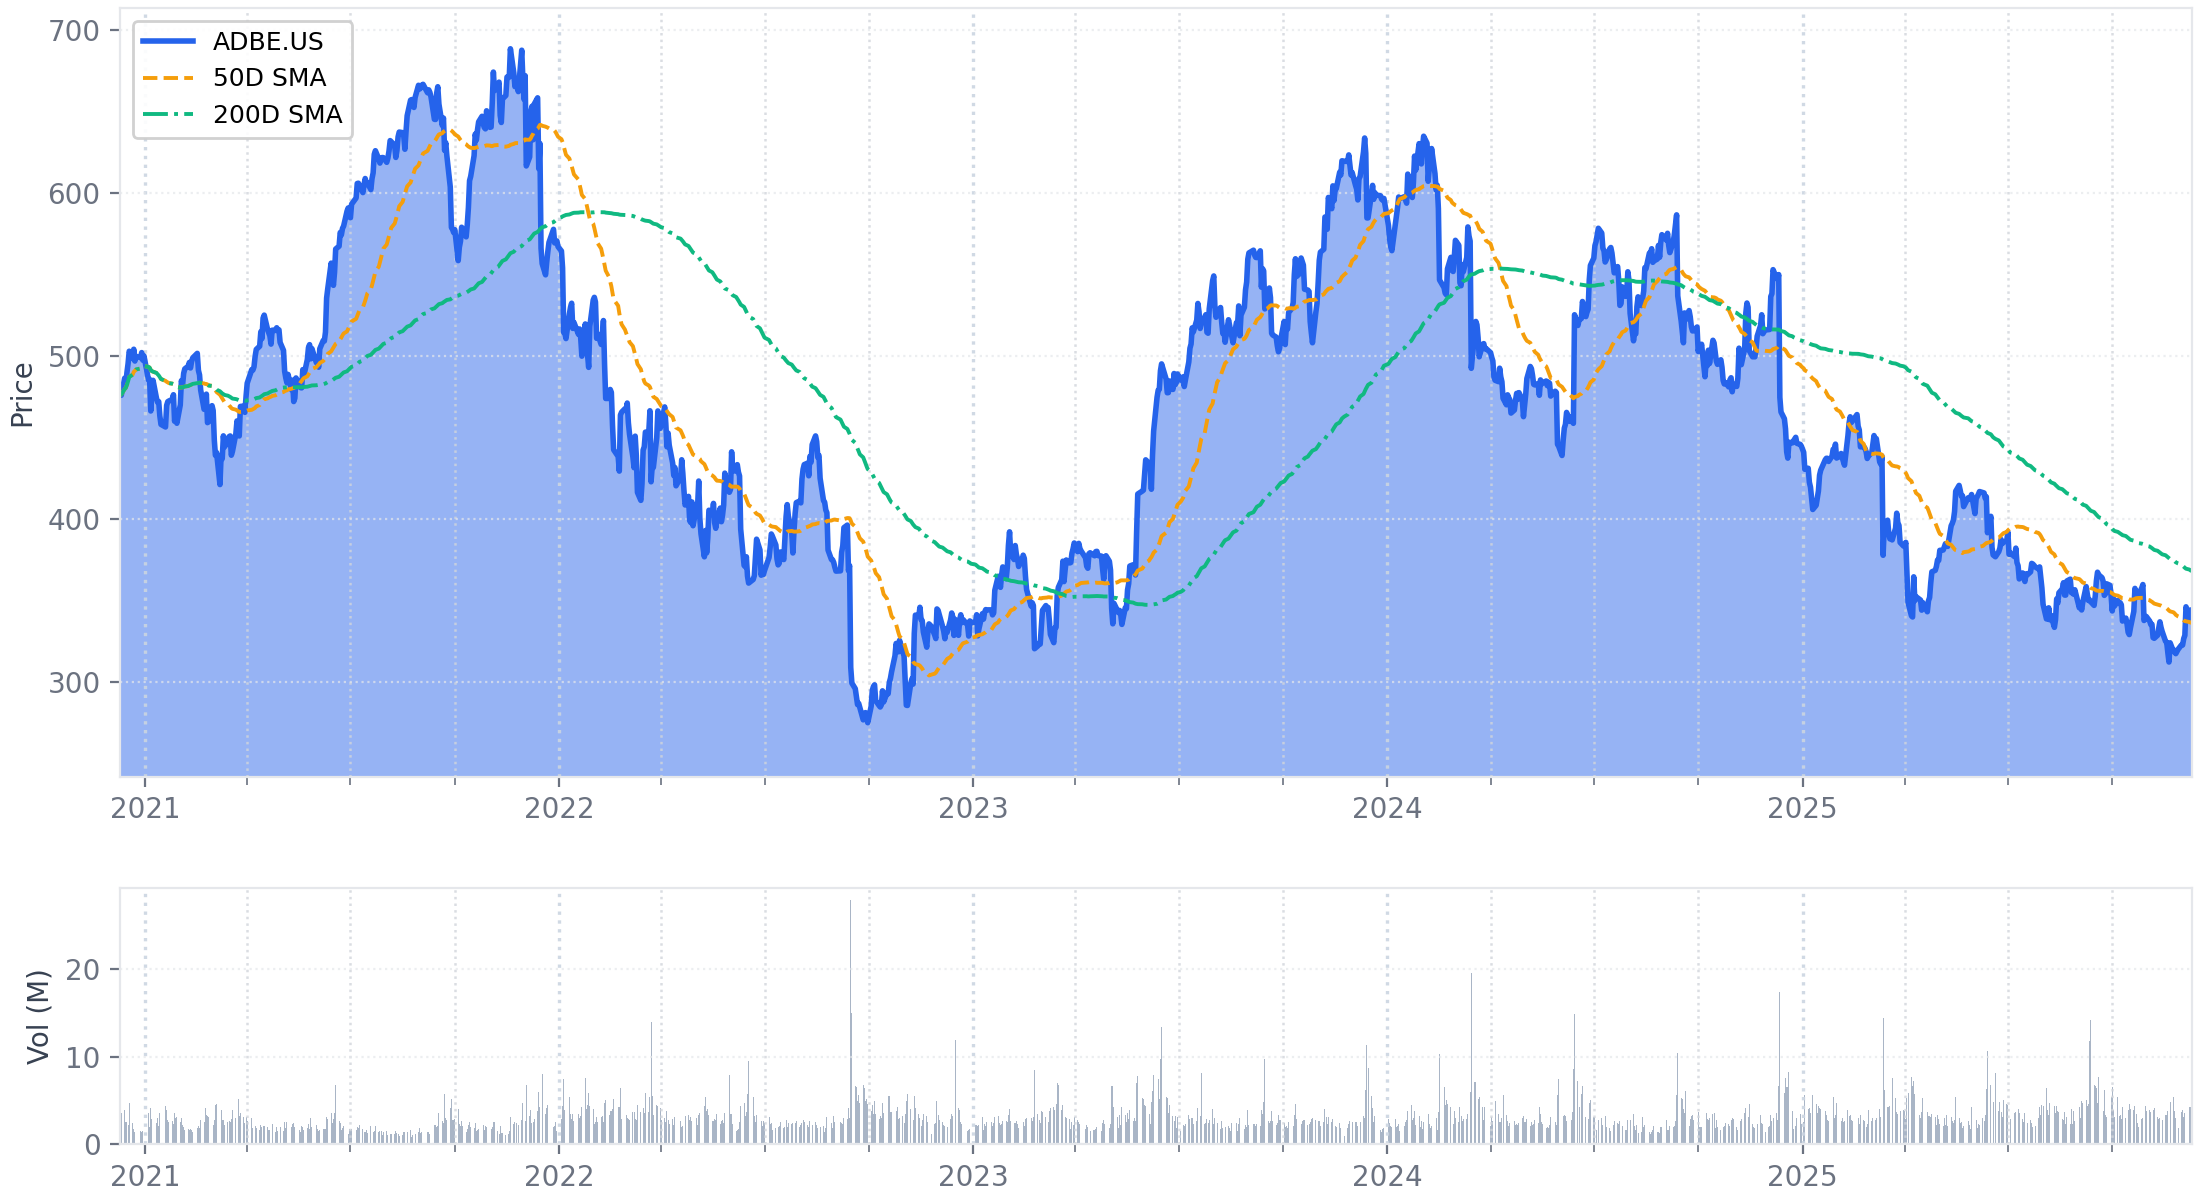
Executive Summary
Adobe reported record Q4 revenue of $6.19 billion (↑10% YoY) and non-GAAP EPS of $5.50 (↑14% YoY), surpassing its guidance and closing out a record fiscal year with $23.77 billion in total revenue. Management positioned the results as a strategic "inflection point," arguing that strong underlying operational momentum is now translating into tangible financial performance.
The company's AI initiatives are scaling rapidly, evidenced by a 3x quarter-over-quarter increase in generative credit consumption. A newly disclosed metric, "AI-influenced ARR," now accounts for over one-third of the company's total recurring revenue base, quantifying the broad impact of AI on its subscription business. This momentum, combined with strong demand for premium offerings like Acrobat Studio, contributed to a record quarter for net new Digital Media ARR.
Looking ahead, Adobe issued initial FY2026 guidance, targeting over 10% Total Adobe ARR growth, which represents a record ~$2.6 billion in net new ARR. Strategically, the company also announced its intent to acquire SEMrush for $1.9 billion to bolster its brand visibility offerings. The strong finish to FY2025 and the robust forward guidance suggest Adobe's AI product cycle is successfully establishing a new, durable growth trajectory for the upcoming year.
1. Financial Performance Summary
A. Income Statement Metrics (Q4 & Full Year)
Adobe reported record revenue of $6.19 billion for Q4 (↑10% YoY) and $23.77 billion for the full fiscal year 2025 (↑11% YoY), beating its prior guidance. The company's performance was driven by double-digit growth in the Digital Media segment and continued expansion in Digital Experience. Profitability remained robust, with full-year non-GAAP EPS growing 14% to $20.94.
| Metric | Q4 2025 | Q4 2024 | FY 2025 | FY 2024 | Notes |
|---|---|---|---|---|---|
| Total Revenue | $6.19B | $5.61B | $23.77B | $21.51B | Q4 ↑10.4% (10% CC), FY ↑10.5% (11% CC). Beat Q4 guidance of $6.075B–$6.125B (from Q3-25 transcript). |
| - Digital Media | $4.62B | $4.15B | $17.65B | $15.86B | Q4 ↑11.3% (11% CC), FY ↑11.3% (11% CC). |
| - Digital Experience | $1.52B | $1.40B | $5.86B | $5.37B | Q4 ↑8.6% (8% CC), FY ↑9.1% (9% CC). |
| - Digital Experience Subscription | $1.41B | $1.27B | $5.41B | $4.76B | Q4 ↑11.0% (11% CC), FY ↑13.7% (11% CC). |
| GAAP Operating Income | $2.26B | $1.96B | $8.71B | $6.74B | Q4 ↑15.3%, FY ↑29.2%. Q4 margin 36.5%, FY margin 36.6%. |
| Non-GAAP Operating Income[1] | $2.82B | $2.60B | $10.99B | $10.02B | Q4 ↑8.5%, FY ↑9.7%. Q4 margin 45.6%, FY margin 46.2%. |
| GAAP Net Income | $1.86B | $1.68B | $7.13B | $5.56B | Q4 ↑10.7%, FY ↑28.2%. Q4 net margin 30.0%, FY net margin 30.0%. |
| Non-GAAP Net Income[2] | $2.29B | $2.13B | $8.94B | $8.28B | Q4 ↑7.5%, FY ↑8.0%. |
| GAAP EPS (Diluted) | $4.45 | $3.79 | $16.70 | $12.36 | Q4 ↑17.4%, FY ↑35.1%. Beat Q4 guidance of $4.27–$4.32 (from Q3-25 transcript). |
| Non-GAAP EPS (Diluted)[3] | $5.50 | $4.81 | $20.94 | $18.42 | Q4 ↑14.3%, FY ↑13.7%. Beat Q4 guidance of $5.35–$5.40 (from Q3-25 transcript). |
Footnotes
- Non-GAAP Operating Income reconciliation:
- Q4 2025: GAAP Operating Income of $2.26B excludes stock-based compensation ($501M) and amortization of intangibles ($61M). Total adjustments of $562M represent 24.9% of GAAP Operating Income.
- FY 2025: GAAP Operating Income of $8.71B excludes stock-based compensation ($1.97B) and amortization of intangibles ($306M). Total adjustments of $2.28B represent 26.2% of GAAP Operating Income.
- Non-GAAP Net Income reconciliation:
- Q4 2025: GAAP Net Income of $1.86B excludes stock-based compensation ($501M), amortization of intangibles ($61M), net investment gains (-$12M), and includes income tax adjustments (-$113M). Total net adjustments of $437M represent 23.5% of GAAP Net Income.
- FY 2025: GAAP Net Income of $7.13B excludes stock-based compensation ($1.97B), amortization of intangibles ($306M), net investment gains (-$43M), and includes income tax adjustments (-$426M). Total net adjustments of $1.81B represent 25.4% of GAAP Net Income.
- Non-GAAP EPS reconciliation:
- Q4 2025: GAAP EPS of $4.45 excludes stock-based compensation ($1.20), amortization of intangibles ($0.15), net investment gains (-$0.03), and includes income tax adjustments (-$0.27). Total net adjustments of $1.05 represent 23.6% of GAAP EPS.
- FY 2025: GAAP EPS of $16.70 excludes stock-based compensation ($4.62), amortization of intangibles ($0.72), net investment gains (-$0.10), and includes income tax adjustments (-$1.00). Total net adjustments of $4.24 represent 25.4% of GAAP EPS.
B. Balance Sheet Highlights
Adobe ended the fiscal year with a net debt position of $53 million, a significant shift from a $1.83 billion net cash position at the end of FY2024. This change was primarily driven by nearly $12 billion in share repurchases during the year, which outpaced cash generation.
| Metric | Nov 28, 2025 | Nov 29, 2024 | Change | Notes |
|---|---|---|---|---|
| Cash & Short-Term Investments | $6.60B | $7.89B | ↓ 16.4% | Decrease driven by aggressive share repurchases. |
| Total Debt[1] | $6.65B | $6.06B | ↑ 9.7% | Increase reflects higher long-term debt and lease liabilities. |
| - Debt | $6.21B | $5.63B | ↑ 10.3% | Consists entirely of long-term debt. |
| - Operating Lease Liabilities | $0.44B | $0.43B | ↑ 2.3% | Includes current and long-term portions. |
| Net Debt (Cash)[2] | $53M | ($1.83B) | Shift to Net Debt | Shift from a net cash position due to capital returns exceeding cash generation. |
| Working Capital[3] | ($37M) | $711M | Shift to Negative | Driven by a $774M increase in deferred revenue (current liability). |
| Shareholders' Equity | $11.62B | $14.11B | ↓ 17.6% | Decrease primarily reflects the impact of treasury stock repurchases. |
Footnotes
- Total Debt is a calculated metric: Debt + Operating Lease Liabilities (Current + Long-term).
- FY 2025: $6,210M + $77M + $361M = $6,648M.
- FY 2024: $5,628M + $75M + $353M = $6,056M.
- Net Debt (Cash) is a calculated metric: Total Debt - (Cash and cash equivalents + Short-term investments).
- FY 2025: $6,648M - ($5,431M + $1,164M) = $53M (Net Debt).
- FY 2024: $6,056M - ($7,613M + $273M) = ($1,830M) (Net Cash).
- Working Capital is a calculated metric: Total current assets - Total current liabilities.
- FY 2025: $10,163M - $10,200M = ($37M).
- FY 2024: $11,232M - $10,521M = $711M.
C. Cash Flow Analysis
Adobe generated record operating cash flow of $3.16 billion in Q4 and over $10 billion for the full fiscal year. The company returned significant capital to shareholders, executing nearly $12 billion in share repurchases in FY2025, including $2.47 billion in the fourth quarter.
Quarterly Cash Flow
| Metric | Q4 2025 | Q4 2024 | Change | Notes |
|---|---|---|---|---|
| Operating Cash Flow | $3.16B | $2.92B | ↑ 8.2% | Management noted this was a record quarterly figure. |
| Share-Based Compensation | $489M | $441M | ↑ 10.9% | Represents 15.5% of Q4 Operating Cash Flow. |
| Capital Expenditures | ($34M) | ($48M) | ↓ 29.2% | — |
| Free Cash Flow (FCF)[1] | $3.13B | $2.87B | ↑ 9.1% | Represents a strong FCF margin of 50.6% of Q4 revenue. |
| Share Repurchases | ($2.47B) | ($2.50B) | ↓ 1.0% | — |
Full Year Cash Flow
| Metric | FY 2025 | FY 2024 | Change | Notes |
|---|---|---|---|---|
| Operating Cash Flow | $10.03B | $8.06B | ↑ 24.4% | Management noted this was a record annual figure. |
| Share Repurchases | (~$12.0B) | (~$7.7B)[2] | ↑ ~55.8% | FY25 repurchases reflect approximately 30.8 million shares. |
Footnotes
- Free Cash Flow is a calculated metric: Net cash provided by operating activities - Purchases of property and equipment. For Q4 2025: $3,160M - $34M = $3,126M. For Q4 2024: $2,921M - $48M = $2,873M.
- FY2024 share repurchase value is an approximation based on the repurchase of 17.5 million shares disclosed in the FY2024 transcript.
D. Key Financial Ratios
The company's return on equity improved significantly, driven by higher net income and a reduced equity base from share buybacks. Working capital management remained stable.
| Metric | FY 2025 | FY 2024 | Change | Notes |
|---|---|---|---|---|
| Return on Equity (ROE)[1] | 61.3% | 39.4% | +21.9 ppts | Improvement driven by higher net income and a smaller year-end equity base due to share repurchases. |
| Days Sales Outstanding (DSO)[2] | 36 days | 35 days | +1 day | DSO remained stable, indicating consistent accounts receivable management. |
| Days Payable Outstanding (DPO)[3] | 60 days | 56 days | +4 days | An increase in DPO suggests slightly longer payment cycles to suppliers. |
Footnotes
- Return on Equity is a calculated metric: Full Year Net Income / Period-End Shareholders' Equity. This is an approximation using period-end instead of average equity.
- FY 2025: $7,130M / $11,623M = 61.3%.
- FY 2024: $5,560M / $14,105M = 39.4%.
- Days Sales Outstanding (DSO) is a calculated metric: (Trade Receivables, Net / Total Revenue) * 365.
- FY 2025: ($2,344M / $23,769M) * 365 = 36 days.
- FY 2024: ($2,072M / $21,505M) * 365 = 35 days.
- Days Payable Outstanding (DPO) is a calculated metric: (Trade Payables / Total Cost of Revenue) * 365.
- FY 2025: ($417M / $2,551M) * 365 = 60 days.
- FY 2024: ($361M / $2,358M) * 365 = 56 days.
E. Operational Metrics
Adobe's SaaS metrics showed strong momentum, with Total ARR growing 11.5% to surpass $25 billion. The company achieved record net new Digital Media ARR in Q4, driven by strong demand for its AI-infused offerings. User engagement scaled rapidly, with total MAU growth exceeding 15% year-over-year. A newly disclosed metric, AI-influenced ARR, now accounts for over one-third of the company's total recurring revenue base.
| Metric | Q4 2025 | Q4 2024 | FY 2025 | FY 2024 | Notes |
|---|---|---|---|---|---|
| Total Adobe ARR (Ending) | — | — | $25.20B | $22.60B[1] | FY ↑11.5% YoY. |
| Digital Media ARR (Ending) | $19.20B | $17.33B | $19.20B | $17.33B | Q4 ↑10.8%, FY ↑10.8%. Grew 11.5% YoY, exceeding the prior target of 11.3%. |
| Net New Digital Media ARR | $610M[2] | $578M | $1.87B[3] | $2.00B | Q4 ↑5.5% YoY. Management noted Q4 was a record quarter. |
| RPO (Ending) | — | — | $22.52B | $19.96B | FY ↑12.8% YoY. Grew 13% as reported, 12% in constant currency. |
| cRPO Growth (YoY) | 11% | 13% | — | — | Growth was 10% in constant currency. |
| Total AI-Influenced ARR | >$8.4B[4] | — | — | — | New disclosure. Represents over one-third of the total ARR book of business. |
| Acrobat & Express MAU | >750M | >650M | — | — | Q4 ↑20% YoY. |
| Creative Freemium MAU | >70M | — | — | — | Q4 ↑35% YoY. |
| Generative Credit Consumption | — | — | — | — | Increased 3x quarter-over-quarter in Q4. |
Footnotes
- FY 2024 Total Adobe ARR is a calculated metric based on the 11.5% YoY growth reported in the FY2025 filing ($25.20B / 1.115).
- Q4 2025 Net New Digital Media ARR is a calculated metric: Ending Q4 ARR ($19.20B) - Ending Q3 ARR ($18.59B).
- FY 2025 Net New Digital Media ARR is a calculated metric: Ending FY25 ARR ($19.20B) - Ending FY24 ARR ($17.33B from Q4-24 transcript) = $1.87B.
- Total AI-Influenced ARR is a calculated metric based on management's statement that it exceeds one-third of the total ARR book of business ($25.20B / 3).
2. Forward-Looking Guidance
A. Guidance Summary
Adobe provided its initial guidance for Q1 and the full fiscal year 2026, targeting over 10% growth in Total Adobe ARR for the full year. This translates to approximately $2.6 billion in net new ARR, which management noted is their "highest beginning of year guide" for this metric. The full-year revenue guidance of $25.9 billion to $26.1 billion implies approximately 9-10% YoY growth. The guidance excludes any potential contribution from the pending acquisition of SEMrush.
Performance vs. Prior Guidance (Q4 FY2025)
The company's actual Q4 results surpassed the high end of the guidance provided during the Q3 earnings call across all key metrics.
| Metric | Period | Q4 Actuals | Prior Guidance (from Q3 Call) | Status |
|---|---|---|---|---|
| Total Revenue | Q4 2025 | $6.19B | $6.075B – $6.125B | Beat |
| Non-GAAP EPS | Q4 2025 | $5.50 | $5.35 – $5.40 | Beat |
| GAAP EPS | Q4 2025 | $4.45 | $4.27 – $4.32 | Beat |
Forward-Looking Guidance (Q1 & FY 2026)
| Metric | Period | Current Guidance | Notes |
|---|---|---|---|
| Total Revenue | Q1 2026 | $6.25B – $6.30B | Introduced. |
| Non-GAAP EPS | Q1 2026 | $5.85 – $5.90 | Introduced. |
| GAAP EPS | Q1 2026 | $4.55 – $4.60 | Introduced. |
| Total Revenue | FY 2026 | $25.90B – $26.10B | Introduced. Midpoint implies ~9.4% YoY growth. |
| Total Adobe Ending ARR Growth | FY 2026 | 10.2% YoY | Introduced. Translates to ~$2.6B in net new ARR. |
| Non-GAAP EPS | FY 2026 | $23.30 – $23.50 | Introduced. Midpoint implies ~11.7% YoY growth. |
| GAAP EPS | FY 2026 | $17.90 – $18.10 | Introduced. Midpoint implies ~7.8% YoY growth. |
B. Additional Guidance & Assumptions
- ARR Revaluation: Management noted that the ending ARR for FY2025 was revalued, resulting in a $460 million increase from $25.20 billion to $25.66 billion entering FY2026. This adjustment was primarily due to foreign exchange rate changes. The 10.2% growth target is based on this higher starting point.
- Customer Group Subscription Revenue Targets:
- Q1 FY2026:
- Business Professionals & Consumers: $1.74B – $1.76B
- Creative & Marketing Professionals: $4.30B – $4.33B
- FY 2026:
- Business Professionals & Consumers: $7.35B – $7.40B
- Creative & Marketing Professionals: $17.75B – $17.90B
- Q1 FY2026:
- Margin, Tax Rate & Share Count Assumptions:
- Q1 FY2026:
- Non-GAAP Operating Margin: ~47.0%
- GAAP Tax Rate: ~21.5%
- Non-GAAP Tax Rate: ~18.0%
- Diluted Share Count: ~411 million
- FY 2026:
- Non-GAAP Operating Margin: ~45.0%
- GAAP Tax Rate: ~20.5%
- Non-GAAP Tax Rate: ~18.0%
- Diluted Share Count: ~403 million
- Q1 FY2026:
- Long-Term Outlook: Management expressed a focus on "accelerating this momentum beyond FY 2026," signaling confidence in a durable growth trajectory driven by its AI product cycle and expanding market opportunity.
3. Operational & Strategic Developments
A. Business Performance & Operations
Adobe's performance in Q4 and FY2025 was characterized by accelerating AI adoption and monetization, robust user growth across its freemium offerings, and strong enterprise demand.
-
AI Adoption & Monetization Scaling Rapidly:
- Management introduced a new metric, AI-influenced ARR, which now accounts for over one-third of the total ARR book of business. This metric includes offerings enhanced by embedded AI features.
- User engagement with AI tools showed significant acceleration, with generative credit consumption increasing 3x quarter-over-quarter in Q4 across Creative Cloud, Firefly, and Express.
- Enterprise adoption of AI solutions drove a record quarter for bookings of deals greater than $1 million and a 25% year-over-year increase in customers with over $10 million in ARR.
-
Performance by Customer Group:
- Business Professionals & Consumers:
- Acrobat Studio, the premium offering bundling Acrobat and Express, saw strong initial uptake, with nearly 50% of commercial enterprise agreements renewed in Q4 upgrading to the new tier.
- The user funnel continued to expand, with combined Acrobat and Express monthly active users (MAUs) surpassing 750 million, a 20% YoY increase.
- Creators & Creative Professionals:
- The freemium strategy is successfully attracting new users, with creative freemium MAUs growing over 35% YoY to more than 70 million.
- The standalone Firefly application has become a key user acquisition engine, driving a 2x quarter-over-quarter growth in first-time subscriptions.
- Firefly Foundry, the service for creating custom enterprise models, is gaining traction. Management provided an example of a media company with a $10 million creative ARR base adding a $7 million contract for Firefly services and Foundry, demonstrating a significant upsell opportunity.
- Marketing Professionals:
- The GenStudio solution ending ARR grew over 25% year-over-year, as enterprises adopt Adobe's platform for their content supply chain.
- The company's new "agentic web" offerings, including LLM Optimizer and Sites Optimizer, secured over 50 customers in their first quarter of availability.
- The Adobe Experience Platform (AEP) and its native apps continued to be a strong growth driver, with ending ARR growing over 30% year-over-year.
- Business Professionals & Consumers:
B. Strategic Initiatives
Adobe's strategy is centered on expanding its market opportunity through a major acquisition, deepening its AI ecosystem partnerships, and pioneering agentic AI technologies to create new monetization surfaces.
-
Growth through M&A:
- Adobe announced its intent to acquire SEMrush for approximately $1.9 billion in an all-cash transaction, expected to close in 2026.
- Strategic Rationale: The acquisition is designed to bolster Adobe's "brand visibility" offerings for marketers. SEMrush's expertise in search engine optimization (SEO) and generative engine optimization (GEO) will be combined with Adobe's Experience Cloud to provide a unified solution for managing brand presence across websites, traditional search, and new LLM-based channels.
- Financial Impact: The acquisition is expected to be negligible to non-GAAP EPS in the first year post-close and accretive thereafter.
-
Ecosystem and Partnerships:
- The company is solidifying its position as an indispensable platform by creating an open AI ecosystem, with key integrations across AWS, Azure, Google Gemini, Microsoft Copilot, and OpenAI.
- Management highlighted a strategic shift to "atomize" its core application capabilities, providing imaging, video, and PDF functionalities as API endpoints that can be integrated into third-party conversational platforms like ChatGPT and Copilot. This initiative aims to monetize Adobe's technology on new surfaces and expand its top-of-funnel reach.
C. Risk Factors & Headwinds
- Shift in Capital Structure: As a result of an aggressive capital return program, Adobe's balance sheet has shifted from a $1.83 billion net cash position at the end of FY2024 to a $53 million net debt position at the end of FY2025. This was driven by nearly $12 billion in share repurchases during the fiscal year, a material change that reduces financial flexibility for future large-scale M&A.
- Investor Perception vs. Management Outlook (Persistent): The Q&A session highlighted an ongoing focus on when AI-driven innovation will translate into an acceleration of total company growth. In response, CEO Shantanu Narayen characterized Q4 as a "really strong quarter" and an "inflection in the early indicators" like user growth and AI consumption. He positioned the FY2026 net new ARR guide of ~$2.6 billion as the "highest beginning of the year guide" ever, presenting it as tangible evidence of this underlying momentum.
- Competitive Pressures (Persistent): The creative AI landscape remains highly competitive. Adobe continues to address this by differentiating on three key pillars: workflow integration, commercial safety, and an open platform strategy.
- Change in Guidance Methodology: Beginning in FY2026, Adobe will shift its primary guidance metrics to focus on customer group subscription revenue and total company ending ARR growth, a change from the previous focus on Digital Media and Digital Experience segment revenues.
4. Q&A Session Key Themes
A. Analyst Focus Areas
The Q&A session was dominated by analysts seeking to connect Adobe's significant AI-driven product innovation with a tangible acceleration in financial growth. The primary focus was on understanding the monetization timeline and the drivers underpinning the company's forward-looking guidance.
- Quantifying the AI Opportunity: Multiple questions centered on the economic potential of new AI offerings.
- Firefly Foundry & Enterprise Value: In response to a question about Firefly Foundry's potential, management framed it as a "massive opportunity" and provided a specific example of a media company with a $10 million creative ARR base adding a $7 million contract for Firefly services and Foundry, illustrating a substantial upsell path.
- Generative Credit Consumption: When asked about the 3x quarter-over-quarter increase in credit consumption, management attributed it to a multiplier effect across more AI-enabled apps, broader media type support (especially video), new use cases, and more powerful models. This is a leading indicator for upgrades and add-on purchases.
- Strategic Rationale for SEMrush Acquisition: Analysts inquired about the strategy behind the pending SEMrush acquisition. Management explained that the deal directly addresses the marketer concern of "brand visibility" as discovery shifts from traditional search to LLM-based interactions.
- Monetization on Third-Party Platforms: A question was raised about monetizing Adobe's technology on new surfaces like ChatGPT. Management described this as a key "top of funnel" strategy to reach new users, highlighting the strategic importance of Model Context Protocols (MCPs) which allow LLMs to call external APIs.
B. Key Challenges & Concerns
The most significant theme of the Q&A was a direct challenge from analysts regarding a perceived disconnect between Adobe's rapid pace of innovation and the lack of a corresponding acceleration in its top-line financial guidance.
- The Innovation vs. Growth Disconnect: An analyst articulated the core investor concern: "When can we potentially see this sort of... accelerate the totality of growth? ...because I think that's what investors really wanna see to get more confident in the stock."
- Management's "Inflection Point" Rebuttal: CEO Shantanu Narayen addressed this directly by positioning Q4 as a pivotal quarter.
- He stated, "Q4 was a really strong quarter. And frankly, starting to be this inflection in terms of as we see the leading indicators."
- He argued that the underlying operational metrics—such as MAU growth, freemium user acquisition, and AI credit consumption—are the key signals of future financial acceleration.
- Growth Sustainability & FY2026 Guidance: Analysts directly questioned the apparent deceleration in the FY2026 Total Adobe ARR growth target (10.2%) compared to the actual growth achieved in FY2025 (11.5%).
- Management’s Response: Management consistently reframed the guidance by focusing on absolute dollar growth rather than percentage change. They emphasized that the 10.2% target translates to approximately $2.6 billion in net new ARR, which they characterized as the "highest beginning of the year guide for total net new ARR" in the company's history.
5. Strategic Themes & Inflection Points
A. Current Period Themes
- Dominant Narrative: "Inflection Point" Driven by Leading Indicators: Management is proactively framing Q4 as a pivotal "inflection point" for the business. The core message is that strong operational metrics—such as the 3x quarter-over-quarter growth in generative credit consumption and a 35% YoY increase in creative freemium MAUs—are the leading indicators of future financial acceleration.
- Operational Focus: Converting Massive AI Usage into Revenue: The primary operational priority is monetizing the rapidly scaling usage of AI tools. This is being executed through a multi-pronged strategy focused on driving upgrades to higher-value tiers, evidenced by nearly 50% of renewing enterprise agreements upgrading to Acrobat Studio, and demonstrating significant upsell potential with new enterprise offerings like Firefly Foundry.
- Changes in Tone & Messaging:
- From Validation to Inflection: The tone has shifted from validating the initial AI monetization thesis in Q3 to declaring an inflection in business momentum in Q4.
- Reframing Guidance: In response to questions about the FY2026 ARR growth target, management consistently pivoted the discussion from percentage growth to the absolute dollar value of net new ARR (~$2.6 billion), labeling it the "highest beginning of the year guide" ever.
- Quantifying AI’s Broad Impact: The introduction of the "AI-Influenced ARR" metric, now representing over one-third of the business, is a new disclosure designed to demonstrate that AI's value extends far beyond new, standalone products and is deeply integrated into the core subscription base.
B. Future Considerations
- Emerging Opportunities:
- Generative Engine Optimization (GEO): The pending SEMrush acquisition signals a strategic push to create and lead a new market category, aiming to capture marketing budgets as brand discovery shifts from traditional search engines to conversational AI platforms.
- Monetization on New Surfaces: A key long-term opportunity is the strategy to "atomize" Adobe's core functionalities into APIs for third-party conversational platforms like ChatGPT and Copilot, transforming Adobe's technology into a fundamental utility layer that can be monetized across the broader AI ecosystem.
- Transformation Initiatives:
- Shift to an Open AI Platform: By integrating over 25 partner models, Adobe is transforming from a provider of proprietary tools into a neutral "one-stop shop" for creative AI. This open-platform strategy aims to make its applications indispensable as the central workflow hub.
6. Key Items to Monitor Next Quarter
A. Prior Quarter Monitoring Review
The following table reviews the monitoring items identified in the prior quarter (Q3 FY2025) and assesses their current status based on disclosures from the Q4 FY2025 earnings call.
| Prior Item | Current Status | Management Commentary |
|---|---|---|
| AI-First Products ARR Growth Trajectory | No Update | Management did not provide a new specific ARR figure for "AI-first products." Instead, it introduced a broader metric, "AI-Influenced ARR," which now comprises over one-third of the total ARR book of business. |
| Acrobat Studio Adoption & ARPU Impact | On Track | Management reported strong initial adoption, stating that "nearly 50% of Acrobat commercial ETLAs renewed in Q4 already upgrading to this offering," providing a concrete data point that validates the new premium tier's appeal. |
| LLM Optimizer Traction | On Track | The company reported strong early demand for its new "agentic web" offerings, securing "over 50 customers in Q4" for the suite that includes Adobe LLM Optimizer. |
| Acrobat & Express MAU Growth Rate | On Track | Combined MAU growth stabilized at 20% YoY, reaching over 750 million users. While this did not re-accelerate, it shows sustained user acquisition at a large scale. |
| GenStudio ARR Scale-Up | On Track | Management confirmed that the ending ARR for the GenStudio solution continued to grow at over 25% year-over-year, maintaining the strong growth trajectory reported in the previous quarter. |
B. Current Quarter Focus Items
The following table outlines the key non-guidance metrics and strategic developments to monitor in upcoming quarters to assess Adobe's business trajectory and execution.
| Category | Item | Timeline | What to Monitor | Why It Matters |
|---|---|---|---|---|
| Strategic | SEMrush Acquisition Progress | Ongoing (Close in 2026) | The timeline for regulatory approvals and any commentary on product integration roadmaps with the Adobe Experience Cloud. | This $1.9 billion acquisition is central to Adobe's strategy to lead in "Generative Engine Optimization." Successful integration is critical to realizing the deal's strategic value. |
| Operational | Generative Credit Consumption Growth | Next Quarter | The sequential growth rate of generative credit consumption after a reported 3x quarter-over-quarter increase in Q4. | This is the most direct leading indicator of AI-driven ARPU uplift. Sustained high growth would confirm that AI usage is successfully converting into higher-value plan upgrades and add-on purchases. |
| Opportunity | Firefly Foundry Enterprise Deal Momentum | Ongoing | The number of new Firefly Foundry deals and qualitative color on average deal size or ARR uplift, building on the example of a $10M customer adding a $7M Foundry contract. | Foundry is Adobe's highest-value AI offering. Its adoption by large enterprises is a key test of the company's ability to capture significant, new AI transformation budgets. |
| Risk | Execution on Absolute Net New ARR Target | FY 2026 | The company's quarterly progress towards the ~$2.6 billion total net new ARR implied by its FY2026 guidance. | Management set a high bar by framing this as the "highest beginning of year guide" ever. Failure to track towards this absolute number would undermine the "inflection point" narrative. |
| Strategic | Monetization on Third-Party AI Platforms | Ongoing | Announcements of new partnerships where Adobe's "atomized" capabilities are integrated into major conversational platforms like ChatGPT or Copilot. | This represents a major strategic shift from selling apps to selling functional components, opening a new monetization surface. Progress here will indicate if Adobe can successfully embed itself as the indispensable utility layer across the broader AI ecosystem. |
Appendix: Quotes by Theme
-
The Innovation vs. Growth Disconnect: Management Frames Q4 as an "Inflection Point" Analysts directly challenged management on the perceived disconnect between rapid AI innovation and the lack of acceleration in headline growth figures. In response, the CEO positioned Q4 not just as a strong quarter, but as a strategic inflection point where underlying operational momentum is beginning to translate into financial results.
"When can we potentially see this sort of... accelerate the totality of growth? At Adobe... because I think that's what investors really wanna see to get more confident in the stock..." — Keith Weiss, Analyst, Morgan Stanley
"Yeah, Keith. I mean, from my perspective, Q4 was a really strong quarter. And frankly, starting to be this inflection in terms of as we see the leading indicators. What is happening across the leading indicators... gives us a lot of confidence... I think Q4 was inflection in the early indicators, which we continue to track." — Shantanu Narayen, CEO
- vs Q3-FY25 (Analyst observation, more tentative):
"it seems like this was kind of almost, I would say, a turning point quarter for you guys. It was the first quarter, I think, we're net new DM ARR actually was flat to maybe even growing for the first time this year on a tougher comp." — Aleksandr Zukin, Analyst, Wolfe Research
-
Guidance Framing: Shifting Focus from Percentage Growth to Absolute Net New ARR When questioned about the FY2026 ARR growth guidance of 10.2% being a deceleration from the 11.5% achieved in FY2025, management pivoted the narrative. They consistently reframed the target by emphasizing the absolute dollar value, presenting it as a historically strong figure that signals building momentum.
"Total Adobe NAIR growth this year ended at 11.5%, and next year, you're guiding to 10.2%. Could you help us understand what is driving the difference...?" — Mark Moerdler, Analyst, Bernstein
"I think you have to look at it also in terms of the absolute... when you look at the total Adobe ARR growth target... which translates to approximately $2.6 billion. That's the highest beginning of the year guide for total net new ARR." — Shantanu Narayen, CEO
-
Quantifying the Enterprise AI Opportunity: Firefly Foundry's Significant ARR Uplift To provide a concrete example of the enterprise monetization opportunity, management detailed a specific customer engagement where the addition of Firefly Foundry and services represented a substantial increase on top of the existing creative software spend.
"Let's take a media and entertainment company we're working on... let's say that that organization was spending $10 million with us ARR on our core creative products... We were able to sell them Firefly services Firefly Foundry for about $7 million, so pretty significant step up in terms of... the engagement that we have with the customer." — David Wadhwani, President, Digital Media
-
AI Consumption as a Leading Monetization Indicator Management highlighted the 3x quarter-over-quarter growth in generative credit consumption as a key leading indicator, directly linking the surge in AI usage to future revenue through upgrades and add-on purchases.
"All of that led to the three times quarter over quarter growth in generation. And as a result of that... we're starting to see increasing user upgrades to higher price plans and including credit pack add-ons." — David Wadhwani, President, Digital Media
- vs Q3-FY25 (Less specific, indicating acceleration without a hard metric):
"Support of Firefly and third-party models in Creative Cloud Applications drove accelerating generative AI usage quarter-over-quarter..." — Dan Durn, CFO
-
Strategic Rationale for SEMrush Acquisition: Dominating "Generative Engine Optimization" Management articulated the strategic driver for the pending $1.9 billion SEMrush acquisition as a move to address the critical new marketing challenge of "brand visibility" in an AI-driven world, aiming to create a comprehensive solution for managing brand presence across all digital channels, including LLMs.
"If you look at what's top of mind for marketers right now... brand visibility is one of the key areas... How their brands appear, how they're positioned, especially in new channels like the LLMs... we'll be able to offer a comprehensive solution for marketers so that whether it is their own media... earned media like these LLMs, or across search engines. They have one solution..." — Anil Chakravarthy, President, Digital Experience
-
Long-Term Strategy: "Atomizing" Capabilities to Monetize on New AI Surfaces A key long-term strategy involves breaking down Adobe's core application functions into APIs that can be integrated into third-party conversational platforms. This is positioned as a major top-of-funnel opportunity to reach new users and establish Adobe's technology as an indispensable utility layer across the AI ecosystem.
"as LLMs start embracing these model context protocols, these MCP endpoints, it's no longer that these LLMs are about a prompt to a model and a response. It now gives us the opportunity to have the... LLMs actually work with models and APIs. And that plays to a really strong strength that we have in durable differentiator given the incredible APIs we have across creativity and productivity." — David Wadhwani, President, Digital Media
-
AI Ecosystem Strategy: Differentiating on Choice and Integration Management's strategy for competing in the crowded AI model space remains consistent: position Adobe as the essential, neutral workflow hub that offers both proprietary, commercially safe models and a broad selection of integrated third-party models.
"At Adobe MAX in October, we significantly expanded Firefly to become the only app with our own commercially safe models and over 25 leading partner models, including Google, OpenAI, Black Forest Labs, Luma, Runway, Topaz Labs, and Eleven Labs." — David Wadhwani, President, Digital Media
- vs Q3-FY25 (Consistent messaging on an open platform):
"Our strategy... is to really differentiate on 2 things. One is choice, and two is integrations... The sustained value the differentiated value is really that workflow..." — David Wadhwani, President, Digital Media
Historical Performance