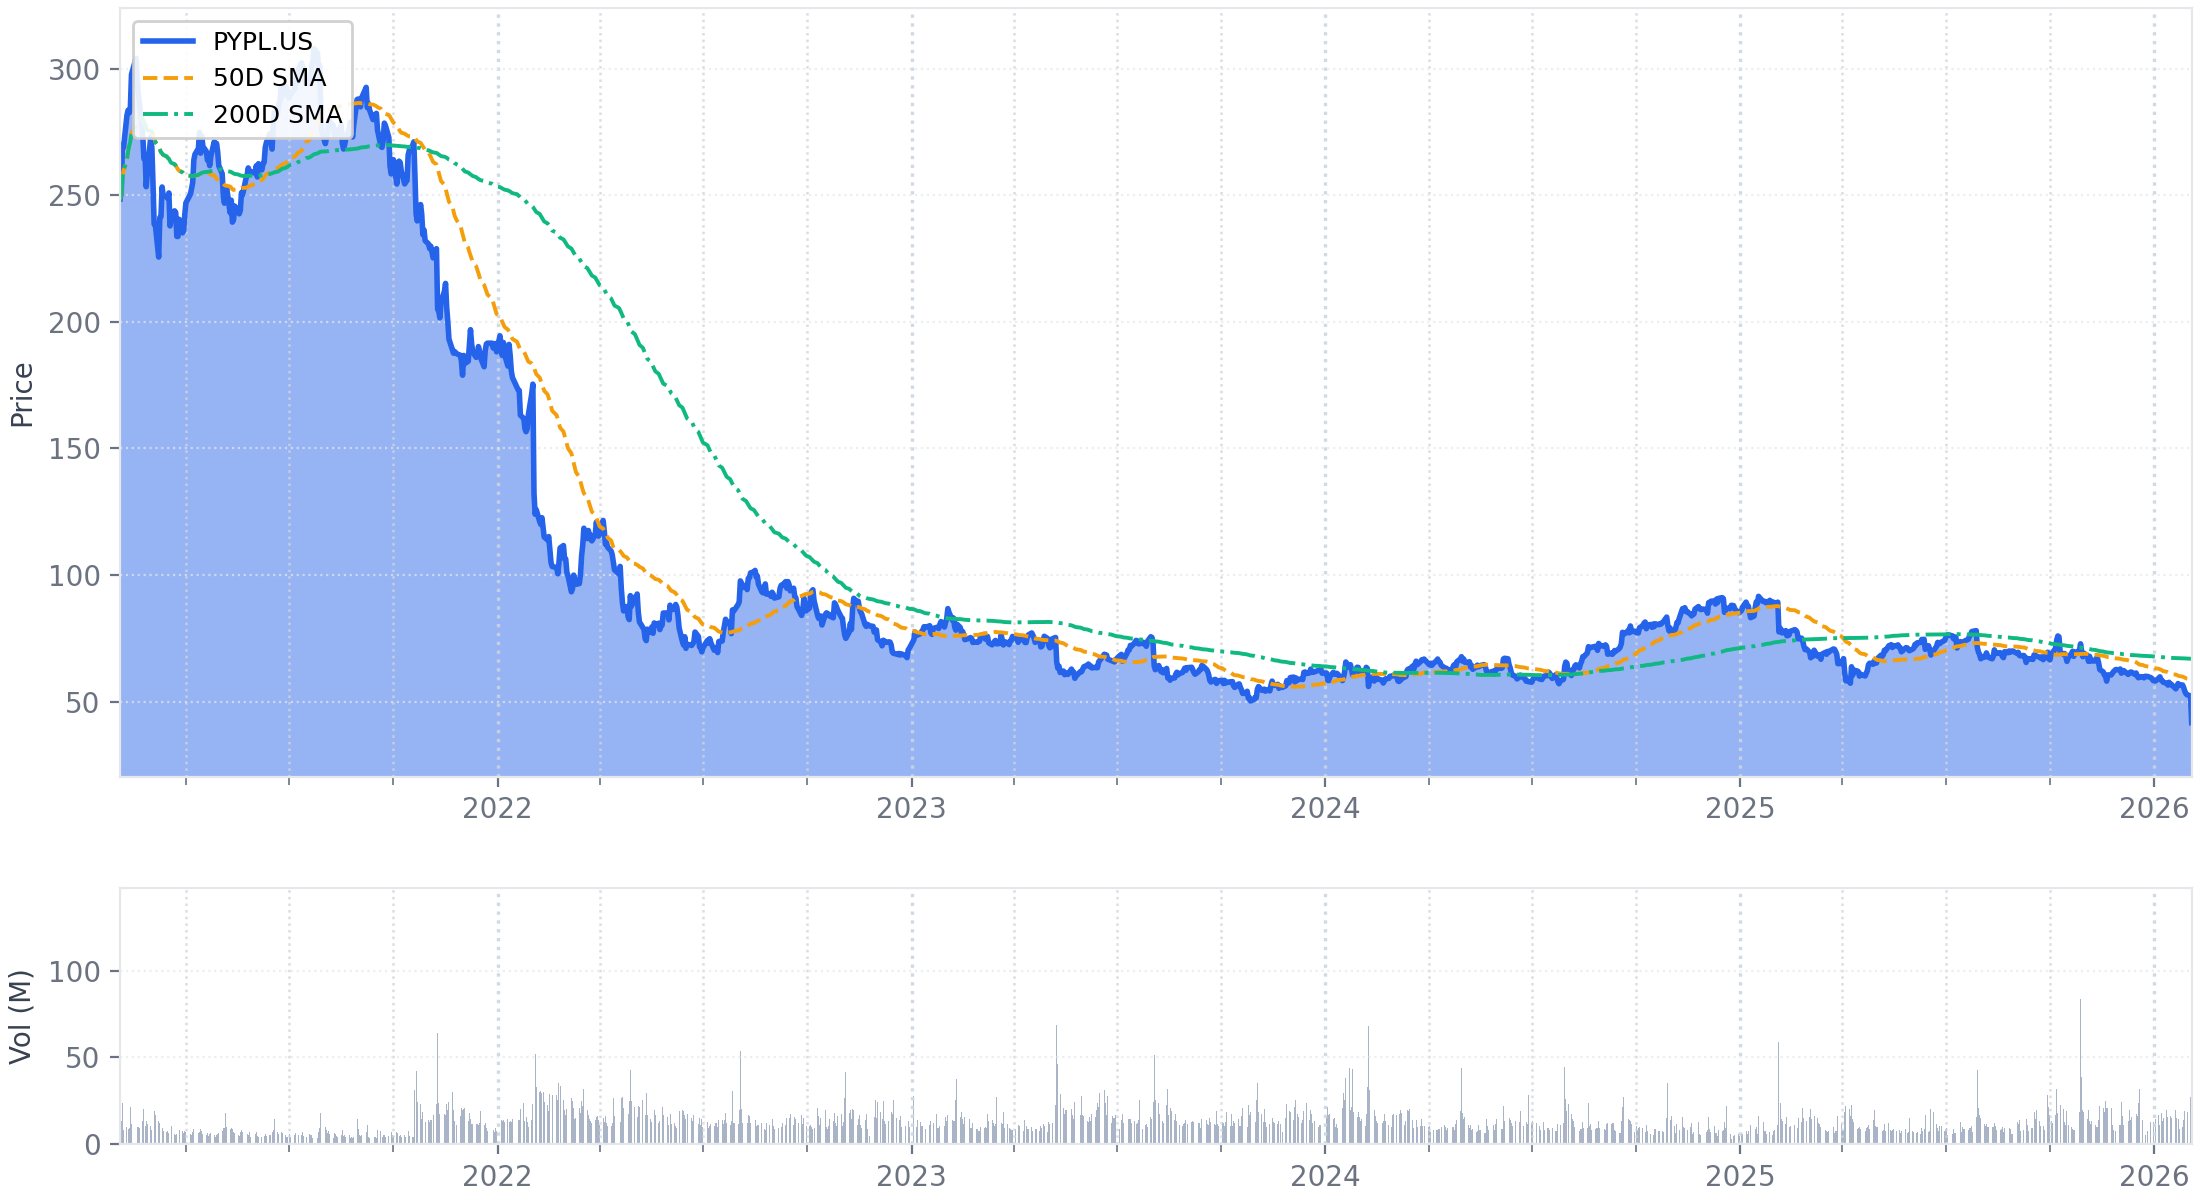
Executive Summary
PayPal announced a significant leadership transition, with Board Chair Enrique Lores to become CEO on March 1, 2026, following a quarter marked by acknowledged execution failures. The change was prompted by a sharp slowdown in the core online branded checkout business, where TPV growth decelerated to just 1% (FX-neutral) from 5% in the prior quarter. This underperformance led to the company missing its Q4 guidance, with non-GAAP EPS of $1.23 falling short of the $1.27–$1.31 range.
Despite the Q4 weakness, full-year 2025 results were solid, with non-GAAP EPS growing 14%, supported by resilient diversified drivers like the PSP business, where volume growth accelerated to 8%. However, management has withdrawn its multi-year outlook provided at the 2025 Investor Day, citing a more challenging environment and slower-than-expected execution.
Looking ahead, 2026 is positioned as a foundational investment year. The outlook is cautious, with guidance for non-GAAP EPS to be down low-single-digits to slightly positive. This forecast incorporates an approximate 3-point headwind to transaction margin dollar growth from targeted investments aimed at revitalizing the branded checkout experience. The company is now in a period of fundamental repair, trading near-term profitability for a long-term fix of its core engine, with the success of this pivot dependent on the new leadership's ability to drive disciplined execution.
1. Financial Performance Summary
PayPal reported solid full-year 2025 results, with diversified drivers contributing to a 14% increase in non-GAAP EPS. However, Q4 performance for branded checkout decelerated more than expected, leading to a miss on revenue and non-GAAP EPS guidance for the quarter. The company announced a CEO transition effective March 1, 2026, citing a need to accelerate execution. Management has withdrawn its multi-year outlook provided at the prior year's Investor Day, opting to provide guidance one year at a time, and has outlined significant investments in 2026 expected to pressure near-term transaction margin and EPS growth.
A. Income Statement Metrics (Q4 & Full Year)
For Q4 2025, revenue grew 3% on a currency-neutral basis, missing management's "mid-single digits" guidance provided in the prior quarter. Non-GAAP EPS of $1.23 also missed the guided range of $1.27–$1.31, which management attributed to a higher-than-expected tax rate and pressure on branded checkout volumes. For the full year, non-GAAP EPS grew 14% to $5.31.
| Metric | Q4 2025 | Q4 2024 | FY 2025 | FY 2024 | Notes |
|---|---|---|---|---|---|
| Net Revenues | $8.68B | $8.37B | $33.17B | $31.80B | Q4 +4% reported, +3% FXN; FY +4% reported, +4% FXN. Q4 missed "mid-single digits" guidance (Q3-25 transcript). |
| - Transaction Revenues | $7.82B | $7.59B | $29.80B | $29.84B | Q4 +3%; FY flat. |
| - Other Value-Added Services | $857M | $778M | $3.37B | $2.96B | Q4 +10%; FY +14%. Driven by merchant and consumer credit. |
| Transaction Margin Dollars (TM$) | $4.03B | $3.94B | $15.47B | $14.66B | Q4 +3%; FY +6%. Met Q4 guidance of $4.02B–$4.12B. |
| - TM$ (ex-interest on customer balances) | $3.74B | $3.60B | $14.24B | $13.37B | Q4 +4%; FY +6%. |
| GAAP Operating Income | $1.51B | $1.44B | $6.07B | $5.33B | Q4 +5%; FY +14%. |
| GAAP Operating Margin | 17.4% | 17.2% | 18.3% | 16.7% | Q4 +19 bps; FY +154 bps. |
| Non-GAAP Operating Income | $1.55B | $1.50B | $6.38B | $5.84B | Q4 +3%; FY +9%. |
| Non-GAAP Operating Margin | 17.9% | 18.0% | 19.2% | 18.4% | Q4 -9 bps; FY +87 bps. |
| GAAP Net Income | $1.44B | $1.12B | $5.23B | $4.15B | Q4 +28%; FY +26%. |
| Non-GAAP Net Income | $1.16B | $1.21B | $5.14B | $4.84B | Q4 ↓ 4%; FY +6%. |
| GAAP EPS (Diluted) | $1.53 | $1.11 | $5.41 | $3.99 | Q4 +38%; FY +35%. Q4 includes a ~$0.10 positive impact from strategic investments. |
| Non-GAAP EPS (Diluted)[1] | $1.23 | $1.19 | $5.31 | $4.65 | Q4 +3%; FY +14%. Missed Q4 guidance of $1.27–$1.31. |
Footnotes
- Q4 Non-GAAP EPS of $1.23 reflects a material difference from GAAP EPS of $1.53. The adjustment primarily consists of excluding a net gain of $117M on strategic investments and a $223M non-recurring tax benefit.
B. Balance Sheet Highlights
As of December 31, 2025, PayPal held a net cash position of approximately $3.2 billion. The company maintained a strong liquidity profile with $14.8 billion in cash and investments against $11.6 billion in total debt.
| Metric | Dec 31, 2025 | Dec 31, 2024 | Change | Notes |
|---|---|---|---|---|
| Cash and Cash Equivalents | $8.0B | $6.7B | ↑ 20.1% | — |
| Short-term Investments | $2.4B | $4.3B | ↓ 44.2% | — |
| Long-term Investments | $4.3B | $4.6B | ↓ 6.5% | — |
| Total Cash & Investments | $14.8B | $15.5B | ↓ 4.5% | — |
| Total Debt[1] | $11.6B | $11.1B | ↑ 4.5% | Figure provided by management in the transcript. |
| Net Cash[2] | $3.2B | $4.4B | ↓ 27.3% | The company maintains a net cash position. |
| Shareholders' Equity | $20.3B | $20.4B | ↓ 0.8% | — |
Footnotes
- Total Debt is a management-provided figure. The balance sheet reports Long-term Debt of $10.0B as of Dec 31, 2025. The remainder is assumed to be short-term debt.
- Net Cash calculated as: Total Cash & Investments ($14.8B) - Total Debt ($11.6B) = $3.2B.
C. Cash Flow Analysis
For the full year 2025, PayPal generated $6.4 billion in adjusted free cash flow and returned $6.1 billion to shareholders through $6.0 billion in share repurchases and its first-ever dividend payment of $130 million.
| Metric | FY 2025 | FY 2024 | Change | Notes |
|---|---|---|---|---|
| Net Cash from Operating Activities | $6.4B | $7.5B | ↓ 13.8% | — |
| Stock-Based Compensation | $1.0B | $1.2B | ↓ 16.7% | Represents 15.6% of FY25 Operating Cash Flow. |
| Capital Expenditures | ($0.9B) | ($0.7B) | ↑ 24.8% | — |
| Free Cash Flow (GAAP)[1] | $5.6B | $6.8B | ↓ 17.7% | — |
| Adjusted Free Cash Flow[2] | $6.4B | $6.6B | ↓ 3.4% | Met FY25 guidance of "at least $6B" (Q4-24 transcript). |
| Share Repurchases | ($6.0B) | ($6.0B) | Flat | Met guidance for ~$6B in buybacks. |
| Dividend Payments | ($0.1B) | — | New | First quarterly dividend of $0.14 per share paid in Q4. |
Footnotes
- Free Cash Flow (GAAP) calculated as: Net Cash from Operating Activities ($6.4B) - Purchases of property and equipment ($0.9B) = $5.5B.
- Adjusted Free Cash Flow is a company-reported non-GAAP metric. The FY25 figure includes a positive adjustment of $847M for the "net timing impact between originating credit receivables as held for sale and the subsequent sale of receivables."
D. Key Financial Ratios
The company's Return on Equity improved in FY2025, driven by higher net income. PayPal ended the year in a net cash position, rendering traditional leverage ratios not meaningful.
| Metric | FY 2025 | FY 2024 | Change | Notes |
|---|---|---|---|---|
| Return on Equity (ROE)[1] | 25.7% | 20.3% | ↑ 540 bps | Improvement driven by higher GAAP Net Income. |
| Net Debt to EBITDA | Net Cash | Net Cash | N/A | The company holds a net cash position of $3.2B. |
Footnotes
- Return on Equity (ROE) calculated as: GAAP Net Income divided by Average Shareholders' Equity. FY25: $5.23B / avg of $20.3B and $20.4B = 25.7%.
E. Operational Metrics
Total Payment Volume (TPV) for Q4 grew 6% on a currency-neutral basis, a slight deceleration from 7% in Q3. The slowdown was concentrated in online branded checkout, which grew only 1% FXN, down from 5% in the prior quarter. Core customer engagement, measured by Transactions Per Active Account (TPA) excluding PSP, maintained momentum with 5% growth.
| Metric | Q4 2025 | Q4 2024 | FY 2025 | FY 2024 | Notes |
|---|---|---|---|---|---|
| Total Payment Volume (TPV) | $475.1B | $437.8B | $1.79T | $1.68T | Q4 +9% reported, +6% FXN; FY +7% reported, +6% FXN. |
| Active Accounts | 439M | 434M | 439M | 434M | Q4 +1% YoY; FY +1% YoY. |
| Payment Transactions | 6.8B | 6.6B | 25.4B | 26.5B | Q4 +2% YoY; FY ↓ 4% YoY. Ex-PSP, Q4 transactions grew 6%. |
| TPA (Trailing 12-Months) | 57.7 | 60.6 | 57.7 | 60.6 | Q4 ↓ 5% YoY. |
| TPA (ex-PSP, Trailing 12-Months) | — | — | — | — | Grew 5% in Q4, consistent with Q3 growth. |
A detailed breakdown of TPV growth reveals a significant slowdown in online branded checkout, offset by continued strength in Venmo, BNPL, and the accelerating PSP business.
| TPV Growth (Currency-Neutral) | Q4 2025 | Q3 2025 | Q4 2024 | Sequential Change | Notes |
|---|---|---|---|---|---|
| Total TPV | 6% | 7% | 7% | ↓ 1 ppt | — |
| Branded Experiences TPV | 4% | 8% | 6% | ↓ 4 ppts | Includes online checkout, debit cards, and Tap to Pay. |
| - Online Branded Checkout | 1% | 5% | 6% | ↓ 4 ppts | Management cited U.S. retail weakness, international headwinds (Germany), and deceleration in high-growth verticals. |
| - Debit Card & Tap to Pay | 60% | 65% | ~100% | ↓ 5 ppts | Continues to grow rapidly off a small base. |
| Venmo TPV | 13% | 14% | 10% | ↓ 1 ppt | Fifth consecutive quarter of double-digit growth. |
| - Pay with Venmo | 32% | 40% | — | ↓ 8 ppts | Continues to outpace the market. |
| BNPL TPV | 23% | >20% | 21% | Stable | Reached over $40 billion in TPV for full-year 2025. |
| P2P & Other Consumer | 10% | — | 6% | N/A | Growth reflects momentum in debit card and Venmo. |
| PSP Volume | 8% | 6% | 2% | ↑ 2 ppts | Growth accelerated, driven by a 12% increase in Enterprise Payments volume. |
Key operational ratios show a slight decline in transaction take rate, driven by mix shift towards lower-take-rate businesses like PSP and Venmo.
| Key Ratios | Q4 2025 | Q4 2024 | FY 2025 | FY 2024 | Change (Q4 YoY) |
|---|---|---|---|---|---|
| Transaction Take Rate | 1.65% | 1.73% | 1.66% | 1.77% | ↓ 8 bps |
| Transaction Expense Rate | 0.89% | 0.91% | 0.89% | 0.93% | ↓ 2 bps |
| Transaction & Credit Loss Rate | 0.08% | 0.10% | 0.10% | 0.09% | ↓ 2 bps |
| Transaction Margin %[1] | 46.5% | 47.0% | 46.6% | 46.1% | ↓ 50 bps |
Footnotes
- Transaction Margin % is a non-GAAP measure calculated as (Net Revenues - Transaction Expense - Transaction and Credit Losses) ÷ Net Revenues.
2. Forward-Looking Guidance
Management provided a cautious outlook for 2026, citing significant planned investments to revitalize branded checkout, which are expected to create a near-term headwind to transaction margin and EPS growth. Notably, the company has formally withdrawn the multi-year financial outlook provided at its February 2025 Investor Day, citing a more challenging macro environment, slower-than-expected product adoption, and internal execution gaps. The company will now provide guidance one year at a time.
A. Guidance Summary
| Metric | Period | Current Guidance | Prior Guidance | Change | Management Commentary |
|---|---|---|---|---|---|
| Revenue Growth (FXN) | Q1 2026 | Low single-digit | N/A | New | — |
| TM$ (ex-interest) | Q1 2026 | Decline slightly or roughly flat | N/A | New | Reflects the immediate impact of planned growth investments. |
| Non-Transaction OpEx | Q1 2026 | Mid-single-digit growth | N/A | New | — |
| Non-GAAP EPS | Q1 2026 | Down mid-single digits | N/A | New | Reflects pressure from investments and lower TM$ flow-through. |
| TM$ (ex-interest) | FY 2026 | Decline slightly or roughly flat | N/A | New | Guidance incorporates an approximate 3-point headwind from targeted growth investments. |
| Non-Transaction OpEx | FY 2026 | ~3% growth | N/A | New | Reflects ongoing cost management while funding key initiatives. |
| Non-GAAP EPS | FY 2026 | Down low single digits to slightly positive | N/A | New | Guidance reflects investment headwinds and a higher tax rate assumption. |
| Adjusted Free Cash Flow | FY 2026 | At least $6.0 Billion | N/A | New | — |
| Share Repurchases | FY 2026 | ~$6.0 Billion | N/A | New | Continues capital return program at a similar level to 2025. |
| Long-Term Outlook (2027) | FY 2027 | Outlook Withdrawn | HSD TM$ growth, Teens+ EPS growth | Withdrawn | Management stated it is "no longer committing to the specific outlook" due to a more demanding environment and slower execution than anticipated. |
B. Additional Notes & Commentary
- 2026 Investment Headwinds: The full-year guidance is significantly impacted by planned investments intended to drive long-term growth.
- These investments are expected to represent an approximate 3-point headwind to transaction margin dollar growth in 2026.
- Management noted the spending is critical to "fundamentally shifting our branded checkout product and positioning."
- Approximately two-thirds of the investment is targeted at branded checkout and BNPL, with the remainder allocated to areas like Venmo loyalty and agentic commerce.
- Branded Checkout Assumptions for 2026: Given the slower exit rate from Q4 2025 and the time required for investments to scale, the full-year guidance assumes slightly positive to low single-digit growth for online branded checkout.
- Withdrawal of Long-Term Targets: Management explicitly retracted its multi-year outlook from the February 2025 Investor Day. The key reasons cited were:
- A more demanding e-commerce environment than anticipated.
- Increased competitive intensity.
- Slower-than-expected merchant adoption and more complex product implementation.
- Internal execution that is "not yet where it needs to be."
- Additional FY2026 P&L Assumptions:
- Tax Rate: Assumed to be between 19% and 21%.
- Capital Expenditures: Expected to be approximately $1.0 billion.
- Other Value-Added Services (OVAS): Expected to be "flattish" for the year.
- Transaction Expense (TE): Expected at a rate of ~88 bps of TPV.
- Transaction Loss (TL): Expected to be in line with 2025 at ~7.5 bps of TPV.
3. Operational & Strategic Developments
The quarter was defined by a significant leadership transition and a strategic reset for the company's core branded checkout business, which experienced a material deceleration in growth. Management acknowledged execution shortfalls and outlined a more focused plan centered on high-impact merchants and improving the fundamental drivers of checkout preference: experience, presentment, and selection. While the core online checkout business faces challenges, other segments like Venmo, PSP, and BNPL continued to demonstrate strong momentum.
A. Business Performance & Operations
- Branded Checkout Deceleration: The most significant development was the sharp slowdown in online branded checkout TPV, which grew only 1% on a currency-neutral basis, a 4-point deceleration from the 5% growth reported in Q3 2025. This was attributed to U.S. retail weakness, international headwinds in Germany, a slowdown in high-growth verticals, and internal execution issues.
- Diversified Growth Drivers Show Resilience: In contrast to the branded checkout challenges, other business lines continued to perform well.
- Venmo: Full-year 2025 revenue grew approximately 20% to $1.7 billion (ex-interest income). In Q4, TPV grew 13%, with Pay with Venmo TPV up 32%.
- PSP/Enterprise Payments: PSP volume growth accelerated to 8% in Q4 from 6% in Q3, driven by a 12% acceleration in Enterprise Payments volume.
- BNPL: Delivered over $40 billion in TPV in 2025, with TPV growing more than 20% year-over-year.
- Customer Engagement Metrics: Core customer engagement remained stable, with transactions per active account (ex-PSP) growing 5%. "Power users" (accounts with >100 transactions per year) grew 5% year-over-year.
B. Strategic Initiatives
- Branded Checkout Overhaul: In response to underperformance, management is refocusing its strategy on three core priorities: Experience, Presentment, and Selection.
- Experience: The new approach is to deploy the redesigned checkout experience and biometric enablement together as a package. The goal is to increase "checkout-ready" consumers from 36% to nearly 50% by the end of 2026.
- Presentment: A renewed focus on securing competitive placement on merchant sites, including upstream BNPL messaging.
- Selection: Driving repeat usage through rewards programs like PayPal Plus, which is launching in the U.S. and Europe in 2026.
- Shift in Go-to-Market Approach: The company is pivoting from a broad approach to a "relentless focus on the highest impact merchants," which represent nearly 25% of current branded checkout volume.
- Agentic Commerce Investment: The company announced it has agreed to acquire Cymbio to bring its Store Sync technology in-house.
C. Risk Factors & Headwinds
- Guidance Reliability & Withdrawal of Long-Term Outlook (New & Major): A significant risk to investor confidence emerged as management missed its Q4 2025 guidance and formally withdrew the multi-year outlook from its 2025 Investor Day, citing macro, competitive, and execution factors.
- Execution Failures (Worsening & Confirmed): The primary theme of the call was the acknowledgement of significant execution shortfalls. Management stated, "our execution has not been what it needs to be. We have not moved fast enough." This confirms that the risk of a slow checkout redesign has materialized into a critical operational failure contributing to the CEO transition.
-
Competitive & Macro Pressures (Persistent): The company continues to face a challenging competitive landscape and a "choppy macro" environment, which is impacting its core consumer base.
-
Management Changes (New & Major): A significant leadership change was announced, driven by the need to accelerate execution.
- Alex Chriss has stepped down as President and CEO.
- Enrique Lores, the most recent Board Chair and former CEO of HP Inc., has been appointed as the new President and CEO, effective March 1, 2026.
- Jamie Miller will serve as Interim CEO until March 1.
- David Dorman has been appointed as the new independent Board Chair.
4. Q&A Session Key Themes
The Q&A session was dominated by the abrupt CEO transition and the significant slowdown in the core branded checkout business. Analysts focused on seeking assurance about strategic continuity, understanding the root causes of the execution failures, and probing the timeline and viability of the newly outlined turnaround plan.
A. Analyst Focus Areas
- CEO Transition & Strategic Continuity: The primary focus of the Q&A was the leadership change. Multiple analysts sought confirmation that the transition was driven by a need to fix execution, not strategy.
- Management Response: Management was unequivocal, stating the Board’s decision was "based on execution" because the company was moving "too slow." They emphasized that the incoming CEO, Enrique Lores, was deeply involved in formulating the current strategy and the 2026 operating plan as Board Chair.
- Branded Checkout Turnaround Plan: Analysts drilled down on the specifics of the plan to revive branded checkout, questioning how the company would drive merchant adoption where it had previously struggled.
- Management Response: A key learning identified was the failure of a broad, "one-size-fits-all" approach. The new strategy involves a "relentless focus on the highest impact merchants" with dedicated teams and a bundled deployment of the redesigned checkout and biometric enablement.
- Timeline for Recovery: A recurring question was the expected timing for these investments to yield a tangible recovery in branded checkout growth.
- Management Response: Management adopted a cautious stance, assuming "minimal in-year benefit" from these initiatives in the 2026 guidance and suggesting a recovery is more likely a late-2026 or 2027 event.
B. Key Challenges & Concerns
- Fundamental Viability of Branded Checkout: One analyst directly questioned whether the branded business could be turned around in the face of intensified competition, and raised the concern that a focus on "upstream presentment" could erode transaction margins.
- Management Response: Management pivoted to the company’s diversified growth model, highlighting that strong performance from Venmo, PSP, and credit provided resilience in 2025, implying there are "multiple ways we can win."
- Aggressiveness of Investment Strategy: Another analyst challenged the capital allocation strategy, asking why the company would not pause its $6 billion buyback program and go "all-in" on investing to fix the core business.
- Management Response: Management pushed back, arguing that the company must first prove it can execute effectively with its current investment budget before considering a more aggressive posture.
5. Strategic Themes & Inflection Points
The fourth quarter marked a critical inflection point for PayPal, characterized by an abrupt leadership change and a strategic reset driven by significant execution failures in its core branded checkout business. The company's narrative pivoted sharply from the "defense to offense" posture of the prior quarter to a more sober focus on foundational repair and disciplined execution.
A. Current Period Themes
- Narrative Shift: From Acceleration to Accountability: The dominant theme was a candid admission of operational shortfalls, with management stating, "our execution has not been what it needs to be." This represents a stark reversal from the confident "stabilization to acceleration" message in Q3.
- Leadership Reset for Execution: The appointment of a new CEO was explicitly framed as a move to instill greater operational discipline and accelerate execution, not to alter the underlying strategy.
- Operational Retrenchment: The company is retreating from a broad-based, "optimizing for every merchant" approach. The new operational focus is a "relentless" and narrowed concentration on high-impact merchants and the fundamental drivers of checkout preference: experience, presentment, and selection.
B. Future Considerations
- The 2026 Investment "Reset": Management has clearly signaled that 2026 will be a year of significant investment with suppressed profitability. The guidance for flat-to-slightly-down transaction margin dollars (ex-interest) and non-GAAP EPS reflects a deliberate trade-off of near-term results to fund a multi-year turnaround for branded checkout.
- Withdrawal of Long-Term Guidance: The formal retraction of the 2027 financial outlook is a material change, removing a key anchor for the long-term investment case and introducing significant uncertainty around the company's medium-term growth algorithm.
- Diversified Growth Engine as a Buffer: While the focus is on fixing the core, the continued strong performance of Venmo, PSP, and BNPL provides a crucial financial buffer and underscores the importance of this diversification as the company navigates its turnaround.
6. Key Items to Monitor Next Quarter
A. Prior Quarter Monitoring Review
Management provided updates on all key items from the previous quarter. The company provided significant clarity on its 2026 investment plans and confirmed continued momentum in Venmo. However, progress on the core checkout redesign was mixed, culminating in an acknowledgement of major execution failures that are now being addressed.
| Prior Item | Current Status | Management Commentary |
|---|---|---|
| Agentic Commerce Initiative Execution | On Track | The company continues to invest in this area, announcing its intent to acquire Cymbio to bring its Store Sync technology in-house. Integrations with Microsoft Co-Pilot and Perplexity went live. Management reiterated this will not materially impact 2026 growth. |
| Pacing of Redesigned Checkout Rollout | Mixed Progress | Coverage of the redesigned paysheet experience increased from ~25% to over 30% of global checkout transactions. However, management acknowledged a critical execution failure: deploying the new experience without bundled biometric enablement, which diluted the potential conversion lift. The new strategy is to deploy them together. |
| Venmo Multi-Product Adoption & ARPA Growth | Achieved | Venmo continued its strong monetization trajectory. In Q4, Pay with Venmo MAAs grew 26% and Venmo debit card MAAs grew 50%. TPV for these products grew 32% and over 50%, respectively, validating strong multi-product adoption. |
| Clarity on 2026 Investment Headwinds | Achieved | Management provided significant detail, quantifying the investment as an approximate 3-point headwind to 2026 TM$ growth. The formal FY2026 guidance for TM$ (decline slightly or roughly flat ex-interest) and non-GAAP EPS (down LSD to slightly positive) fully incorporates this impact. |
| U.S. vs. International Branded Checkout Growth | Update Provided | Management provided a breakdown of the 4-point deceleration in branded checkout growth, attributing it to U.S. retail weakness, international headwinds (specifically Germany), and a slowdown in high-growth verticals. This indicates challenges in both domestic and international markets. |
B. Current Quarter Focus Items
The following table identifies the most material non-guidance catalysts, risks, and strategic milestones that warrant close monitoring following the company's leadership transition and strategic reset.
| Category | Item | Timeline | What to Monitor | Why It Matters |
|---|---|---|---|---|
| Strategic / Risk | Execution of Branded Checkout Turnaround Plan | Next Quarter / Ongoing | Early results from the new focus on "high-impact merchants". Any commentary on the adoption rate and performance (conversion lift) of the newly bundled "experience and biometrics" package. | The company’s credibility and medium-term growth depend on proving this refocused turnaround strategy can stabilize and re-accelerate its largest profit contributor after prior execution failures led to a CEO change. |
| Leadership / Execution | New CEO's Impact on Operational Cadence | Q2 2026 Onward | Tangible evidence of "faster decision-making" and "clear prioritization" following the start of the new CEO, Enrique Lores, on March 1. Any changes in resource allocation or strategic emphasis. | The Board’s rationale for the leadership change was to fix a culture of slow execution. Demonstrating a measurable improvement in operational discipline is critical to restoring investor confidence. |
| Operational | Adoption of "Checkout-Ready" Consumer Status | Ongoing / FY 2026 | Progress toward the stated goal of bringing nearly 50% of consumers to "checkout-ready" status (i.e., enabled with biometrics) by year-end 2026, up from the current 36%. | Biometric enablement is the key to unlocking the promised 2 to 5-point conversion improvement in the redesigned checkout. Hitting this consumer adoption target is a critical dependency for the entire merchant-facing turnaround plan. |
| Opportunity | Resilience of Diversified Growth Drivers | Next Quarter / Ongoing | Sustained momentum in Venmo, PSP, and BNPL. Specifically, monitor for continued double-digit TPV growth in Venmo and BNPL, and mid-to-high single-digit volume growth in PSP. | With the core branded business in a multi-quarter reset, these businesses provide a crucial financial buffer and an alternative growth narrative. Their performance is essential to meeting even the suppressed 2026 guidance. |
| Risk | Merchant Adoption of New Partnership Model | Ongoing | Announcements of new or expanded partnerships with the targeted "high-impact merchants." Any qualitative feedback on the new approach of tying economics directly to performance. | The previous rollout failed partly due to slower-than-expected merchant adoption. Success now hinges on convincing key merchants to prioritize PayPal’s new integrations over competing initiatives, which requires a more compelling and collaborative value proposition. |
Appendix: Quotes by Theme
Management Sentiment & Strategic Confidence
-
Acknowledgement of Execution Failures: Management's tone shifted dramatically from "offense" and "acceleration" in the prior quarter to a candid admission of significant operational shortfalls, which was the primary driver for the CEO transition.
"We recognize as a company that our execution has not been what it needs to be. We have not moved fast enough or with the level of focus required, and we are taking immediate steps to address that reality." — Jamie Miller, Interim CEO
vs. Q3-FY25:
"We've moved this business from defense to offense, from stabilization to acceleration. We know exactly where the opportunities are, and we are laser-focused on executing our strategy." — Alex Chriss, then-CEO
-
CEO Transition Framed as an Execution, Not Strategy, Change: In response to direct analyst questions, management emphasized that the leadership change is intended to accelerate the existing plan with more discipline, not to pivot to a new strategy.
"The Board's decision is based on execution... our execution is just too slow. And both the Board and Enrique have been deeply involved in setting our plans strategically and around our initiatives, and that carries into what our execution plan is in 2026." — Jamie Miller, Interim CEO (Q&A)
-
Withdrawal of Long-Term Guidance: The company formally retracted its multi-year outlook, citing a combination of external pressures and internal execution gaps, representing a material reset of investor expectations.
"Given everything I've outlined, we are no longer committing to the specific outlook for 2027 we laid out at Investor Day last year. For these reasons, we think it's prudent for now to provide financial guidance 1 year at a time." — Jamie Miller, Interim CEO
vs. Q3-FY25:
"All of this gives us confidence in the business's longer-term growth potential and ability to deliver high single-digit transaction margin dollar growth and non-GAAP EPS growth in the teens or better over the longer term." — Alex Chriss, then-CEO
Business Strategy & Transformation Signals
-
Branded Checkout Turnaround Plan: A More Focused Approach: The strategy for fixing the core branded checkout business has been narrowed to three pillars—Experience, Presentment, and Selection—with a significant shift from a broad to a highly targeted merchant focus.
"I think one of the big things we learned was that we have been trying to do this across all merchants all at the same time. And what we have done now is really reformulated our teams around dedicated, mission-based teams particularly for high-impact merchants." — Jamie Miller, Interim CEO (Q&A)
-
Correcting a Key Execution Error in Product Rollout: Management identified a critical flaw in its prior rollout strategy—deploying its redesigned checkout without bundled biometric enablement—and is now correcting the approach.
"In too many cases, we were deploying our redesigned checkout without biometric enablement, which does not deliver the full conversion lift we know we can provide. That's changing. We're now deploying experience and biometrics together as a package more consistently." — Jamie Miller, Interim CEO
vs. Q3-FY25 (where the delay was acknowledged but the root cause was not detailed):
"We're moving quickly, but untangling a decade or more of legacy integrations is complex and taking more time than planned." — Alex Chriss, then-CEO
-
The 2026 Investment "Reset": Management clearly framed 2026 as a year of investment to fix the foundation, deliberately trading near-term profitability for long-term stabilization and growth in branded checkout.
"For 2026, we expect these targeted growth investments to represent approximately 3 points of headwind to TM dollar growth... While a portion of these investments result in lower upfront economics that will weigh on TM dollar and EPS growth in 2026, they are critical to fundamentally shifting our branded checkout product." — Steven Winoker, Chief Investor Relations Officer
Analyst Sentiment & Market Perception
-
Analyst Focus Shifts from New Opportunities to Foundational Execution: The Q&A session's focus pivoted sharply from long-term opportunities like agentic commerce in Q3 to immediate concerns about the CEO transition, execution failures, and the viability of the core business.
"Just you went through a lot. I wanted to ask on just the change in the CEO and the timing here. Just maybe, Jamie, can you give us some assurance that the change is primarily to address execution rather than the strategy?" — Tien-Tsin Huang, JPMorgan (First question of Q&A)
vs. Q3-FY25:
"I just want to ask about agentic commerce... Has agentic commerce changed PayPal Holdings, Inc.'s strategic priorities in any way? What's your right to win?" — Tien-Tsin Huang, J.P. Morgan Payments (First question of Q&A)
-
Challenging the Viability of the Branded Business: Analysts directly questioned whether the branded checkout business can be turned around in the face of intense competition, prompting management to defend its diversified business model.
"I think a question which is in investors' minds is whether the branded business can be turned around or is the shift has tailed... Can PayPal grow earnings if branded doesn't improve from here?" — Harshita Rawat, Bernstein (Q&A)
-
Questioning Capital Allocation Amid Turnaround: Analysts challenged the decision to continue a large share buyback program instead of redirecting all available capital to fix the core business.
"The key question I'm asking and we're getting from a lot of investors is, why not just focus 100% on the merchant and just kind of drive as much growth as you can?... What prevents you from just going all in on that one?" — Dan Dolev, Mizuho (Q&A)
Operational Inflection Points
-
Diversified Growth Engine as a Key Stabilizer: Management repeatedly highlighted the strong performance of its non-branded businesses as proof of the company's resilience and ability to generate growth even while the core business is underperforming.
"I think one thing that 2025 really illustrated for us is that we do have really strong assets across the board between Venmo, PSP, debit and credit... even with a low mid-single-digit branded checkout profile in 2025, we delivered very solid transaction margin dollar growth. We delivered mid-teens earnings per share growth. And so I think there continues to be a lot of ways we can win here." — Jamie Miller, Interim CEO (Q&A)
Historical Performance