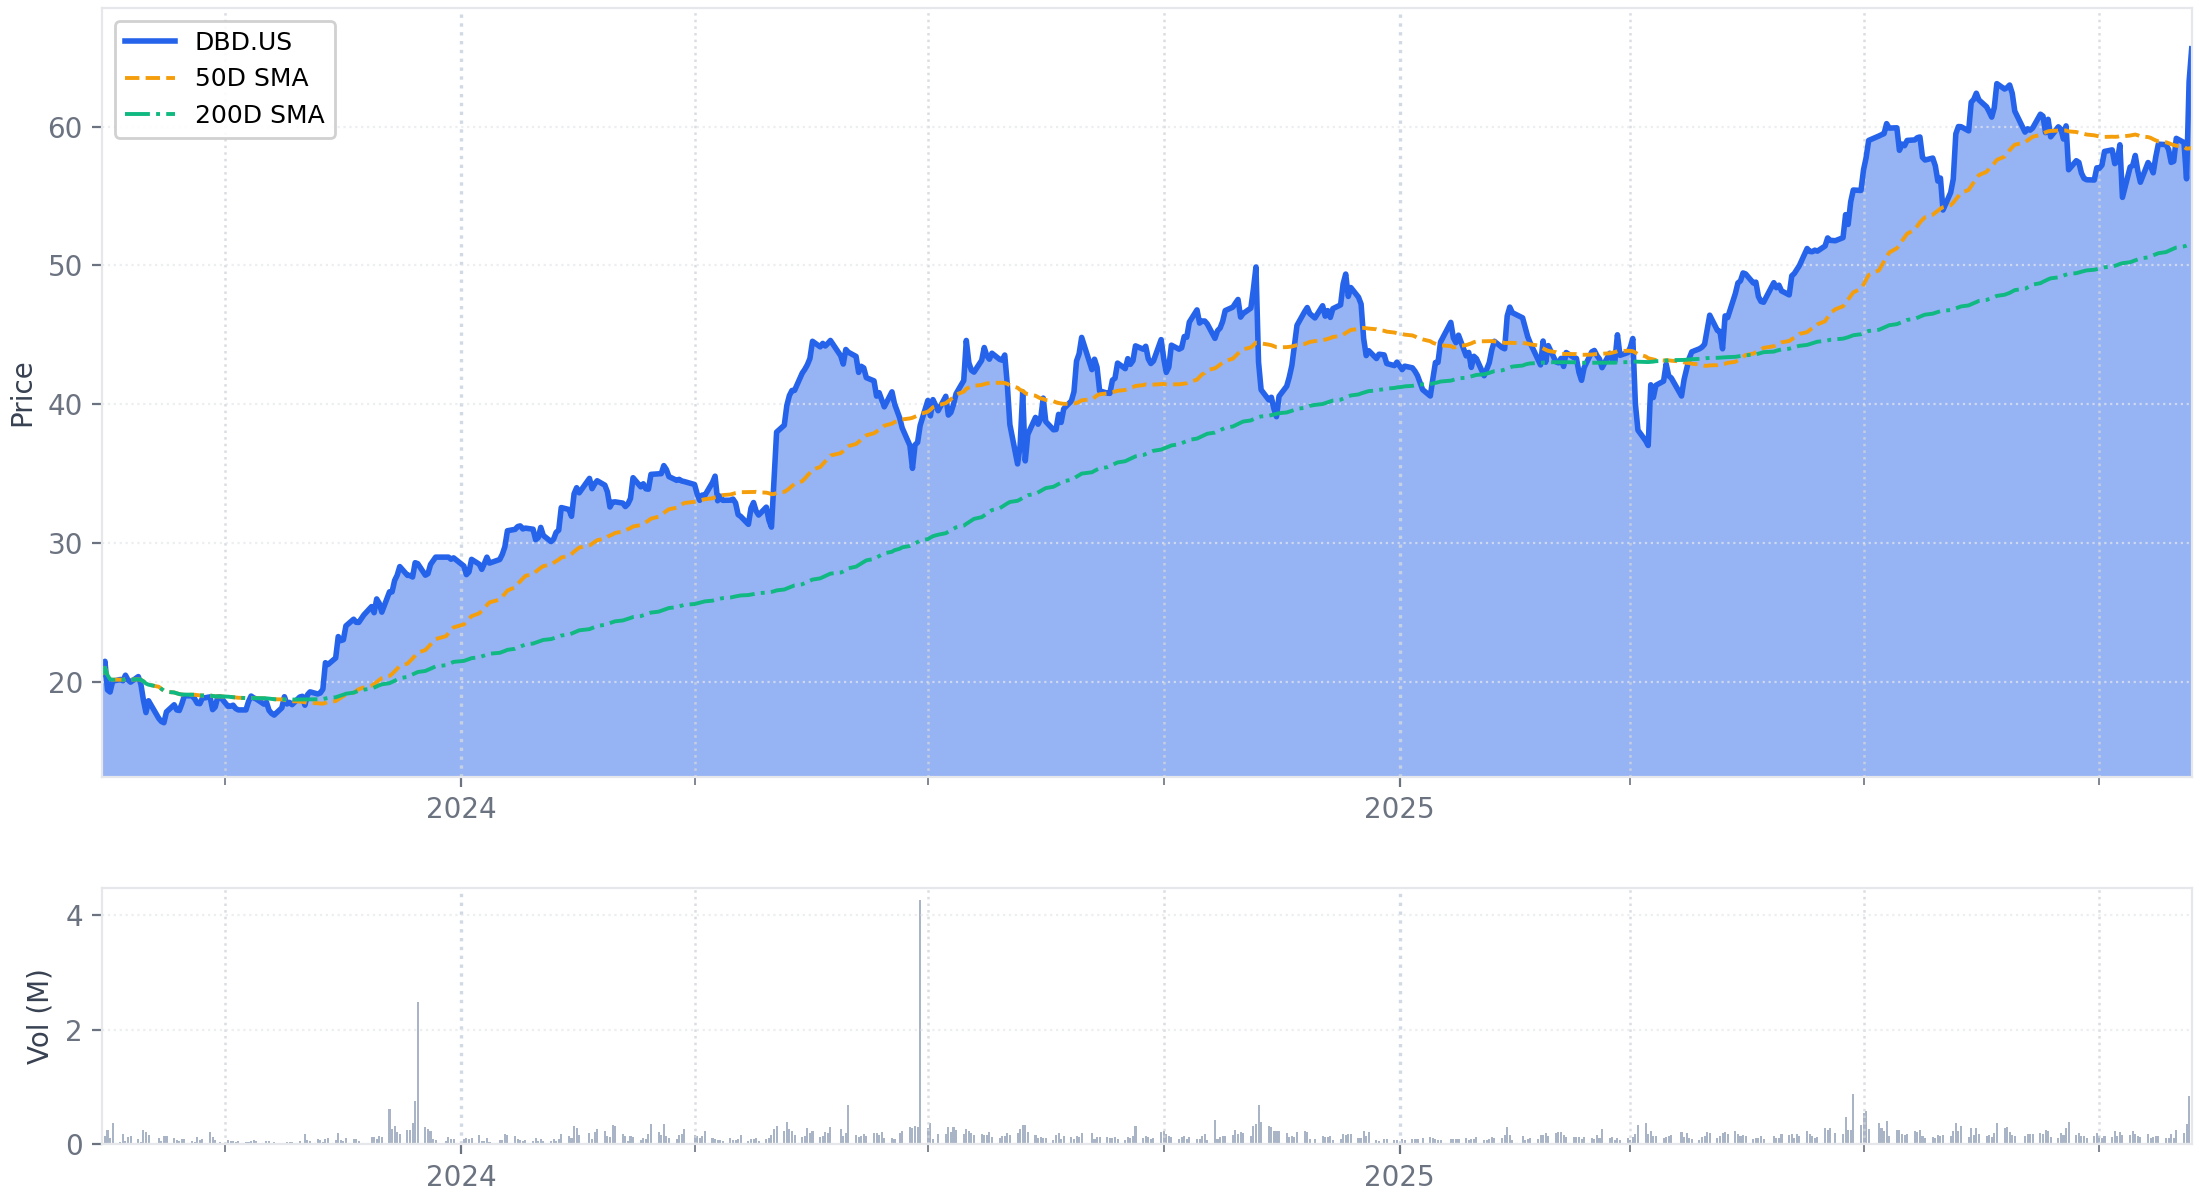
Executive Summary
Diebold Nixdorf reaffirmed its full-year 2025 guidance, reiterating that it is trending toward the higher end of its ranges for revenue, Adjusted EBITDA, and free cash flow. The company reported Q3 revenue of $945.2 million, up 2.0% YoY, driven by a strong recovery in its Retail segment, where revenue grew 8% YoY and product orders surged 40% YoY. Profitability saw a significant increase, with Adjusted EPS reaching $1.39, a substantial rise from $0.19 in the prior-year period, supported by a lower effective tax rate.
The company achieved a new record with its fourth consecutive quarter of positive free cash flow, generating $24.5 million in Q3. This robust cash performance enabled the completion of its initial $100 million share repurchase program and the immediate authorization of a new, larger $200 million program, signaling strong confidence in future cash generation.
Operational results highlighted strategic flexibility, as strong product margins and disciplined cost controls funded a deliberate $10 million acceleration in service investments aimed at improving long-term capabilities. The quarter's performance validates the retail recovery, confirms a structural improvement in cash flow, and demonstrates the company's ability to fund future growth while increasing shareholder returns.
1. Financial Performance Summary
A. Income Statement Metrics
Diebold Nixdorf reported Q3 2025 non-GAAP revenue of $945.2 million, an increase of 2.0% year-over-year (-0.9% in constant currency). The growth was driven by an 8% YoY revenue increase in the Retail segment, which management noted is gaining momentum. Non-GAAP gross margin expanded by 10 basis points to 26.2%, supported by a 140 basis point improvement in product gross margin due to favorable geographic mix and pricing. Adjusted EBITDA rose 3.7% to $121.9 million, with the margin expanding by 20 basis points to 12.9%. Adjusted EPS grew significantly to $1.39, up from $0.19 in the prior-year period.
| Metric (Non-GAAP)[1] | Q3 2025 | Q3 2024 | Change | Notes |
|---|---|---|---|---|
| Total Revenue | $945.2M | $927.1M | ↑ 2.0% | Revenue declined 0.9% in constant currency. The result beat the implied guidance range of ~$875M-$924M, derived from the prior quarter's H2 revenue split guidance. |
| Banking | $690.2M | $690.6M | ↓ 0.1% | In constant currency, Banking revenue was down 2.1%. |
| Products | $288.2M | $290.1M | ↓ 0.7% | — |
| Services | $402.0M | $400.5M | ↑ 0.4% | — |
| Retail | $255.0M | $236.5M | ↑ 7.8% | In constant currency, Retail revenue was up 2.7%, reflecting a strong second-half recovery. |
| Products | $112.8M | $95.3M | ↑ 18.4% | — |
| Services | $142.2M | $141.2M | ↑ 0.7% | — |
| Gross Profit | $247.9M | $242.3M | ↑ 2.3% | Gross margin was 26.2%, up 10 bps YoY but down 30 bps sequentially. |
| Products | $109.8M | $100.3M | ↑ 9.5% | Product gross margin was 27.4%, up 140 bps YoY, driven by pricing and favorable mix. |
| Services | $138.1M | $142.0M | ↓ 2.7% | Service gross margin was 25.4%, down 80 bps YoY due to accelerated investments in field services software and personnel. |
| Banking Gross Profit | $184.8M | $183.7M | ↑ 0.6% | Banking gross margin was 26.8%, up 20 bps YoY. |
| Retail Gross Profit | $63.1M | $58.6M | ↑ 7.7% | Retail gross margin was 24.7%, down 10 bps YoY but up 100 bps sequentially. |
| Operating Profit | $86.7M | $83.0M | ↑ 4.5% | Operating margin was 9.2%, an increase of 20 bps YoY. |
| Net Income (Loss) (GAAP) | $41.7M | ($21.7)M | N/M | — |
| Adjusted Net Income | $51.5M | $5.8M | ↑ 787.9% | — |
| Adjusted EPS | $1.39 | $0.19 | ↑ 631.6% | A lower non-GAAP effective tax rate of 19% in the quarter contributed to the growth. |
| Adjusted EBITDA | $121.9M | $117.5M | ↑ 3.7% | Adjusted EBITDA margin was 12.9%, up from 12.7%. The result met the low end of the implied guidance range of ~$122M-$131M, based on the prior quarter's H2 split guidance. |
Footnotes
- Metrics are presented on a non-GAAP basis as per the company's Q3 2025 earnings release to align with management's discussion.
B. Balance Sheet Highlights
The company ended the quarter with $280.0 million in cash and short-term investments. Total debt stood at $967.8 million, resulting in a net debt position of $687.8 million. Management highlighted a "fortress balance sheet" with total liquidity of approximately $590 million, including an untapped $310 million revolving credit facility. The net leverage ratio remains within the company's target range of 1.25x to 1.75x.
| Metric | Sep 30, 2025 | Dec 31, 2024 | Change | Notes |
|---|---|---|---|---|
| Cash, Cash Equivalents & Short-Term Investments | $280.0M | $328.2M | ↓ $48.2M | — |
| Total Debt[1] | $967.8M | $966.0M | ↑ $1.8M | Total debt outstanding was effectively unchanged from year-end. |
| Net Debt[2] | $687.8M | $637.8M | ↑ $50.0M | — |
| Trade Receivables, net | $580.1M | $588.5M | ↓ $8.4M | Management reported a 9-day YoY improvement in Days Sales Outstanding (DSO). |
| Inventories | $599.7M | $528.1M | ↑ $71.6M | Management reported an 11-day YoY improvement in Days Inventory Outstanding (DIO). |
| Shareholders' Equity | $1,112.4M | $938.2M | ↑ $174.2M | — |
Footnotes
- Total Debt is sourced from the Net Debt reconciliation table in the company's Q3 2025 earnings release (Note 3).
- Net Debt is calculated as Total Debt less Cash, Cash Equivalents, Restricted Cash, and Short-Term Investments. Q3 2025: $967.8M - $280.0M = $687.8M. Q4 2024: $966.0M - $328.2M = $637.8M.
C. Cash Flow Analysis
Diebold Nixdorf generated $43.3 million in free cash flow for the first nine months of 2025, a significant improvement from a use of $77.4 million in the prior-year period. Management noted this was the fourth consecutive quarter of positive free cash flow, a new company record. The company completed its $100 million share repurchase program during the quarter and announced a new $200 million authorization.
| Metric (Nine Months Ended) | YTD Q3 2025 | YTD Q3 2024 | Change | Notes |
|---|---|---|---|---|
| Net Cash from Operations | $83.2M | ($47.0)M | ↑ $130.2M | Improvement driven by higher profitability and better working capital management. |
| Capital Expenditures | ($22.6)M | ($12.2)M | ↑ $10.4M | — |
| Capitalized Software Development | ($17.3)M | ($18.2)M | ↓ $0.9M | — |
| Free Cash Flow[1] | $43.3M | ($77.4)M | ↑ $120.7M | Q3 FCF of $24.5M nearly doubled sequentially and beat prior guidance of being "similar to Q2" ($13M). |
| Share Repurchases[2] | ($79.6)M | $0.0M | ↓ $79.6M | The company repurchased ~$39.5M in Q3, completing its $100M program. A new $200M program was announced. |
Footnotes
- Free Cash Flow is a non-GAAP measure defined by the company as Net Cash from Operating Activities ($83.2M) less Capital Expenditures ($22.6M) and Capitalized Software Development ($17.3M).
- Represents "Treasury share activity" from the Statement of Cash Flows in the Q3 2025 filing.
D. Key Financial Ratios
| Metric | Q3 2025 | Notes |
|---|---|---|
| Net Leverage Ratio | Within 1.25x - 1.75x range | Management-stated figure. |
E. Operational Metrics
The company's product backlog decreased sequentially as planned deliveries were executed, partially offset by strong order growth. Order entry accelerated significantly compared to the prior quarter, driven by strength in both Banking and Retail.
| Metric | Q3 2025 | Q2 2025 | Change | Notes |
|---|---|---|---|---|
| Product Backlog | ~$920M | ~$980M | ↓ ~$60M | The decrease was expected due to planned deliveries, providing visibility for a strong Q4. |
| Product Order Entry | Up 25% YoY | Up 10% YoY | Acceleration | Growth was driven by strong demand in both Banking and Retail, with Retail orders up 40% YoY. |
2. Forward-Looking Guidance
A. Guidance Summary
Diebold Nixdorf reaffirmed its full-year 2025 financial guidance, maintaining its key targets while signaling continued confidence by stating it is trending toward the higher end of its ranges for revenue, Adjusted EBITDA, and free cash flow. The company lowered its full-year non-GAAP effective tax rate guidance, citing favorable tax law changes in Germany. Management also reiterated its long-term financial targets through 2027.
| Metric | Period | Current Guidance | Prior Guidance | Change | Management Commentary |
|---|---|---|---|---|---|
| Total Revenue | FY 2025 | Flat to up low-single digits | Flat to up low-single digits | Maintained | The company continues to trend toward the higher end of the range. |
| Adjusted EBITDA | FY 2025 | $470M – $490M | $470M – $490M | Maintained | Management also stated it is trending toward the higher end of the range, with line of sight to "one of the strongest Q4s in recent history." |
| Free Cash Flow | FY 2025 | $190M – $210M | $190M – $210M | Maintained | The company is trending toward the higher end of the range and remains on track to deliver over $200M in FCF for the year. |
| Non-GAAP Tax Rate | FY 2025 | 35% – 40% | 40% – 45% | Lowered | The reduction is primarily driven by the announcement of lower tax rates in Germany. |
| Long-Term Targets | By 2027 | ~$15% Adj. EBITDA margins; 60%+ FCF conversion; $800M cumulative FCF | ~$15% Adj. EBITDA margins; 60%+ FCF conversion; $800M cumulative FCF | Reaffirmed | Management stated the company is "firmly on track" to deliver on its 3-year plan objectives. |
B. Additional Notes & Commentary
-
Margin Outlook:
- Service Margin: Full-year 2025 service margins are now expected to be comparable to last year (approx. 26%). This is a revision driven by a deliberate decision to accelerate and increase investments of approximately $10 million (split between Q3 and Q4) in field services software, new technicians, and facility consolidation in Europe.
- Product Margin: The company remains on track to exceed the 50 basis point year-over-year improvement projected at its Investor Day.
- Q4 Gross Margin: Management expects total gross margin in Q4 to be at a "pretty similar run rate" to Q3. Retail gross margin is expected to see sequential improvement into Q4.
-
SG&A Savings: The company is on track to achieve at least $50 million in SG&A run-rate reductions in 2026, based on a comprehensive review that identified over 200 cost-saving actions.
-
Capital Allocation:
- The company completed its $100 million share repurchase program initiated in February 2025.
- A new $200 million share repurchase program was announced, with management intending to maintain a similar pace of execution as the prior program. This reflects confidence in the company's cash flow generation and a view that the stock is undervalued.
3. Operational & Strategic Developments
A. Business Performance & Operations
-
Banking Segment Performance: Management reported solid, steady performance, highlighting geographic diversity as a key strength.
- North America: The market remains steady, with the ATM refresh cycle progressing. Cash recyclers are now the standard product sold in the region, and the company sees a significant opportunity to drive growth through its new Branch Automation Solutions and teller cash recyclers (TCRs).
- Europe: Management described Europe as having a "blockbuster year," with the company gaining market share and securing strong orders across major markets.
- Asia Pacific & Middle East: The strategy to re-enter markets like India and introduce fit-for-purpose devices is yielding positive results. The company reported winning new business, which is beginning to reverse a previously shrinking installed base and creates future opportunities for recurring service and software revenue.
- Latin America: Performance was weaker than anticipated, attributed to "political turmoil" that has made banks more cautious. Management remains optimistic about a future recovery in the region.
-
Retail Segment Performance: The segment demonstrated a strong recovery in the second half of the year, consistent with management's prior guidance.
- Commercial Momentum: Revenue grew 8% year-over-year, and order entry increased by 40% YoY, reflecting solid demand and execution. The company noted important new wins with key customers for both point-of-sale (POS) and self-checkout (SCO) systems.
- AI-Powered Solutions (Vynamic SmartVision): The solution continues to gain traction, with management citing "overwhelmingly positive" feedback. The technology is now live in over 50 stores, and the company is expanding its use cases from produce recognition to addressing shrinkage at both self-checkout and manned lanes.
- North America Outlook: Management remains optimistic about its efforts to penetrate the North American retail market, highlighting an increasing number of proof-of-concepts, including testing in "dark stores" with large grocers. The primary challenge remains unseating long-standing incumbents.
-
ATM Refresh Cycle Cadence: Management reaffirmed that an annual replacement pace of approximately 60,000 units is the correct way to model the ongoing ATM refresh cycle. These are new placements of modern cash recyclers, not upgrades of older machines.
B. Strategic Initiatives
-
Branch Automation Solutions (BAS) Launch: The company formally launched its comprehensive BAS portfolio at its Intersect customer event. The strategy integrates hardware (ATMs, TCRs), software, and services to manage the entire branch cash ecosystem. Management noted that large banks are leading the adoption, which is generating increased interest from smaller regional banks and credit unions.
-
Strategic Tuck-in Acquisition: The company completed a small, targeted acquisition to enhance its multi-vendor service capabilities in the U.S. The acquired skillset allows Diebold Nixdorf to service and repair competitors' branch equipment, addressing a key customer request for a single service provider during the multi-year transition to a full DN branch automation environment.
-
Lean & Continuous Improvement: The company continues to embed lean principles across the organization, extending beyond manufacturing into operational and field service processes. Examples cited include an optimized invoicing process in France that accelerated collections and a logistics network redesign expected to generate meaningful cost savings.
-
Capital Allocation: The company is accelerating its return of capital to shareholders, reflecting strong confidence in its cash generation and long-term value. The Board authorized a new $200 million share repurchase program after the initial $100 million program was completed.
C. Risk Factors & Headwinds
-
Financial Health Indicators:
- Balance Sheet Strength: The company's financial position was further validated during the quarter by a credit rating upgrade from S&P Global to B+. Management continues to emphasize its "fortress balance sheet," with net leverage remaining within its target range of 1.25x to 1.75x and liquidity of approximately $590 million.
- Cash Generation: The company achieved its fourth consecutive quarter of positive free cash flow, a new company record that demonstrates a sustained structural improvement in its ability to generate cash. Q3 free cash flow of $24.5 million significantly exceeded prior guidance of being "similar to Q2" ($13 million).
- Guidance Reliability: Diebold Nixdorf reaffirmed its full-year 2025 guidance and reiterated that it is trending toward the higher end of its key metric ranges. The company's Q3 revenue and free cash flow performance exceeded the implied guidance from the prior quarter, enhancing the credibility of its forecasts.
-
Operational Challenges:
- Service Margin Investment (Persistent/Revised Outlook): Service gross margin declined 80 basis points year-over-year due to a deliberate decision to accelerate approximately $10 million in investments (split between Q3/Q4) into service capabilities. Management framed this as a strategic choice enabled by strong performance in product margins and OpEx controls. As a result, management has revised its full-year 2025 service margin outlook to be "comparable to last year," a change from the previous goal of exiting Q4 with a 100-basis-point year-over-year improvement.
- Retail Market Penetration (Persistent): While the retail business is showing strong recovery momentum, particularly in Europe, the effort to gain significant share in the North American market remains a long-term initiative focused on unseating entrenched competitors.
- Latin America Macro Headwinds (New): Management identified political and economic instability in Latin America as a near-term headwind that has caused banks in the region to become more cautious with spending, impacting the Banking segment's performance in 2025.
-
Reporting and Transparency Issues:
- Unit Shipment Disclosure (Persistent): Consistent with past practice, the company does not disclose unit shipment volumes for its ATM and retail systems, which limits direct visibility into market share trends and volume-mix dynamics.
4. Q&A Session Key Themes
A. Analyst Focus Areas
-
Strategic Investments vs. Margin Impact: The lead question focused on the $10 million in accelerated investments in the service business and its impact on profitability. Analysts sought to understand the trade-off between near-term margin dilution and long-term capability. Management framed this as a strategic decision enabled by outperformance in product margins and OpEx, highlighting their "multiple ways to win" and operational flexibility.
-
Retail Recovery & North American Progress: Analysts continued to probe the progress of the North American retail strategy. A question highlighted the absence of specific KPIs (proofs-of-concept, pilots) that were disclosed in previous calls. Management responded with qualitative updates, noting tests in "dark stores" with large grocers.
-
ATM Geographic Demand: Consistent with previous calls, an analyst requested a region-by-region update on ATM demand, which management provided in detail.
-
Capital Allocation & Share Buyback: The announcement of a new $200 million share repurchase program prompted questions about its expected pace. Management signaled an intent to maintain the momentum of the recently completed program.
-
Growth Sustainability: Analysts sought to confirm the durability of the core ATM business. Management reaffirmed that an annual replacement pace of approximately 60,000 units remains the correct assumption.
B. Key Challenges & Concerns
The overall tone of the Q&A session was constructive, with analysts focused on clarifying details and understanding the substance behind management's optimistic outlook. There were no direct challenges to the company’s guidance or strategic direction.
-
The closest to a challenge was an analyst noting the absence of specific retail KPIs (e.g., number of pilots) that had been a feature of recent quarterly updates. This was a subtle probe for more concrete evidence of progress in the North American retail market.
-
Balance Sheet Concerns (Notable Absence): For the fourth consecutive quarter, there were no analyst questions concerning the company's debt, leverage, liquidity, or free cash flow generation. This continued absence confirms that the "fortress balance sheet" narrative is fully accepted by the market and that analyst focus has decisively shifted to operational execution and strategic growth initiatives.
5. Strategic Themes & Inflection Points
A. Current Period Themes
-
Dominant Narratives: The central theme has evolved to "Operational Flexibility and Confident Capital Return." Management repeatedly emphasized having "multiple ways to win," framing the decision to accelerate service investments as a strategic choice enabled by outperformance in product margins and OpEx controls. The completion of the first buyback and immediate launch of a larger, new $200 million program solidifies a confident capital return policy as a core pillar of the company's value proposition.
-
Operational Focus: The operational priority remains "Lean and Service Excellence." The application of lean principles is demonstrably expanding beyond manufacturing into back-office and logistics functions. The deliberate, quantified $10 million acceleration of investment in the service organization underscores a commitment to achieving a premier service level.
-
Shift in Service Margin Outlook: A notable change from the prior quarter is the revision of the service margin outlook. The previous goal of exiting Q4 with a 100-basis-point year-over-year improvement has been replaced with an expectation for margins to be "comparable to last year," framed as a strategic reallocation of funds.
B. Future Considerations
-
Emerging Opportunities:
- Branch Automation Solutions (BAS): The formal launch of the BAS portfolio marks its transition from a conceptual strategy to a tangible go-to-market initiative. The supporting tuck-in acquisition for multi-vendor services is a critical enabler.
- Retail AI Expansion: The Vynamic SmartVision solution continues to mature, with management now highlighting an expansion of use cases to address the broader, high-priority issue of retail shrink.
-
Transformation Initiatives:
- Sustained Capital Return: The new $200 million share repurchase authorization signals that returning capital is a programmatic part of the company's long-term strategy.
- SG&A Cost Structure: The company confirmed it is on track to deliver at least $50 million in run-rate SG&A savings in 2026.
-
Comparison with Prior Periods:
- Retail Recovery Narrative: The story has advanced from "forecasting a firm recovery" in Q2 to "delivering a strong recovery" in Q3, validated by an 8% YoY revenue increase and a 40% surge in order entry.
6. Key Items to Monitor Next Quarter
A. Prior Quarter Monitoring Review
Management provided updates on all key items identified in the previous quarter. The company successfully delivered on its second-half retail recovery and progressed on its strategic initiatives. The service margin trajectory was revised due to a deliberate decision to accelerate investments.
| Prior Item | Current Status | Management Commentary |
|---|---|---|
| Opportunity: Second-Half Retail Recovery | Achieved | The recovery materialized as guided. Management reported that the second half inflection "gained momentum," with Retail revenue growing 8% YoY and gross margin improving 100 bps sequentially in Q3. |
| Operational: Teller Cash Recycler (TCR) Adoption | On Track | Following the formal launch of its Branch Automation Solutions, the company has "successfully rolled out teller cash recycling solutions to our first customers." Management noted increased interest from smaller banks following positive feedback from larger institutions. |
| Operational: Service Margin Trajectory | Delayed | The previous goal of exiting Q4 with a 100 bps YoY margin improvement was revised. Management is now guiding for full-year service margins to be "comparable to last year" due to a strategic decision to accelerate ~$10 million in investments in service capabilities during H2 2025. |
| Strategic: $50M Annual OpEx Reduction Program | On Track | The company has identified over 200 specific actions and reaffirmed it is on track to deliver at least $50 million in SG&A run-rate savings in 2026. |
| Opportunity: North America Retail Pipeline Conversion | On Track | No new major contracts were announced, but progress continued. The number of stores with live Vynamic SmartVision deployments increased from 18 to over 50, and the company is now testing its solutions in "dark stores at some large grocers." |
B. Current Quarter Focus Items
Based on the Q3 2025 discussion, the following non-guidance items are critical for monitoring the company's strategic execution and operational trajectory in the upcoming quarters.
| Category | Item | Timeline | What to Monitor | Why It Matters |
|---|---|---|---|---|
| Strategic | Pace of New $200M Share Repurchase | Next Quarter / Ongoing | The quarterly dollar amount of shares repurchased in Q4. Management has signaled an intent to "maintain that same level of buyback" seen in recent quarters, implying a potentially accelerated pace. | The execution pace is a key indicator of management's confidence in sustained free cash flow generation, its view on the stock's valuation, and its commitment to shareholder returns. |
| Operational | Service Investment ROI & Margin Recovery | Next 1-2 Quarters | Commentary on improvements in Service Level Agreement (SLA) performance and customer satisfaction following the accelerated investments, and the service margin trajectory heading into 2026. | Having deliberately lowered the 2025 margin target to fund ~$10M in investments, it is critical to see if this spend translates into a stronger competitive position and a return to margin expansion in 2026. |
| Opportunity | Branch Automation Solutions Commercialization | Next 1-2 Quarters | Announcements of new customer wins for the integrated Branch Automation portfolio, particularly the conversion of interest from smaller regional banks and credit unions into firm orders for Teller Cash Recyclers (TCRs). | The formal launch and initial rollouts are complete. Securing the next wave of adopters will validate this as a material new growth vector beyond the core ATM refresh cycle and demonstrate successful cross-selling. |
| Risk | Latin America Market Stabilization | Ongoing | Management commentary on demand trends and bank spending sentiment in Latin America. Any signs of stabilization or further deterioration, and specifically, progress on large government RFPs in Brazil. | Management explicitly identified Latin America as a weak spot due to political turmoil. A prolonged downturn could act as a headwind to overall Banking segment growth, offsetting strength in other regions. |
| Operational | North American Retail Progress from Pilots to Contracts | Next 2-3 Quarters | The announcement of a significant, multi-store rollout contract with a major North American retailer, which would mark the next crucial step beyond the current pilot and initial live-store phase. | This has been a multi-quarter strategic initiative. Converting successful tests into a large-scale contract is essential to validate the company's ability to unseat entrenched incumbents and establish a meaningful presence in the North American market. |
Appendix: Quotes by Theme
-
Strategic Flexibility & The "Multiple Ways to Win" Narrative: Management justified the deliberate near-term reduction in the service margin outlook by framing it as a strategic investment funded by outperformance in other areas, a key shift from prior guidance.
"Although service margins are going to be flat, what we decided to do because of the product margins and some of the OpEx upside that we saw earlier was to accelerate some of the investments that we need to make into that service business... that investment was about $10 million... we're still able to do what we said we were going to do and meet total EBITDA expectations because of the multiple ways to win on product margins and OpEx." — Thomas Timko, CFO
vs Q2-FY25 (Prioritizing Margin Expansion):
"We remain on track to exit Q4, with a run rate in service margins up 100 basis points versus prior years." — Thomas S. Timko, CFO
-
Confidence in Retail Recovery: The narrative has shifted from forecasting a second-half recovery to confirming its materialization, supported by strong order growth and progress in strategic initiatives.
"We anticipated an inflection in the second half, and that's exactly what we're seeing... I'm very optimistic about our retail growth trajectory going into Q4... As you saw, order growth was very substantial. Revenue growth was substantial as well." — Octavio Marquez, CEO
vs Q2-FY25 (Forecasting the Inflection):
"We are more optimistic than ever that the second half will bring on a firm recovery in our Retail business and fuel sequential and year-over-year improvement throughout the remainder of 2025." — Thomas S. Timko, CFO
-
Accelerated Capital Return Reflects Confidence: The announcement of a new, larger $200 million share repurchase program was positioned as a direct reflection of management's conviction in sustained cash generation and the company's valuation.
"This underscores the strength of our business, our fortress balance sheet, robust cash flow generation and continued commitment to returning capital to shareholders, a top priority for us and a clear reflection of our confidence in the long-term value of Diebold Nixdorf." — Octavio Marquez, CEO
"We're going to have more cash during the year to deploy. And right now, we think given the stock price, and we just feel very confident in our company's ability to generate cash. And we feel the stock is the best return on investment that we can make... we're dealing with stock that we feel is undervalued and underappreciated." — Thomas Timko, CFO
-
Branch Automation Strategy Matures to Formal Launch: The company's comprehensive branch automation solution has moved from securing initial orders to a formal market launch, with a clear adoption pattern emerging from large to smaller banks.
"Our annual Intersect event in Nashville... marked the formal launch of our branch automation solutions. This is not just a single product. It's a comprehensive approach across hardware, software and services that redefines how banks operate." — Octavio Marquez, CEO
vs Q2-FY25 (Highlighting First Wins):
"I would say that we're in the -- for us, we had our first significant order with -- for Teller Cash Recyclers this quarter." — Octavio Marquez, CEO
-
Sustained Runway in ATM Refresh Cycle (Consistent Messaging): Management reaffirmed the long-term nature of the core ATM refresh cycle, providing a durable unit volume baseline for the banking business.
"That pace of around 60,000 machines every year is the right way to think about it... keep thinking about it that way, 60-plus thousand machines every year for the foreseeable future." — Octavio Marquez, CEO
vs Q2-FY25 (Using Baseball Analogy):
"As far as the recycler, where are we in the cycle? I would tell you, once again... we're probably now in the fourth -- third, fourth inning with still a lot of runway to go." — Octavio Marquez, CEO
-
Geographic Diversity as a Strategic Strength: Management explicitly highlighted the company's global footprint as a key advantage, with strong performance in Europe and Asia Pacific offsetting near-term headwinds in Latin America.
"Europe, to be honest, is having a blockbuster year... Latin America... hasn't been as strong as we had hoped for... But once again, that's the importance of having the geographic diversity that we have that when one market is suffering, then a couple of others can pick up. So North America picked up some of the slack, Europe picked up some of it, Asia Pac." — Octavio Marquez, CEO
-
Rationale for Strategic Tuck-in Acquisition: Management detailed the specific capability gap filled by a small acquisition, which enables the company to service multi-vendor equipment—a critical requirement to win broader branch automation deals.
"It gives us a very important capability that we didn't have in the U.S., which is to serve different brands of equipment in the branch... there has to be a transition period where they're asking us to maintain their old fleet from different vendors. So with this small acquisition, we've acquired the skill set to repair third-party parts." — Octavio Marquez, CEO
-
Analyst Probing on North American Retail Progress: An analyst noted the absence of specific KPIs (proof-of-concepts, pilots) that were disclosed in prior calls, prompting a more qualitative update from management on progress in the region.
"Maybe spend a minute focused on the retail business, specifically in North America. Some of the KPIs you've been disclosing around proof of concepts, pilots, no mention of that this quarter... talk about how that effort is tracking versus your expectations." — Matt Summerville, Analyst, D.A. Davidson
"We keep increasing the number of proof of concepts globally, particularly in North America. We're happy that we're now in several dark stores at some large grocers where they're testing our solutions... we're trying to unseat some very long-standing incumbents in those markets, but we remain very optimistic." — Octavio Marquez, CEO
Historical Performance