Executive Summary
Amazon beat its Q1 revenue and operating income guidance, driven by a significant acceleration in its cloud and AI businesses. AWS revenue growth accelerated for the fifth consecutive quarter to 28% YoY, reaching a $150 billion annualized run rate. This performance was validated by a massive 50% sequential surge in the AWS backlog to $364 billion, signaling a robust demand pipeline that underpins the company's aggressive investment strategy.
A key development was the disclosure of its custom silicon business, which has surpassed a $20 billion annual revenue run rate with triple-digit growth and a pro-forma scale of $50 billion, establishing it as a core strategic pillar. The core retail business also showed renewed strength, with paid unit growth accelerating to 15% YoY, its highest rate since the COVID-19 lockdowns.
The investment cycle continues to pressure cash generation, as trailing twelve-month free cash flow fell 95% YoY to $1.2 billion, and net debt more than doubled sequentially to $66.8 billion to fund capital expenditures. The results provide validation for Amazon's massive AI investment thesis, with concrete demand indicators now materializing. The central tension remains the duration of this cash-intensive cycle against its now more tangible long-term payoff.
1. Financial Performance Summary
A. Income Statement Metrics
Amazon reported Q1 net sales of $181.5 billion, an increase of 17% YoY (15% ex-FX), beating the high end of its $173.5B–$178.5B guidance. Performance was driven by a continued acceleration in AWS revenue growth to 28% YoY, its fastest rate in 15 quarters. Q1 GAAP operating income was $23.9 billion, also beating the high end of its guidance, resulting in a record operating margin of 13.1%. Net income was significantly impacted by a $16.8 billion pre-tax gain from the company's investment in Anthropic.
| Metric | Q1 2026 | Q1 2025 | Change | Notes |
|---|---|---|---|---|
| Total Net Sales | $181.5B | $155.7B | ↑ 16.6% | ↑ 15% ex-FX. Beat management guidance of $173.5B–$178.5B (Q4 2025 transcript). |
| - North America | $104.1B | $92.9B | ↑ 12.1% | 12% ex-FX growth was in line with the reported rate. |
| - International | $39.8B | $33.5B | ↑ 18.8% | ↑ 11% ex-FX. |
| - AWS | $37.6B | $29.3B | ↑ 28.3% | Growth accelerated for the fifth consecutive quarter. Now a $150B annualized run rate. |
| Gross Profit[1] | $94.1B | $78.7B | ↑ 19.5% | Gross margin was 51.8%, up from 50.5% in the prior-year period. |
| GAAP Operating Income | $23.9B | $18.4B | ↑ 29.6% | Beat management guidance of $16.5B–$21.5B (Q4 2025 transcript). Operating margin reached a record 13.1%. |
| - North America | $8.3B | $5.8B | ↑ 43.1% | Operating margin expanded to 7.9% from 6.3%. |
| - International | $1.4B | $1.0B | ↑ 40.0% | Operating margin expanded to 3.6% from 3.0%. |
| - AWS | $14.2B | $11.5B | ↑ 22.6% | Operating margin was 37.7%, compared to 39.5% in the prior-year period. |
| GAAP Net Income | $30.3B | $17.1B | ↑ 77.2% | Includes a $16.8B pre-tax gain from the company's investment in Anthropic. |
| GAAP EPS (Diluted) | $2.78 | $1.59 | ↑ 74.8% | — |
Footnotes
- Gross Profit is a calculated metric. Calculation: Total Net Sales - Cost of Sales. For Q1 2026: $181,519M - $87,463M = $94,056M. For Q1 2025: $155,667M - $76,976M = $78,691M.
B. Balance Sheet Highlights
Amazon's balance sheet expanded, with total assets crossing $900 billion. The company significantly increased its leverage, with long-term debt rising by over 80% sequentially to $119.1 billion. This led to the net debt position more than doubling to $66.8 billion from $30.0 billion at the end of Q4 2025, reflecting aggressive capital raising to fund infrastructure investments.
| Metric | Mar 31, 2026 | Dec 31, 2025 | Change | Notes |
|---|---|---|---|---|
| Cash & Marketable Securities | $143.1B | $123.0B | ↑ 16.3% | — |
| Total Debt[1] | $209.9B | $153.0B | ↑ 37.2% | Increase primarily driven by a significant rise in long-term debt to fund investments. |
| - Long-Term Debt | $119.1B | $65.6B | ↑ 81.5% | — |
| - Long-Term Lease Liabilities | $90.8B | $87.3B | ↑ 4.0% | — |
| Net Debt[2] | $66.8B | $30.0B | ↑ 122.7% | Net debt position more than doubled sequentially due to new debt issuance. |
| Property and Equipment, net | $397.5B | $357.0B | ↑ 11.3% | Represents 43.4% of total assets, reflecting heavy CapEx in AWS infrastructure. |
| Inventories | $36.5B | $38.3B | ↓ 4.7% | Seasonal decrease following the Q4 holiday period. |
| Accounts Receivable, net | $75.5B | $67.7B | ↑ 11.5% | — |
| Other Assets | $151.8B | $122.6B | ↑ 23.8% | Represents 16.6% of total assets. |
| Shareholders' Equity | $441.9B | $411.1B | ↑ 7.5% | Growth driven by Q1 net income of $30.3B. |
Footnotes
- Total Debt is a calculated metric. Calculation: Long-Term Debt + Long-Term Lease Liabilities. For Mar 31, 2026: $119,074M + $90,814M = $209,888M. For Dec 31, 2025: $65,648M + $87,339M = $152,987M.
- Net Debt is a calculated metric. Calculation: Total Debt - (Cash and cash equivalents + Marketable securities). For Mar 31, 2026: $209,888M - ($101,816M + $41,273M) = $66,799M. For Dec 31, 2025: $152,987M - ($86,810M + $36,219M) = $29,958M.
C. Cash Flow Analysis
For the trailing twelve months (TTM), operating cash flow grew 30% to $148.5 billion. However, a 67% increase in net capital expenditures to $147.3 billion, primarily for AWS AI infrastructure, caused free cash flow to decline 95% to $1.2 billion from $25.9 billion in the prior year. After accounting for all lease payments, the company had a comprehensive cash outflow of over $16 billion for the period.
| Metric (TTM) | Ended Mar 31, 2026 | Ended Mar 31, 2025 | Change | Notes |
|---|---|---|---|---|
| Net Cash from Operating Activities | $148.5B | $113.9B | ↑ 30.4% | — |
| Stock-Based Compensation | $19.8B | $20.7B | ↓ 4.3% | Represents 13.3% of operating cash flow. |
| Net Capital Expenditures[1] | $(147.3)B | $(88.0)B | ↑ 67.4% | Investments primarily reflect support for AWS and generative AI customer demand. |
| Free Cash Flow (Company Definition)[2] | $1.2B | $25.9B | ↓ 95.3% | Significant decline driven by a $59.3B YoY increase in net capital expenditures for AI. |
| Free Cash Flow after All Lease Payments[3] | $(16.2)B | $11.6B | N/A | Reflects a comprehensive view of cash flow after all lease obligations. |
| Net Debt Issuance / (Repayment)[4] | $64.4B | $(8.2)B | N/A | Substantial net debt issuance during the period to fund CapEx. |
Footnotes
- Net Capital Expenditures is calculated from the TTM cash flow statement. Calculation: Purchases of property and equipment ($151,003M) - Proceeds from sales and incentives ($3,704M) = $147,299M.
- Free Cash Flow (Company Definition) is defined as Operating Cash Flow minus Net Capital Expenditures. Calculation: $148,531M - $147,299M = $1,232M.
- Free Cash Flow after All Lease Payments is a calculated metric. Calculation for TTM Mar 31, 2026: FCF ($1,232M) - Cash paid for operating leases ($15,791M) - Principal repayments of finance leases ($1,615M) = $(16,174)M.
- Net Debt Issuance / (Repayment) is a calculated metric from financing activities. Calculation for TTM Mar 31, 2026: Proceeds from debt ($81,891M) - Repayments of debt ($17,474M) = $64,417M.
D. Key Financial Ratios
Leverage increased as the company took on significant debt to fund capital expenditures. Working capital efficiency remained a source of strength, with Days Payable Outstanding remaining well-extended.
| Metric | TTM Ended Mar 31, 2026 | TTM Ended Mar 31, 2025 | Notes |
|---|---|---|---|
| Return on Equity[1] | 20.5% | — | Calculated using period-end equity as a proxy for average equity. |
| Net Debt to EBITDA[2] | 0.43x | — | Leverage increased due to higher net debt to fund investments. |
| Days Sales Outstanding (DSO)[3] | 37.1 days | — | — |
| Days Inventory Outstanding (DIO)[4] | 36.3 days | — | — |
| Days Payable Outstanding (DPO)[5] | 124.2 days | — | Extended payables continue to be a significant benefit to working capital. |
Footnotes
- Return on Equity (ROE) is calculated as TTM Net Income divided by period-end Stockholders' Equity, as average equity data is not available for the full TTM period. Calculation: $90,798M / $441,914M = 20.5%.
- Net Debt to EBITDA is a calculated metric. TTM EBITDA = TTM Operating Income ($85,422M) + TTM Depreciation & Amortization ($70,439M) = $155,861M. Ratio = Net Debt ($66,799M) / TTM EBITDA ($155,861M) = 0.43x.
- Days Sales Outstanding (DSO) = (Accounts Receivable / TTM Revenue) × 365. Calculation: ($75,532M / $742,776M) * 365 = 37.1 days.
- Days Inventory Outstanding (DIO) = (Inventory / TTM Cost of Sales) × 365. TTM Cost of Sales is a calculated metric. Calculation: FY2025 COS ($356.4B from prior report) - Q1 2025 COS ($77.0B) + Q1 2026 COS ($87.5B) = $366.9B. DIO = ($36,534M / $366,900M) * 365 = 36.3 days.
- Days Payable Outstanding (DPO) = (Accounts Payable / TTM Cost of Sales) × 365. Calculation: ($124,749M / $366,900M) * 365 = 124.2 days. Note: Prior period ratios are not provided due to the unavailability of comparable TTM balance sheet and cost of sales data for the period ended March 31, 2025.
E. Industry-Specific Operational Metrics
The company's operational metrics showed strength, with worldwide paid unit growth accelerating to 15% YoY, the highest since the COVID-19 lockdowns. The AWS backlog grew to $364 billion, a 50% increase from the prior quarter, signaling a robust demand pipeline for cloud services.
| Metric | Q1 2026 | Q1 2025 | Change | Notes |
|---|---|---|---|---|
| Online Stores Revenue | $64.3B | $57.4B | ↑ 12.0% | ↑ 9% ex-FX. |
| Physical Stores Revenue | $5.8B | $5.5B | ↑ 4.6% | ↑ 4% ex-FX. |
| Third-Party Seller Services | $41.6B | $36.5B | ↑ 13.9% | ↑ 12% ex-FX. |
| Advertising Services | $17.2B | $13.9B | ↑ 23.9% | ↑ 22% ex-FX. |
| Subscription Services | $13.4B | $11.7B | ↑ 14.6% | ↑ 12% ex-FX. |
| WW Paid Units (YoY Growth) | 15% | 8% | ↑ 700 bps | Management noted this was the highest growth since the end of the COVID lockdowns. |
| WW Seller Unit Mix | 60% | 61% | ↓ 100 bps | — |
| Employee Headcount | 1,575,000 | 1,560,000 | ↑ 1.0% | Headcount remains stable. |
| AWS Backlog[1] | $364.0B | $189.0B | ↑ 92.6% | Up 50% sequentially from $244B in Q4 2025. |
Footnotes
- Backlog figure for Q1 2026 was provided in the earnings call. Management noted it excludes a recent deal with Anthropic valued at over $100B.
2. Forward-Looking Guidance
A. Guidance Summary
Amazon introduced its outlook for Q2 2026, projecting continued strong growth. The company did not provide a new full-year capital expenditure figure but reiterated its commitment to significant, ongoing investment in AWS infrastructure to meet AI-driven demand, reinforcing the aggressive investment cycle outlined in the previous quarter.
| Metric | Period | Current Guidance | Prior Guidance | Change | Management Commentary |
|---|---|---|---|---|---|
| Net Sales | Q2 2026 | $194.0B – $199.0B | N/A | Introduced | Represents 16% to 19% YoY growth. Guidance anticipates an unfavorable foreign exchange impact of approximately 10 basis points and includes the impact of Prime Day occurring in Q2 for most countries, whereas it was in Q3 in 2025. |
| Operating Income | Q2 2026 | $20.0B – $24.0B | N/A | Introduced | Compares to $19.2B in Q2 2025. Guidance includes impacts from a seasonal step-up in stock-based compensation, a ~$1B YoY cost increase for Amazon Leo, and higher transportation costs. |
| Capital Expenditures | Full Year 2026 | Reiterated | ~$200B | Maintained | Management did not provide a new figure but confirmed its intention to spend significantly on AWS CapEx in 2026, expressing high confidence that the investment will be monetized effectively and yield compelling long-term ROIC. |
B. Additional Notes & Commentary
- Prime Day Timing Shift: The Q2 guidance assumes Prime Day will occur in the second quarter for most major geographies (including the U.S.), a shift from 2025 when the event took place in Q3 for all countries. This timing change is a key driver of the accelerated YoY revenue growth projected for the quarter.
- Q2 2026 Cost Headwinds: Management detailed several specific factors expected to impact Q2 operating income:
- A seasonal step-up in stock-based compensation expense due to the company's annual compensation cycle.
- An approximate $1 billion year-over-year cost increase within the North America segment related to Amazon Leo, as the company manufactures and launches more satellites.
- Higher transportation costs driven by fuel inflation, which are expected to be partially offset by a recently implemented FBA surcharge.
- Amazon Leo Accounting: The company noted that Amazon Leo's commercial service is on track for a Q3 launch. Management expects to begin capitalizing certain costs, such as satellite production and launch expenses, in Q4 2026. Until then, these costs are primarily expensed as incurred.
- Long-Term Capital Allocation Confidence: The CEO reiterated the long-term investment thesis for AWS, comparing the current AI-driven investment cycle to the first major AWS growth wave. Management expressed confidence that these investments, while pressuring near-term free cash flow, will fund long-lived assets (e.g., 30+ years for data centers) and ultimately produce attractive ROIC and significant downstream revenue and free cash flow.
3. Operational & Strategic Developments
A. Business Performance & Operations
Amazon's key business segments demonstrated significant operational momentum, highlighted by accelerating growth in AWS and a surge in retail unit volume.
- AWS Performance:
- Management highlighted the acceleration of AWS revenue growth to 28% YoY, reaching a $150 billion annualized run rate. This was the fastest growth rate in 15 quarters, achieved on a base twice as large as the last time such growth was recorded.
- The AWS backlog surged to $364 billion, a 50% sequential increase from Q4 2025. This figure excludes a recent commitment from Anthropic valued at over $100 billion, suggesting the underlying demand pipeline is even stronger.
- AI services adoption is scaling rapidly. Amazon Bedrock saw customer spend grow 170% quarter-over-quarter and processed more tokens in Q1 than in all prior years combined.
- Custom Silicon Business:
- Management disclosed that its custom silicon business (Trainium and Graviton) has surpassed a $20 billion annual revenue run rate, with triple-digit year-over-year growth.
- The CEO stated that if this unit were a stand-alone business selling its output at market rates, its annual revenue run rate would be $50 billion, positioning it as one of the top three data center chip businesses globally.
- Demand for its custom AI chips is intense: Trainium2 is "largely sold out," the newly shipping Trainium3 is "nearly fully subscribed," and a significant portion of Trainium4 (18 months from availability) has already been reserved.
- Stores and Fulfillment:
- Worldwide paid unit growth accelerated to 15% YoY, a significant step-up from 12% in the prior quarter and the highest rate since the end of the COVID-19 lockdowns.
- The company continues to gain operational leverage, with unit growth (15%) outpacing the growth in both outbound shipping costs (12% ex-FX) and fulfillment expenses (9% ex-FX).
- The grocery business was highlighted as a key growth driver, with management identifying Amazon as the second-largest grocer in the U.S. based on over $150 billion in gross sales in 2025.
- Advertising: Revenue growth remained robust at 22% YoY (ex-FX), reaching $17.2 billion for the quarter.
B. Strategic Initiatives
The company's strategy is centered on an aggressive, multi-faceted investment to establish leadership in what management calls "the biggest inflections of our lifetime," with a primary focus on generative AI and custom silicon.
- All-In on AI Infrastructure and Services:
- Amazon is aggressively expanding its AI partnerships, announcing new or expanded agreements with OpenAI, Anthropic, Meta, and NVIDIA.
- A key strategic focus is on "agentic AI," which management believes will deliver most of the long-term value from the technology. This is evident in the launch of Amazon Bedrock Managed Agents powered by OpenAI and the continued development of its own agentic tools like Rufus, Q, and the new Quick desktop app.
- Leveraging Custom Silicon as a Competitive Moat:
- The company is positioning its Trainium (AI) and Graviton (CPU) chips as a core strategic advantage. Management projects that at scale, using Trainium for its own workloads will save tens of billions of dollars in CapEx annually and provide several hundred basis points of operating margin advantage versus relying on third-party chips.
- The company is also exploring selling racks of Trainium directly to customers in the next couple of years, signaling a potential expansion of its business model beyond cloud services.
- Scaling New Ventures:
- Amazon Leo: The satellite internet venture is nearing commercial launch, with plans to acquire Globalstar to add direct-to-device capabilities. A new agreement with Apple for Amazon Leo to power satellite services for iPhones and Apple Watches represents a significant strategic win ahead of the service's full launch.
- AI-Powered Retail: The company is embedding AI across its retail operations, from the Rufus shopping assistant (monthly active users up 115% YoY) to a new AI-powered visualization tool for third-party sellers and the launch of Health AI, a personal health agent backed by One Medical.
C. Risk Factors & Headwinds
- Dramatic Deterioration in Free Cash Flow (Persistent & Escalating): This remains the most significant financial risk. Trailing twelve-month free cash flow collapsed 95% year-over-year to $1.2 billion from $25.9 billion. After accounting for all lease payments, the comprehensive cash outflow was $(16.2) billion. This trend is a direct result of the company's massive capital investment cycle.
- Rapid Increase in Leverage (New & Material): To fund its capital expenditures, the company's net debt more than doubled sequentially to $66.8 billion from $30.0 billion at the end of Q4 2025. This was driven by a substantial increase in long-term debt. While the company maintains a strong balance sheet, the pace of this increase in leverage is a critical factor to monitor.
- Massive Capital Investment Cycle (Persistent & Escalating): The CEO explicitly stated that in high-growth periods like the current AI wave, "CapEx growth meaningfully outpaces the revenue growth," which challenges free cash flow in the early years. This confirms that the current cash burn is a deliberate, multi-year strategy. The risk remains centered on the duration of this cycle and the timing of its eventual returns.
- Supply Chain Inflation and Constraints (Persistent): The CEO noted that the cost of memory has "skyrocketed" and that there is not enough capacity to meet demand. While management expressed confidence in their supply arrangements, this remains a persistent external headwind that could impact both costs and the ability to meet customer demand for AI services.
4. Q&A Session Key Themes
A. Analyst Focus Areas
The Q&A session centered on understanding the strategic rationale and competitive advantages underpinning Amazon's massive investment cycle, particularly in AWS. Analysts sought to deconstruct the key drivers of the company's AI strategy, from custom silicon to model partnerships and the future of agentic commerce.
- Justification of the Massive AWS Investment (Recurring Theme): Continuing the primary focus from the prior quarter, analysts probed the scale and return profile of the ongoing capital investments. The questions evolved from the size of the spend (quantified last quarter) to the competitive moats that justify it. Management reiterated its view of AI as a "once-in-a-lifetime opportunity" and emphasized that the investment is supported by a flywheel effect where explosive AI growth also drives "very significant growth" in the core, non-AI cloud business.
- AWS AI Strategy and Partnerships: There was significant interest in AWS's platform strategy, particularly its relationship with other major AI players.
- OpenAI on Bedrock: Analysts questioned the significance of adding OpenAI's models to the Bedrock platform. Management framed it as a "big deal for customers," reinforcing its strategy of providing choice. The CEO stressed that the future lies in "stateful" models for building agents, highlighting the Bedrock Managed Agents service created with OpenAI as a key differentiator that "nobody else has."
- Custom Silicon Advantage: The CEO highlighted the combination of its leading CPU chip (Graviton) and price-performant AI chip (Trainium) as a key advantage. He also confirmed that Amazon is considering selling racks of Trainium chips directly to customers in the next couple of years.
- The Future of Agentic Commerce: Analysts explored the development of Amazon's retail AI and its impact on the advertising business. Management is positioning its Rufus shopping assistant to be the "best shopping assistant anywhere," and expressed confidence that advertising will thrive in an agentic environment due to the "multi-turn conversations" inherent in AI interactions.
- Quantifying New Ventures (Amazon Leo): Analysts sought to dimensionalize the opportunity for the Amazon Leo satellite business. Management expressed a "very bullish" outlook, comparing its financial characteristics to early AWS. The strategic rationale for the Globalstar acquisition was clarified as securing scarce global spectrum for direct-to-device services, which also enabled the key partnership with Apple.
B. Key Challenges & Concerns
The tone of the Q&A was inquisitive rather than confrontational. The central, implicit concern remains the duration and magnitude of the current investment cycle and its severe impact on near-term free cash flow. However, analysts framed their questions constructively, seeking justification for the strategy rather than directly questioning its financial prudence.
- No Questions on Balance Sheet Leverage: Despite the net debt position more than doubling sequentially to $66.8 billion to fund the investment cycle, no analyst raised questions about the balance sheet, leverage, or the company's debt load during the Q&A session. The focus remained entirely on the strategic investment and its potential for future returns.
5. Strategic Themes & Inflection Points
A. Current Period Themes
- The "All-In" AI Investment Thesis is Now Proven by Demand: The narrative has shifted from justifying the massive capital investment cycle to validating it with concrete demand signals. The 50% sequential surge in the AWS backlog to $364 billion and the accelerated 28% YoY revenue growth are now presented as definitive proof that the aggressive spending is meeting a massive, tangible market opportunity.
- Custom Silicon Emerges as a Core Business Pillar: Amazon has elevated its custom silicon efforts from a cost-saving initiative to a core strategic and financial pillar. The disclosure of a $20 billion+ actual and $50 billion pro-forma revenue run rate represents a major inflection point, positioning the company as a vertically integrated powerhouse in the AI supply chain.
- The AI Flywheel Effect is Explicitly Stated: A key new strategic message is that AI is not a siloed investment but a catalyst for the entire AWS business. Management explicitly stated that the explosive growth in AI workloads is also driving "very significant growth" in core, non-AI cloud services, creating a powerful flywheel that justifies the capital intensity.
- Retail Operational Excellence as the Financial Engine: The acceleration in unit growth to 15% YoY while simultaneously improving operational leverage underscores that the retail engine is healthy and capable of funding the company's long-term, capital-intensive ambitions.
B. Future Considerations
- Agentic AI as the Next Strategic Frontier: The company's focus is clearly evolving beyond foundational models to the "agentic layer," where AI can autonomously perform complex, multi-step tasks. The launch of Bedrock Managed Agents with OpenAI signals a strategic ambition to own the next wave of AI-driven automation and commerce.
- Potential Expansion of the Business Model: The CEO's statement that Amazon may sell racks of Trainium chips directly to customers in the coming years signals a potential, significant expansion of its business model beyond being a cloud service provider to also being a direct hardware systems vendor.
- New Ventures Reaching Critical Mass: The new agreement for Amazon Leo to power satellite services for Apple is a major strategic win that validates the venture ahead of its full commercial launch. This, combined with the acquisition of Globalstar, signals that Leo is moving from a cost center to a key future growth vector.
- The Financial Trade-Off Becomes Starker: The consequences of the aggressive investment strategy are now clearly visible on the balance sheet. The doubling of net debt sequentially to fund CapEx and the 95% collapse in TTM free cash flow make the company's strategic trade-off—prioritizing long-term AI dominance over near-term cash generation—more explicit than ever.
6. Key Items to Monitor Next Quarter
A. Prior Quarter Monitoring Review
Management provided substantive updates on all five key items identified in the previous quarter. The company is executing its massive capital plan, supported by a surge in the AWS backlog. The custom silicon business was sized as a significantly larger and more material segment than previously disclosed. Retail efficiency and the Amazon Leo commercialization plan both remain on track.
| Prior Item | Current Status | Management Commentary |
|---|---|---|
| Execution of ~$200B CapEx Plan | On Track | The company is executing its aggressive investment plan, supported by a 50% sequential surge in the AWS backlog to $364 billion. Management reiterated its confidence in the long-term returns, comparing the current AI investment wave to the successful initial build-out of AWS. |
| Monetization of Full AI Stack | Achieved | Amazon demonstrated significant progress, with Amazon Bedrock customer spend growing 170% quarter-over-quarter. The company also announced a key partnership to bring OpenAI models to the platform and launched a new joint service, "Bedrock Managed Agents," to target the high-value "agentic AI" market. |
| Scaling the Custom Silicon Business | Ahead of Schedule | Management provided a major update, stating the custom silicon business has surpassed a $20 billion annual revenue run rate (up from >$10B last quarter) and has a pro-forma run rate of $50 billion. Demand for future chip generations (Trainium3 and Trainium4) is exceptionally strong, with supply nearly or already reserved. |
| Retail Cost-to-Serve Efficiency | On Track | The company continues to demonstrate operational leverage. In Q1, worldwide paid unit growth of 15% outpaced the growth in both fulfillment expense (9% ex-FX) and outbound shipping costs (12% ex-FX), confirming ongoing efficiency gains. |
| Amazon LEO Commercialization | On Track | The project is on track for a commercial launch "in a few months." The company announced two major strategic developments: the planned acquisition of Globalstar for direct-to-device capabilities and a new agreement with Apple for Amazon Leo to power satellite services for iPhones and Apple Watches. |
B. Current Quarter Focus Items
The following table outlines the most critical non-guidance developments to monitor, derived from management's commentary in the Q1 2026 earnings call.
| Category | Item | Timeline | What to Monitor | Why It Matters |
|---|---|---|---|---|
| Risk | Balance Sheet Impact of AI Investment Cycle | Ongoing | The trajectory of net debt (which more than doubled sequentially to $66.8B) and TTM free cash flow ($1.2B, down 95% YoY). Monitor for any acceleration in operating cash flow to offset the significant capital outlays. | The current strategy is aggressively leveraging the balance sheet to fund the AI opportunity. A prolonged period of negative comprehensive free cash flow and rising debt could increase financial risk if the expected returns do not materialize in a timely manner. |
| Opportunity | Monetization of Custom Silicon Business | Next 1-2 years | Any updates on the growth of the >$20B revenue run rate. Progress on the CEO's stated plan to potentially sell racks of Trainium directly to customers, which would represent a new business line. | This represents a potential major expansion of Amazon's business model from a cloud service provider to a direct competitor in the AI hardware systems market. Success would create a powerful new revenue stream and further solidify its competitive moat. |
| Strategic | Execution of OpenAI Partnership on Bedrock | Next 1-2 quarters | Customer adoption and revenue contribution from OpenAI models on Bedrock. Initial metrics for the new "Bedrock Managed Agents powered by OpenAI," which management calls a unique "stateful" offering for building complex AI applications. | This partnership neutralizes a key competitive gap and positions Bedrock as a more comprehensive AI platform. Strong adoption of the joint agentic offering would validate AWS's strategy to own the critical "agentic layer" of the AI stack. |
| Operational | Sustainability of Retail Unit Growth Acceleration | Next Quarter | Whether the 15% YoY paid unit growth—the highest since the COVID lockdowns—can be sustained. Monitor management commentary on the key drivers, particularly in the grocery business and the impact of faster delivery speeds. | The health of the core retail business provides the financial stability to fund the massive AI investment. Sustained high unit growth, coupled with continued operational leverage, is critical to fueling the company's long-term ventures. |
| Strategic | Amazon Leo Commercial Launch & Key Partnerships | "in a few months" | The official commercial launch of the service. Announcements of new major enterprise or government agreements following the key wins with Apple and Delta. Any initial commentary on revenue contribution or path to profitability after it transitions from a cost center. | Leo is a significant long-term growth bet that is currently a material cost headwind (~$1B YoY impact in Q2 guidance). A successful commercial launch is the first step to validating the multi-billion dollar investment and turning it into a meaningful future revenue stream. |
Appendix: Quotes by Theme
-
Confidence in Massive AI Investment Cycle: Management reiterated its conviction in the long-term returns of its aggressive capital spending, comparing the current AI-driven cycle to the successful, foundational build-out of AWS.
"We've been through this cycle with the first big AWS growth wave and like the results. We expect to feel similarly about this next wave with much larger potential downstream revenue and free cash flow." — Andrew Jassy, CEO
- vs Q4-FY25: The prior quarter's commentary introduced the massive scale of the investment and framed it as a necessary, high-return bet on a foundational technology shift.
"We expect to invest about $200 billion in capital expenditures across Amazon.com, Inc., but predominantly in AWS, because we have very high demand... this isn't some sort of quixotic top line grab. You know, we have confidence that these investments will yield strong strong returns on invested capital." — Andrew Jassy, CEO
-
Custom Silicon Business - Rapid Escalation in Scale and Ambition: The company significantly raised the disclosed scale of its custom silicon business, framing it as a top-tier global player and a critical long-term margin driver.
"If our chips business was a stand-alone business and sold chips produced this year to AWS and other third parties as other leading chip companies do, our annual revenue run rate would be $50 billion. As best as we can tell, our custom silicon business is now one of the top 3 data center chip businesses in the world." — Andrew Jassy, CEO
- vs Q4-FY25: This represents a dramatic increase in the publicly stated size and strategic importance of the business in just one quarter.
"And our chips business, inclusive of Graviton and Tranium, is now over $10 billion in annual revenue run rate growing triple-digit percentages year over year." — Andrew Jassy, CEO
-
The AI Flywheel Effect - A New Strategic Framing: Management explicitly articulated how investment in AI is not only a new growth vector but also a direct catalyst for its core, non-AI cloud business.
"A lot of that is also as AI growth is exploding, it turns out that it leads to a lot of core growth as well. All the post training, all the reinforcement learning, all the agentic actions and tool usage that these agents are using." — Andrew Jassy, CEO
-
AI Platform Strategy - Embracing Key Partners like OpenAI: Management highlighted the addition of OpenAI to its Bedrock platform as a major customer win, emphasizing a strategy of providing choice while also co-developing unique, "stateful" agentic services that it views as a key differentiator.
"The fact that we're going to have all of the OpenAI models available in Bedrock is a big deal... the future of using these models is a stateful model... the Bedrock managed agents that we collaborated with and invented with OpenAI... I think that's the future of how these agents are going to be built. It's something that nobody else has." — Andrew Jassy, CEO
- vs Q4-FY25: The current quarter's collaborative tone contrasts with the prior quarter's more competitive framing, where management highlighted the shortcomings of third-party "horizontal agents."
"You know, these horizontal agents don't have any of your shopping history, they get a lot of the product details wrong... I think a lot of customers are ultimately gonna choose to use a great shopping agent from that retailer." — Andrew Jassy, CEO
-
Supply Chain Headwinds Reframed as a Cloud Catalyst: The CEO acknowledged significant inflation in component costs but positioned it as a net positive for AWS, arguing that supply scarcity drives more enterprises to migrate to the cloud.
"I think everybody knows that the cost of these components, particularly memory has skyrocketed... it is a further impetus pushing companies who have on-premises infrastructure into the cloud... we have seen a number of conversations... accelerate rapidly just because we have a lot more supply than what others have." — Andrew Jassy, CEO
- vs Q4-FY25: This commentary provides specific detail on "memory" costs, evolving from the more general supply constraints mentioned previously.
"I think every provider would tell you, including us, that we could actually grow faster if we had all the supply that we could take." — Andrew Jassy, CEO
-
Amazon Leo Validated by Key Strategic Partnerships: Management articulated a clear strategic vision for its satellite venture, with the acquisition of Globalstar and the partnership with Apple positioned as critical moves to capture the "direct-to-device" market.
"Increasingly, we see very large demand for consumers to have direct-to-device. And that was really the impetus for our acquisition of Globalstar. They have unusual and scarce global spectrum that's required... And then it also afforded us the opportunity to build a deep relationship with Apple, who's going to use our direct-to-device for their iPhones and for their watches." — Andrew Jassy, CEO
-
Analyst Focus Shifts from "Why Spend?" to "How to Win?": The Q&A session's focus evolved from questioning the scale of the capital investment (the dominant theme in Q4) to understanding the mechanics and competitive advantages of the AI strategy. Notably, despite net debt more than doubling sequentially to fund this investment, no analyst questioned the company's balance sheet or leverage, signaling broad market acceptance of the aggressive, long-term AI investment thesis.
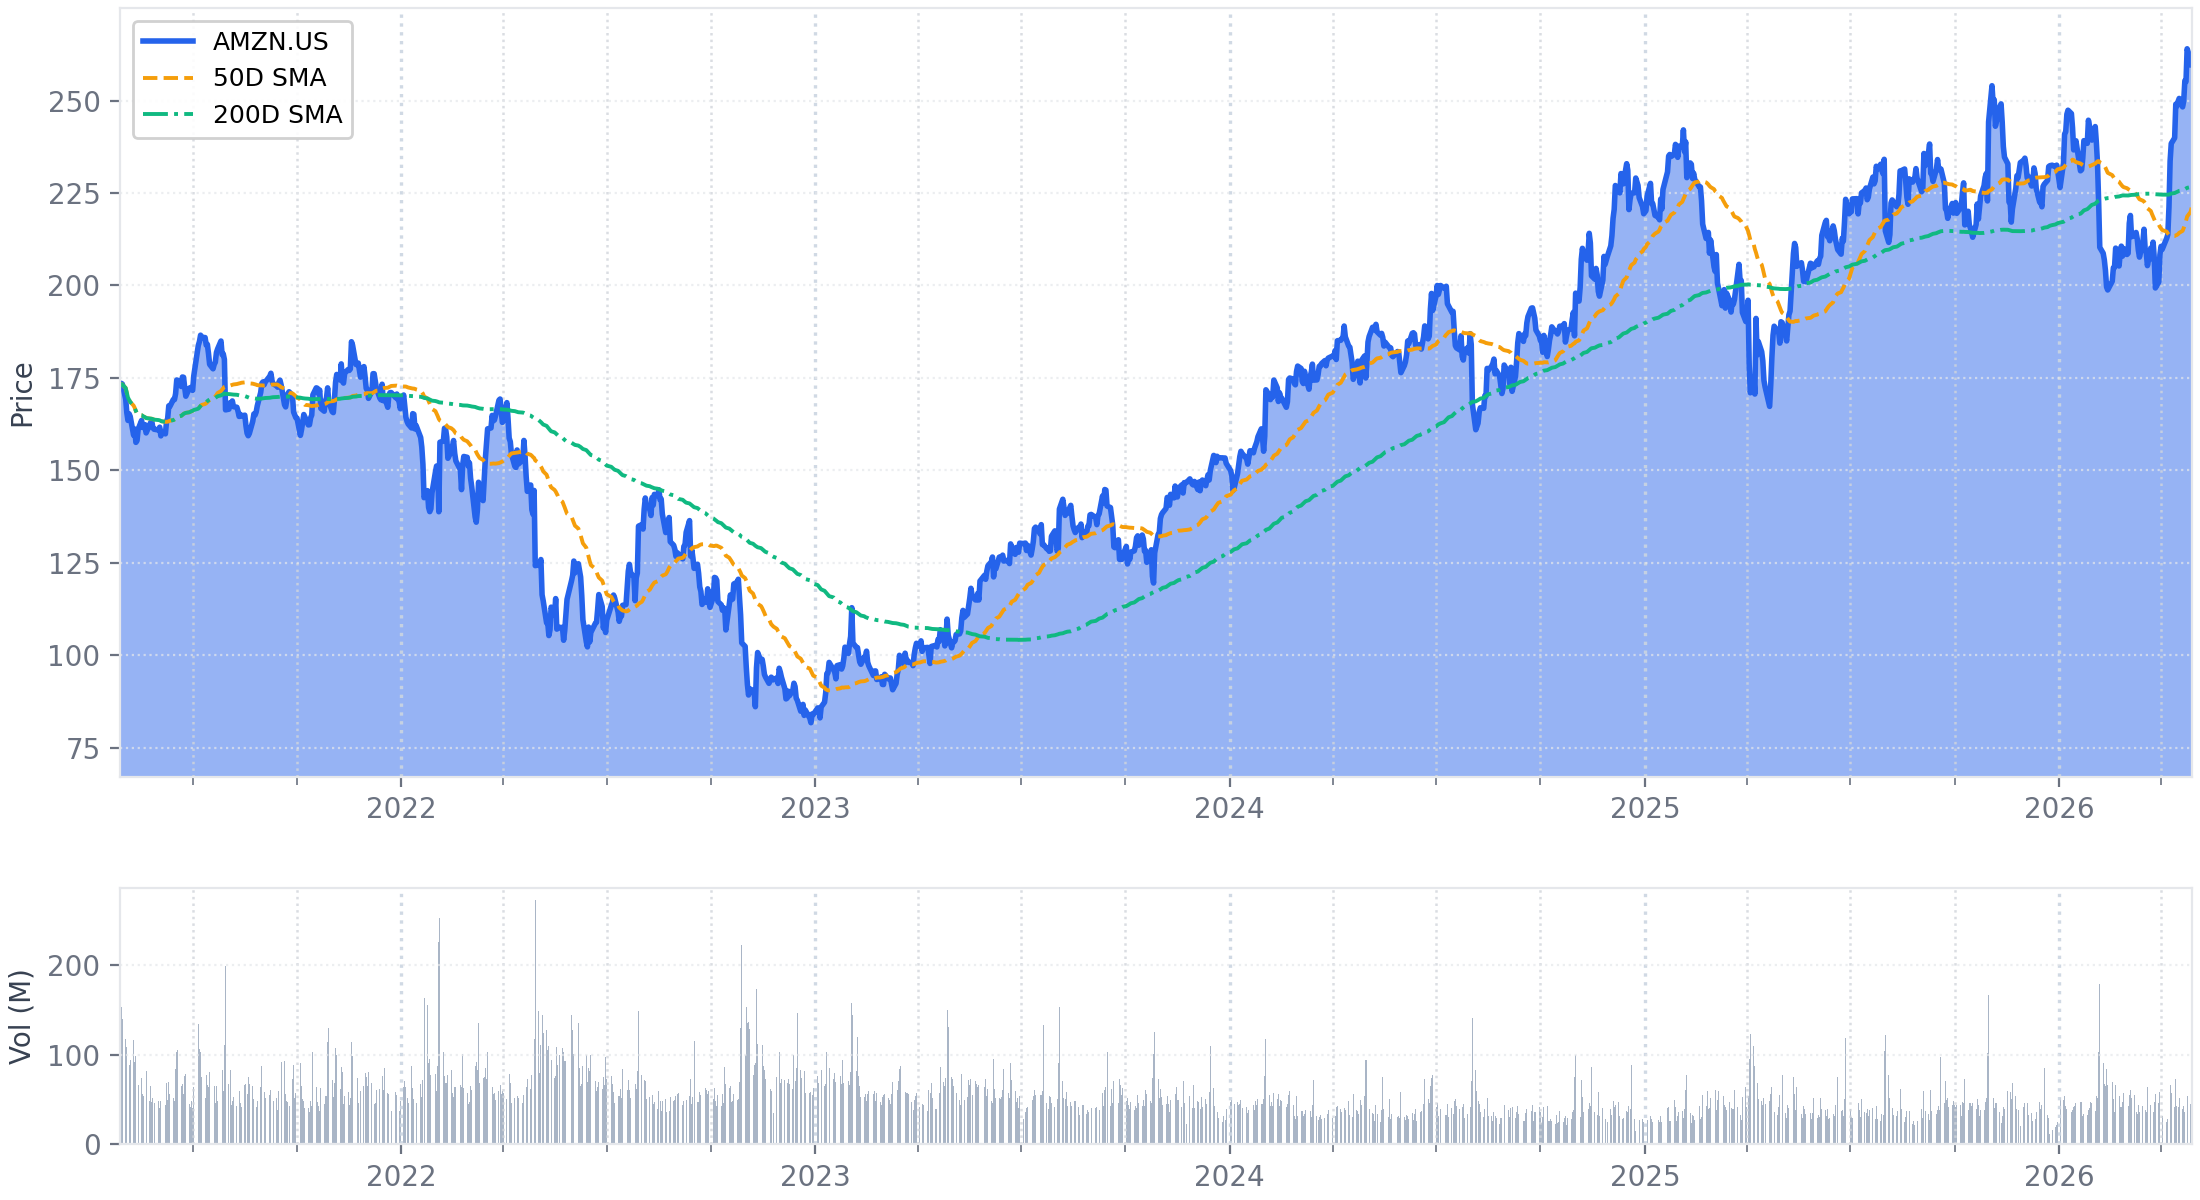
Historical Performance