Executive Summary
Meta reported Q4 revenue of $59.9B (+24% YoY), beating prior guidance. This strong performance from the core advertising business provides the foundation for a massive, quantified investment cycle in 2026 to pursue leadership in AI.
Management introduced an unprecedented FY2026 capital expenditure outlook of $115B–$135B, a 59% to 87% increase over 2025, to fund its "MetaCompute" infrastructure build-out and "personal superintelligence" vision. Despite this surge in spending, the company expects to grow absolute operating income in 2026. A key strategic shift was also signaled for Reality Labs, with management guiding that its 2026 operating loss will likely represent its "peak" as investment pivots toward glasses and wearables.
The financial impact of this strategy is significant. For FY2025, Free Cash Flow declined 16.3% to $43.6B due to soaring CapEx. The company's balance sheet has fundamentally shifted, moving from a $28.8B net cash position to $2.3B in net debt, a change underscored by a pause in share repurchases in Q4.
The results underscore a clear strategy: leveraging the highly profitable core business to fund a generational, multi-year transformation into an AI-first company. This approach prioritizes long-term strategic positioning over near-term financial metrics, fundamentally reshaping the company's financial profile and capital allocation model.
1. Financial Performance Summary
This summary reflects Meta's performance for the fourth quarter and full fiscal year 2025, which ended on December 31, 2025. All financial figures are sourced from the company's SEC filing. All comparisons are year-over-year (YoY) unless otherwise specified.
A. Income Statement Metrics (Q4 & Full Year)
Meta's Q4 revenue of $59.9B grew 24% YoY (23% constant currency), beating the high end of its prior guidance range of $56.0B–$59.0B. The performance was driven by a 25% YoY increase in Family of Apps (FoA) revenue, supported by an 18% increase in ad impressions and a 6% increase in average price per ad. For the full year, total revenue grew 22% to $201.0B.
The Reality Labs (RL) segment saw revenue decline 12% in Q4 to $955M, which management attributed to lapping the launch of the Quest 3S headset in the prior year. The segment's operating loss widened to $6.0B for the quarter and $19.2B for the full year.
Reported full-year net income was impacted by a one-time tax charge from Q3; excluding this, adjusted net income for FY2025 was $74.8B, and adjusted diluted EPS was $29.04.
| Metric | Q4 2025 | Q4 2024 | FY 2025 | FY 2024 | Notes |
|---|---|---|---|---|---|
| Total Revenue | $59.89B | $48.39B | $200.97B | $164.50B | Q4: ↑ 24% (23% CC). FY: ↑ 22% (22% CC). Beat Q4 guidance of $56.0B–$59.0B. |
| Family of Apps (FoA) Revenue | $58.94B | $47.30B | $198.76B | $162.36B | Q4: ↑ 25%. FY: ↑ 22%. Driven by a 24% increase in advertising revenue. |
| Reality Labs (RL) Revenue | $955M | $1.08B | $2.21B | $2.15B | Q4: ↓ 12%. FY: ↑ 3%. Q4 decline attributed to lapping the Quest 3S headset launch. |
| GAAP Operating Income | $24.75B | $23.37B | $83.28B | $69.38B | Q4: ↑ 6%. FY: ↑ 20%. |
| FoA Operating Income | $30.77B | $28.33B | $102.47B | $87.11B | Q4: ↑ 9%. FY: ↑ 18%. |
| RL Operating Loss | ($6.02B) | ($4.97B) | ($19.19B) | ($17.73B) | Q4 Loss: ↑ 21%. FY Loss: ↑ 8%. |
| GAAP Operating Margin | 41.3% | 48.3% | 41.4% | 42.2% | Q4 margin contracted by 700 bps YoY, driven by a 40% increase in total costs and expenses. |
| GAAP Net Income | $22.77B | $20.84B | $60.46B | $62.36B | Q4: ↑ 9%. FY: ↓ 3%. |
| Adjusted Net Income[1] | — | — | $74.76B | — | FY figure adjusted for a one-time tax charge. Q4 was not impacted. |
| GAAP Diluted EPS | $8.88 | $8.02 | $23.49 | $23.86 | Q4: ↑ 11%. FY: ↓ 2%. |
| Adjusted Diluted EPS[1] | — | — | $29.04 | — | FY figure adjusted for a one-time tax charge. Q4 was not impacted. |
Footnotes
- Full-year 2025 reported results include a one-time, non-cash tax charge related to new U.S. tax law enacted in Q3 2025. The filing indicates that absent this charge, the full-year effective tax rate would have been 13% instead of the reported 30%. Adjusted Net Income is calculated as Income Before Tax ($85,932M) less adjusted taxes ($85,932M * 13% = $11,171M), resulting in an adjusted figure of $74,761M. Adjusted Diluted EPS is calculated as Adjusted Net Income ($74,761M) divided by full-year diluted weighted-average shares (2,574M).
B. Balance Sheet Highlights
Meta ended the year with a strong liquidity position of $81.6B in cash and marketable securities. The company shifted from a net cash position of $28.8B at the end of FY2024 to a net debt position of $2.3B, reflecting a significant increase in long-term debt and lease liabilities to fund its aggressive infrastructure investments.
| Metric | Dec 31, 2025 | Dec 31, 2024 | Change | Notes |
|---|---|---|---|---|
| Cash & Marketable Securities | $81.59B | $77.82B | ↑ 4.9% | Strong liquidity maintained despite high capital expenditures. |
| Total Debt[1] | $83.90B | $49.06B | ↑ 71.0% | Increase driven by issuance of $29.9B in new long-term debt and growth in lease liabilities. |
| Long-Term Debt | $58.74B | $28.83B | ↑ 103.8% | |
| Operating Lease Liabilities | $25.15B | $20.23B | ↑ 24.3% | |
| Net Debt[2] | $2.31B | ($28.76B) | Shift to Net Debt | Company moved from a net cash position to a net debt position. |
| Total Assets | $366.02B | $276.05B | ↑ 32.6% | Growth driven by a $55.1B increase in Property and Equipment, net. |
| Shareholders' Equity | $217.24B | $182.64B | ↑ 18.9% | Increased due to net income, partially offset by capital returns. |
Footnotes
- Total Debt is calculated as Long-Term Debt plus Operating Lease Liabilities (current and non-current). For 2025: $58,744M + $2,213M + $22,940M = $83,897M. For 2024: $28,826M + $1,942M + $18,292M = $49,060M.
- Net Debt is calculated as Total Debt less Cash and Marketable Securities. For 2025: $83,897M - $81,592M = $2,305M. For 2024: $49,060M - $77,815M = ($28,755M).
C. Cash Flow Analysis
For the full year, Free Cash Flow declined 16.3% to $43.6B, as the $72.2B in capital expenditures significantly outpaced the prior year's spend. In Q4, the company did not repurchase any stock, a notable change from prior periods. Total capital returned to shareholders for the year was $31.6B through buybacks and dividends.
| Metric | Q4 2025 | Q4 2024 | FY 2025 | FY 2024 | Notes |
|---|---|---|---|---|---|
| Net Cash from Operations | $36.21B | $27.99B | $115.80B | $91.33B | Q4: ↑ 29.4%. FY: ↑ 26.8%. |
| Capital Expenditures[1] | $22.14B | $14.84B | $72.22B | $39.23B | Q4: ↑ 49.2%. FY: ↑ 84.1%. Driven by investments in data centers, servers, and network infrastructure. |
| Free Cash Flow[2] | $14.08B | $13.15B | $43.59B | $52.10B | Q4: ↑ 7.1%. FY: ↓ 16.3%. Full-year decline reflects the significant step-up in CapEx. |
| Share Repurchases | $0 | $0 | ($26.25B) | ($30.13B) | No shares were repurchased in Q4. |
| Dividend Payments | ($1.34B) | ($1.27B) | ($5.32B) | ($5.07B) |
Footnotes
- Capital Expenditures includes purchases of property and equipment and principal payments on finance leases.
- Free Cash Flow is calculated as Net Cash from Operations minus Capital Expenditures.
D. Key Financial Ratios
The company's profitability remained robust, with a Return on Equity of 30.2% for FY2025. Leverage increased but remains very low, with a Net Debt to EBITDA ratio of just 0.02x, reflecting the company's strong cash generation relative to its new net debt position.
| Metric | FY 2025 | FY 2024 | Change | Notes |
|---|---|---|---|---|
| Return on Equity (ROE)[1] | 30.2% | 34.1% | ↓ 390 bps | Calculated using average equity for FY2025 and period-end equity for FY2024. |
| Net Debt to EBITDA[2] | 0.02x | (0.34x) | Shift to Net Debt | Leverage remains minimal despite the shift from a net cash position. |
Footnotes
- Return on Equity (ROE) for FY2025 is calculated as Net Income ($60,458M) divided by average shareholders' equity (($217,243M + $182,637M) / 2 = $199,940M). FY2024 ROE is calculated using FY2024 Net Income ($62,360M) and end-of-period shareholders' equity ($182,637M) as average data was not available.
- Net Debt to EBITDA is calculated as Net Debt divided by EBITDA.
- FY2025: Net Debt of $2,305M. EBITDA calculated as Operating Income ($83,276M) + Depreciation & Amortization ($18,616M) = $101,892M. Ratio = 0.02x.
- FY2024: Net Cash of ($28,755M). EBITDA calculated as Operating Income ($69,380M) + Depreciation & Amortization ($15,498M) = $84,878M. Ratio = (0.34x).
E. Operational Metrics
User growth continued, with Family Daily Active People (DAP) increasing 7% YoY. Monetization efficiency grew, driven by higher ad impressions and increased pricing. Headcount growth was modest at 6% YoY, reflecting a focus on hiring in priority technical areas.
| Metric | Value (as of Dec 31, 2025) | YoY Growth (Q4 2025) | YoY Growth (FY 2025) | Notes |
|---|---|---|---|---|
| Family Daily Active People (DAP) | 3.58B | ↑ 7% | — | Figure as of December 2025. |
| Ad Impressions | — | ↑ 18% | ↑ 12% | Impression growth was healthy across all regions. |
| Average Price per Ad | — | ↑ 6% | ↑ 9% | Benefited from increased advertiser demand driven by improved ad performance. |
| Headcount | 78,865 | ↑ 6% | — | Growth was driven by hiring in priority areas like infrastructure and AI. |
2. Forward-Looking Guidance
Management provided its initial outlook for Q1 2026 and the full fiscal year 2026, signaling a period of unprecedented investment in infrastructure to support its AI initiatives. The company quantified its prior qualitative outlook, now expecting 2026 capital expenditures to be in the range of $115B–$135B, a substantial increase from the $72.2B spent in 2025. Total expenses are also projected to rise significantly.
Despite this step-up in spending, the company expects to grow absolute operating income, stating that FY2026 operating income will be "above 2025 operating income." Management also noted that Reality Labs losses in 2026 are expected to be similar to 2025, which would likely represent the "peak" loss for the segment.
A. Guidance Summary
The following table outlines the company's financial outlook. All figures are sourced from the company's Q4 2025 earnings release and conference call.
| Metric | Period | Current Guidance | Prior Guidance (from Q3 2025 Call) | Change | Management Commentary |
|---|---|---|---|---|---|
| Total Revenue | Q1 2026 | $53.5B – $56.5B | N/A | Introduced | Guidance assumes an approximate 4% foreign currency tailwind. |
| Total Expenses | FY 2026 | $162.0B – $169.0B | Qualitative: "significantly faster percentage rate" growth than in 2025 | Quantified | Growth is primarily driven by infrastructure costs (cloud, depreciation, operating expenses) and secondarily by compensation for technical and AI talent. |
| Capital Expenditures | FY 2026 | $115.0B – $135.0B | Qualitative: "notably larger" dollar growth than in 2025 | Quantified | Represents a 59%–87% YoY increase. Growth is driven by investments to support Meta Superintelligence Labs and the core business. |
| Operating Income | FY 2026 | > $83.28B[1] | N/A | Introduced | Management expects to deliver absolute operating income dollars above the FY2025 level, despite the significant increase in investment. |
| Tax Rate | FY 2026 | 13% – 16% | N/A | Introduced | Assumes no changes to the current tax landscape. |
Footnotes
- Guidance is for absolute dollar growth over the FY2025 reported GAAP Operating Income of $83.28B.
B. Additional Notes & Commentary
- Reality Labs (RL) Losses: Management expects RL operating losses in 2026 to be similar to 2025 levels ($19.2B), noting this will likely be the "peak" loss for the segment, with a gradual reduction anticipated in subsequent years.
- Capital Structure: The company noted it will look for opportunities to supplement its operating cash flow with "prudent amounts of cost-efficient external financing," which may lead it to maintain a positive net debt balance over time.
- Legal and Regulatory Headwinds: Management continues to flag risks from legal and regulatory matters in the EU and the U.S.
- EU: The company is rolling out changes to its "less personalized ads offering" in alignment with the European Commission.
- U.S.: Management highlighted ongoing scrutiny on youth-related issues and a number of trials scheduled for 2026 that "may ultimately result in a material loss."
3. Operational & Strategic Developments
A. Business Performance & Operations
- Advertising Engine Performance: The core advertising business demonstrated strong performance, driven by a combination of volume and pricing growth. Online commerce was the largest contributor to YoY growth, followed by professional services and technology.
- AI-Driven Product Enhancements: Management attributed significant engagement and revenue gains to AI-powered optimizations across its platforms.
- Facebook: Q4 optimizations resulted in a 7% lift in views of organic feed and video posts, marking the largest quarterly revenue impact from product launches in the past two years.
- Instagram: The platform increased the prevalence of original content in the U.S. by 10 percentage points in Q4, with 75% of recommendations now coming from original posts.
- Threads: Optimizations in Q4 drove a 20% lift in time spent. The company is expanding ads to the UK, European Union, and Brazil.
- Model Unification: The consolidation of models under the Lattice architecture continued, with the integration of Facebook Stories models in Q4 driving a 12% increase in ad quality. The company plans to consolidate more models in 2026 than in the prior two years combined.
- New Monetization & Engagement Milestones:
- WhatsApp Paid Messaging crossed a $2 billion annual revenue run rate in Q4, demonstrating continued scaling.
- Click-to-Message Ads revenue growth accelerated in Q4, with the U.S. market growing over 50% YoY.
- AI Creation Tools: Nearly 10% of Reels viewed daily are now created in the company's "Edits" app, a threefold increase from the previous quarter.
B. Strategic Initiatives
- "AI Acceleration" and "Personal Superintelligence": The central strategic theme is a major acceleration of AI initiatives in 2026. The CEO outlined a vision to build "personal superintelligence" and merge LLMs with the core recommendation systems that power the company’s apps and ad business. New models and products are expected to begin shipping in the coming months.
- MetaCompute Infrastructure Build-Out: To support its AI ambitions, the company is undertaking a massive infrastructure expansion under a new initiative called "MetaCompute." A key part of this strategy involves partnering with governments and strategic capital partners to expand long-term capacity, led by newly appointed President and Vice Chairman Dina Powell McCormick.
- Reality Labs Strategic Refocus: Management signaled a significant evolution in its Reality Labs strategy, pivoting future investment to prioritize glasses and wearables. This strategic shift was accompanied by a new long-term financial signal, indicating that the segment's operating losses are expected to peak, suggesting a move towards a more financially disciplined path.
C. Risk Factors & Headwinds
- Massive Investment Cycle Pressuring Financials (Persistent & Escalating): The most significant financial development is the quantification of the previously signaled investment escalation. Management's forward-looking guidance confirms a period of intense capital deployment that will continue to weigh on free cash flow and has already reshaped the balance sheet.
- FCF Decline: For the full year 2025, Free Cash Flow declined 16.3% YoY to $43.6B, a direct result of capital expenditures increasing by 84% to $72.2B.
- Shift to Net Debt: The company’s balance sheet has materially shifted. It ended FY2025 with $2.3B in net debt, a reversal from a net cash position of $28.8B at the end of FY2024. This change reflects the aggressive use of external financing to fund the infrastructure build-out.
- Legal and Regulatory Overhang (Persistent): Management reiterated key legal and regulatory risks with no significant updates on resolution. The risk of youth-related litigation in the U.S. remains, with management noting a number of trials scheduled for 2026 that "may ultimately result in a material loss." This language is consistent with the prior quarter.
- Management Changes: Dina Powell McCormick has joined the company as President and Vice Chairman to lead the "MetaCompute" initiative's partnership efforts.
4. Q&A Session Key Themes
A. Analyst Focus Areas
- Justifying the 2026 Investment Cycle (Recurring & Intensified): This was the central theme, continuing directly from the prior quarter. With management now providing the concrete $115B–$135B CapEx range, analysts pressed for details on the long-term ROI, the specific revenue opportunities being unlocked, and the path to a frontier AI model.
- Drivers of Near-Term Core Business Strength: Several analysts sought to understand the specific factors behind the strong Q1 2026 revenue guidance. The CFO attributed the strong outlook to continued advertiser demand, ongoing ad performance improvements from AI model enhancements, and a larger foreign currency tailwind. She affirmed that the company sees "a lot of headroom to improve recommendations in 2026."
- Capital Allocation and Returns: A new focus emerged around capital returns, specifically the lack of share repurchases in Q4. When asked, management did not provide a direct reason but reiterated its capital allocation priorities, with reinvesting in the business as the primary focus.
B. Key Challenges & Concerns
The primary concern woven throughout the Q&A was the lack of near-term visibility connecting the unprecedented 2026 spending to a tangible product and monetization roadmap. Analysts repeatedly attempted to get management to provide more concrete financial guardrails or quantifiable signals for the frontier AI investments.
- Challenge on Product Timelines: Analysts pressed for a clearer timeline on when the investments in Meta Superintelligence Labs (MSL) would translate into product impact. The CEO consistently deflected these requests, stating, "I think my answers to a lot of your questions on this particular call may be somewhat unfulfilling." He emphasized that the first models released will be more about showing the "trajectory that we're on" rather than being a single, definitive launch.
- Challenge on Financial Discipline: The sheer scale of the 2026 guidance implicitly raised questions about financial discipline.
- An analyst question prompted a critical clarification from the CFO, who stressed that the guidance is for absolute operating income dollars to be higher than in 2025, not for the rate of growth to be higher, implying margin compression.
- When asked about generating positive free cash flow in 2026, management’s response was non-committal, suggesting FCF will be under significant pressure.
5. Strategic Themes & Inflection Points
This quarter, Meta's narrative solidified around an unprecedented investment cycle to achieve leadership in frontier AI. The company is leveraging the exceptional strength of its core advertising business to fund a massive, multi-year infrastructure build-out, a strategy that is fundamentally reshaping its financial profile and long-term priorities.
A. Current Period Themes
- From Qualitative to Quantitative Escalation: The dominant theme is the transition from a qualitative warning of higher spending in Q3 to a concrete, massive quantitative outlook for 2026. The guidance for $115B–$135B in CapEx quantifies the company's commitment to its "AI Acceleration" and "MetaCompute" initiatives, confirming a period of intense capital deployment that will subordinate near-term financial metrics to long-term strategic positioning.
- Reality Labs Reaches a Financial Inflection Point: Management provided a significant new long-term financial signal by declaring that 2026 will likely represent the "peak" operating loss for the Reality Labs segment. This guidance, combined with a strategic pivot to prioritize investment in glasses and wearables, suggests a more focused and financially disciplined path forward for its metaverse ambitions.
- A Fundamental Shift in Capital Structure: The company's balance sheet has materially changed, moving from a net cash position of $28.8B at the end of FY2024 to a net debt position of $2.3B at the end of FY2025. This shift, driven by significant debt issuance and a pause in share repurchases in Q4, underscores the "all-in" nature of the current investment cycle and a new willingness to use the balance sheet to fund strategic growth.
B. Future Considerations
- Setting Expectations for a Foundational AI Year: Management is carefully managing expectations for 2026. The CEO described the current period as "unfulfilling" for those seeking immediate product details, framing the upcoming year as one that will show the company's "trajectory" in AI rather than delivering a single, definitive frontier model. This positions 2026 as a foundational year, with the primary financial and product impact to be realized over a longer horizon.
- The Long-Term Capital Allocation Model Evolves: The CFO's commentary about potentially maintaining a positive net debt balance signals a durable shift in capital management philosophy. As infrastructure needs remain elevated, investors should anticipate a continued reliance on external financing, moving the company away from its historical "fortress balance sheet" of holding significant net cash.
- Persistent Regulatory Headwinds: The regulatory environment remains a constant and unresolved risk. Management's commentary on headwinds in both the EU (less personalized ads) and the U.S. (youth-related litigation) was consistent with prior quarters, indicating no near-term resolution and continued potential for material financial impact.
6. Key Items to Monitor Next Quarter
A. Prior Quarter Monitoring Review
The following table provides an update on the key items identified for monitoring in the prior quarter's analysis (Q3 2025).
| Prior Item | Current Status | Management Commentary |
|---|---|---|
| The 2026 Investment Cycle Escalation | Achieved | Management quantified its previously qualitative outlook, providing formal guidance for FY2026 Total Expenses ($162B–$169B) and Capital Expenditures ($115B–$135B), confirming a massive escalation in spending. |
| Wearables as a Breakout Platform | On Track | The CEO confirmed strong momentum, stating that sales of AI glasses "more than tripled last year." Management also announced a strategic pivot to direct most of Reality Labs' future investment toward glasses and wearables. |
| Tangible Monetization from AI Investments | On Track | While prior-disclosed ARR metrics were not updated, management provided new proof points, including WhatsApp paid messaging crossing a $2B ARR and a 7% lift in Facebook organic views from AI optimizations, the largest impact in two years. |
| Execution of Off-Balance Sheet Financing | On Track | The strategy was reinforced with the appointment of Dina Powell McCormick as President and Vice Chairman to lead efforts in partnering with governments and strategic capital partners for infrastructure expansion under the "MetaCompute" initiative. |
| U.S. Youth-Related Legal Headwinds | No Update / Persistent Risk | Management's commentary was consistent with the prior quarter, reiterating that a number of youth-related trials are scheduled for 2026 in the U.S. that "may ultimately result in a material loss." The risk remains unresolved. |
B. Current Quarter Focus Items
The following table outlines the key non-guidance metrics and developments to monitor in the upcoming quarters.
| Category | Item | Timeline | What to Monitor | Why It Matters |
|---|---|---|---|---|
| Strategic / Risk | Reality Labs "Peak Loss" | FY 2026 / Ongoing | Whether the segment's FY2026 operating loss remains at or below the FY2025 level of $19.2B, and any commentary on the timeline for the guided "gradual reduction" in losses thereafter. | This is a major financial inflection point for the metaverse initiative. Achieving "peak loss" would signal a move towards a more sustainable financial path for Reality Labs, potentially improving consolidated profitability and investor sentiment. |
| Opportunity / Strategic | Initial "Personal Superintelligence" Product Rollout | Next 1-2 Quarters ("coming months") | The launch and initial market reception of the new AI models and products that management expects to start shipping. Monitor for specific product announcements and early user engagement signals. | This is the first tangible output from the rebuilt AI effort and the massive investment cycle. The quality and adoption of these initial products will be a critical early indicator of the company's "trajectory" and its ability to compete in frontier AI. |
| Risk / Financial | Free Cash Flow Generation vs. CapEx Burn | FY 2026 | The company's ability to generate positive free cash flow against the backdrop of its $115B–$135B CapEx plan. Management was non-committal on this point during the Q&A. | A significant FCF decline or a turn to negative FCF would underscore the immense financial pressure of the AI investment cycle and test the company's ability to fund this expansion through operating cash flow versus relying more heavily on external financing. |
| Financial / Capital Allocation | Capital Return Policy (Share Repurchases) | Next Quarter / Ongoing | The resumption or continued pause of share repurchases. The company bought back zero stock in Q4 2025, a notable shift from its historical practice. | This signals a fundamental shift in capital allocation priorities, favoring internal investment and debt management over shareholder returns. A continued pause would reinforce the "all-in" nature of the AI investment and the company's new net debt position. |
| Operational / Strategic | Execution of "MetaCompute" Partnerships | Ongoing | The announcement of specific partnerships with "governments, sovereigns, and strategic capital partners" under the new MetaCompute initiative, led by Dina Powell McCormick. | These partnerships are a critical component of the strategy to fund the massive infrastructure build-out. Their success will determine how much of the capital burden is borne by Meta's balance sheet versus external partners, directly impacting the company's financial risk profile. |
Appendix: Quotes by Theme
-
The AI Investment Cycle Escalates from a Vague Warning to a Quantified Reality Management provided its first quantitative guidance for the 2026 investment cycle, confirming the massive scale of spending that was only hinted at qualitatively in the prior quarter.
"We expect full-year 2026 total expenses to be in the range of $162 to $169 billion. ... We anticipate 2026 capital expenditures... to be in the range of $115 to $135 billion." — Susan Li, CFO
vs. Q3-FY25 (Qualitative Warning):
"Our current expectation is that CapEx dollar growth will be notably larger in 2026 than 2025. We also anticipate total expenses will grow at a significantly faster percentage rate in 2026 than 2025." — Susan Li, CFO
-
Managing Expectations for 2026: A Foundational Year of "Trajectory," Not a Definitive Product Launch The CEO explicitly tempered near-term expectations for the company's frontier AI efforts, framing 2026 as a foundational year where the initial product releases will be more about demonstrating progress than delivering a final, polished offering.
"I have to say upfront that I think my answers to a lot of your questions on this particular call may be somewhat unfulfilling because we're in this interesting period where we've been rebuilding our AI effort... the first set of things that we put out, I think, are going to be more about showing the trajectory that we're on." — Mark Elliot Zuckerberg, CEO (Q&A)
vs. Q3-FY25 (More Imminent Tone):
"We're heads down developing our next generation of models and products and I'm looking forward to sharing more on that front over the coming months." — Mark Elliot Zuckerberg, CEO
-
Reality Labs Reaches a Financial Inflection Point with "Peak Loss" Guidance (New Disclosure) For the first time, management provided a long-term financial guardrail for its metaverse segment, signaling that the period of escalating losses is expected to end as the strategic focus pivots decisively to glasses and wearables.
"I expect Reality Labs losses this year to be similar to last year, and this will likely be the peak as we start to gradually reduce our losses going forward... we are directing most of our investment towards glasses and wearables going forward." — Mark Elliot Zuckerberg, CEO
-
A Fundamental Shift in Capital Strategy: Embracing Net Debt and Pausing Buybacks Management signaled a durable shift in its capital management philosophy, moving away from its historical net cash position to fund the massive infrastructure build-out, a strategy underscored by a halt in share repurchases in Q4.
"We will continue to look for opportunities to periodically supplement our strong operating cash flow with prudent amounts of cost-efficient external financing, which may lead us to eventually maintain a positive net debt balance." — Susan Li, CFO
vs. Q3-FY25 (Strategy first introduced with partnerships):
"The JV that we announced with Blue Owl is sort of an example of finding a solution that enabled us to partner with external capital providers to co-develop data centers in a way that gives us long-term optionality." — Susan Li, CFO (Q&A)
-
Analyst Concern Intensifies in the Face of a Quantified, Unprecedented Spend With concrete figures for the 2026 investment plan now public, the primary focus of the Q&A was on the justification, financial impact, and ultimate ROI of the spending, continuing a theme of intense scrutiny from the prior quarter.
"Do you also expect to have positive free cash flow? Just how should we think about the current and any future JVs for data center and compute build out?" — Douglas Till Anmuth, Analyst (JPMorgan)
"Mark, could you just provide more detail on the progress of the MSL team several months in? And more on your view on the path to a frontier model this year." — Douglas Till Anmuth, Analyst (JPMorgan)
vs. Q3-FY25 (Concern focused on the qualitative warning):
"Can you just talk about your thought process and kind of triangulating the CapEx dollar growth and the significantly faster expense growth next year with core growth in the business and then the impact on earnings and free cash flow?" — Douglas Anmuth, Analyst (JPMorgan)
-
Justifying the Spend: A Persistent "Capacity Constrained" State Management continued to rationalize the massive investment by reiterating that the company is supply-constrained and unable to meet the profitable demand for compute from its core business, a consistent message from the prior quarter.
"We do continue to be capacity constrained. Our teams have done a great job ramping up our infrastructure..." — Susan Li, CFO (Q&A)
vs. Q3-FY25 (First introduced as "compute starved"):
"We are sort of perennially operating the family of apps and ads business in a compute starved state at this point... we feel pretty good that we're going to be able to absorb a very large amount of that to just convert into more intelligence and better recommendations... in a profitable way." — Mark Elliot Zuckerberg, CEO (Q&A)
-
Wearables Evolve from a Promising Product to a Commercial Success The narrative around AI glasses advanced from a successful new product launch in Q3 to a full-year success story in Q4, reinforcing management's conviction in the category as a key future platform.
"Sales of our glasses more than tripled last year, and we think that they're some of the fastest-growing consumer electronics in history... It's hard to imagine a world in several years where most glasses that people wear aren't AI glasses." — Mark Elliot Zuckerberg, CEO
vs. Q3-FY25 (Highlighting a successful launch):
"Our first glasses with a high-resolution display... sold out in almost every store within 48 hours... This is an area where we are clearly leading and have a huge opportunity ahead." — Mark Elliot Zuckerberg, CEO
-
Clarifying 2026 Profitability Expectations Amid Massive Investment In response to analyst questions, the CFO provided a critical clarification on the 2026 outlook, confirming the company expects absolute profit dollar growth, but implicitly signaling that profit margins are expected to contract under the weight of the investment cycle.
"I want to make sure my comments were super clear. In 2026, we expect to deliver operating income above 2025 operating income. So this is comparing absolute dollars, not year-over-year growth." — Susan Li, CFO (Q&A)
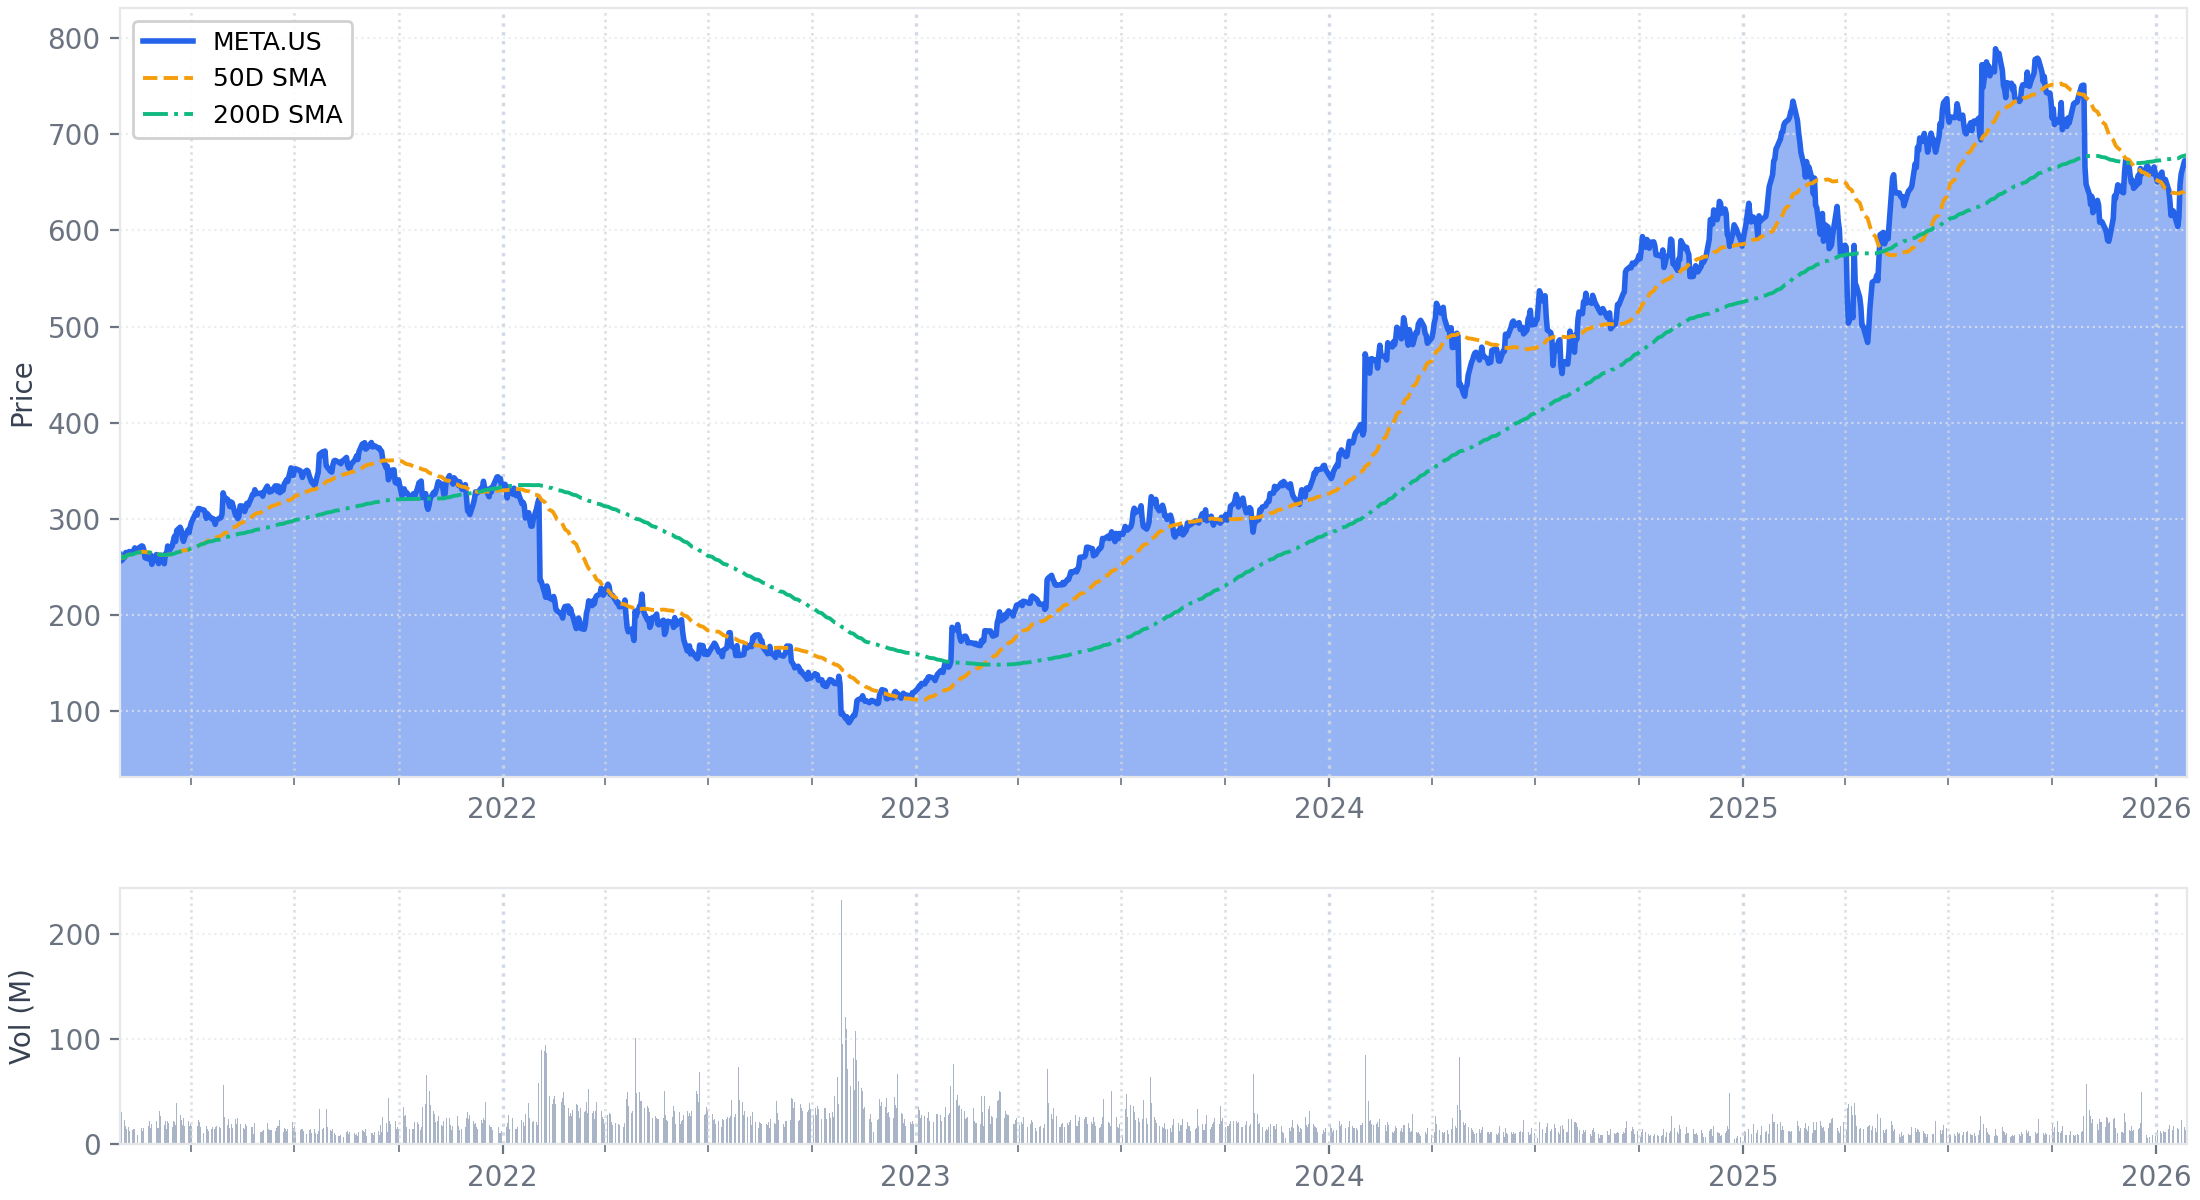
Historical Performance