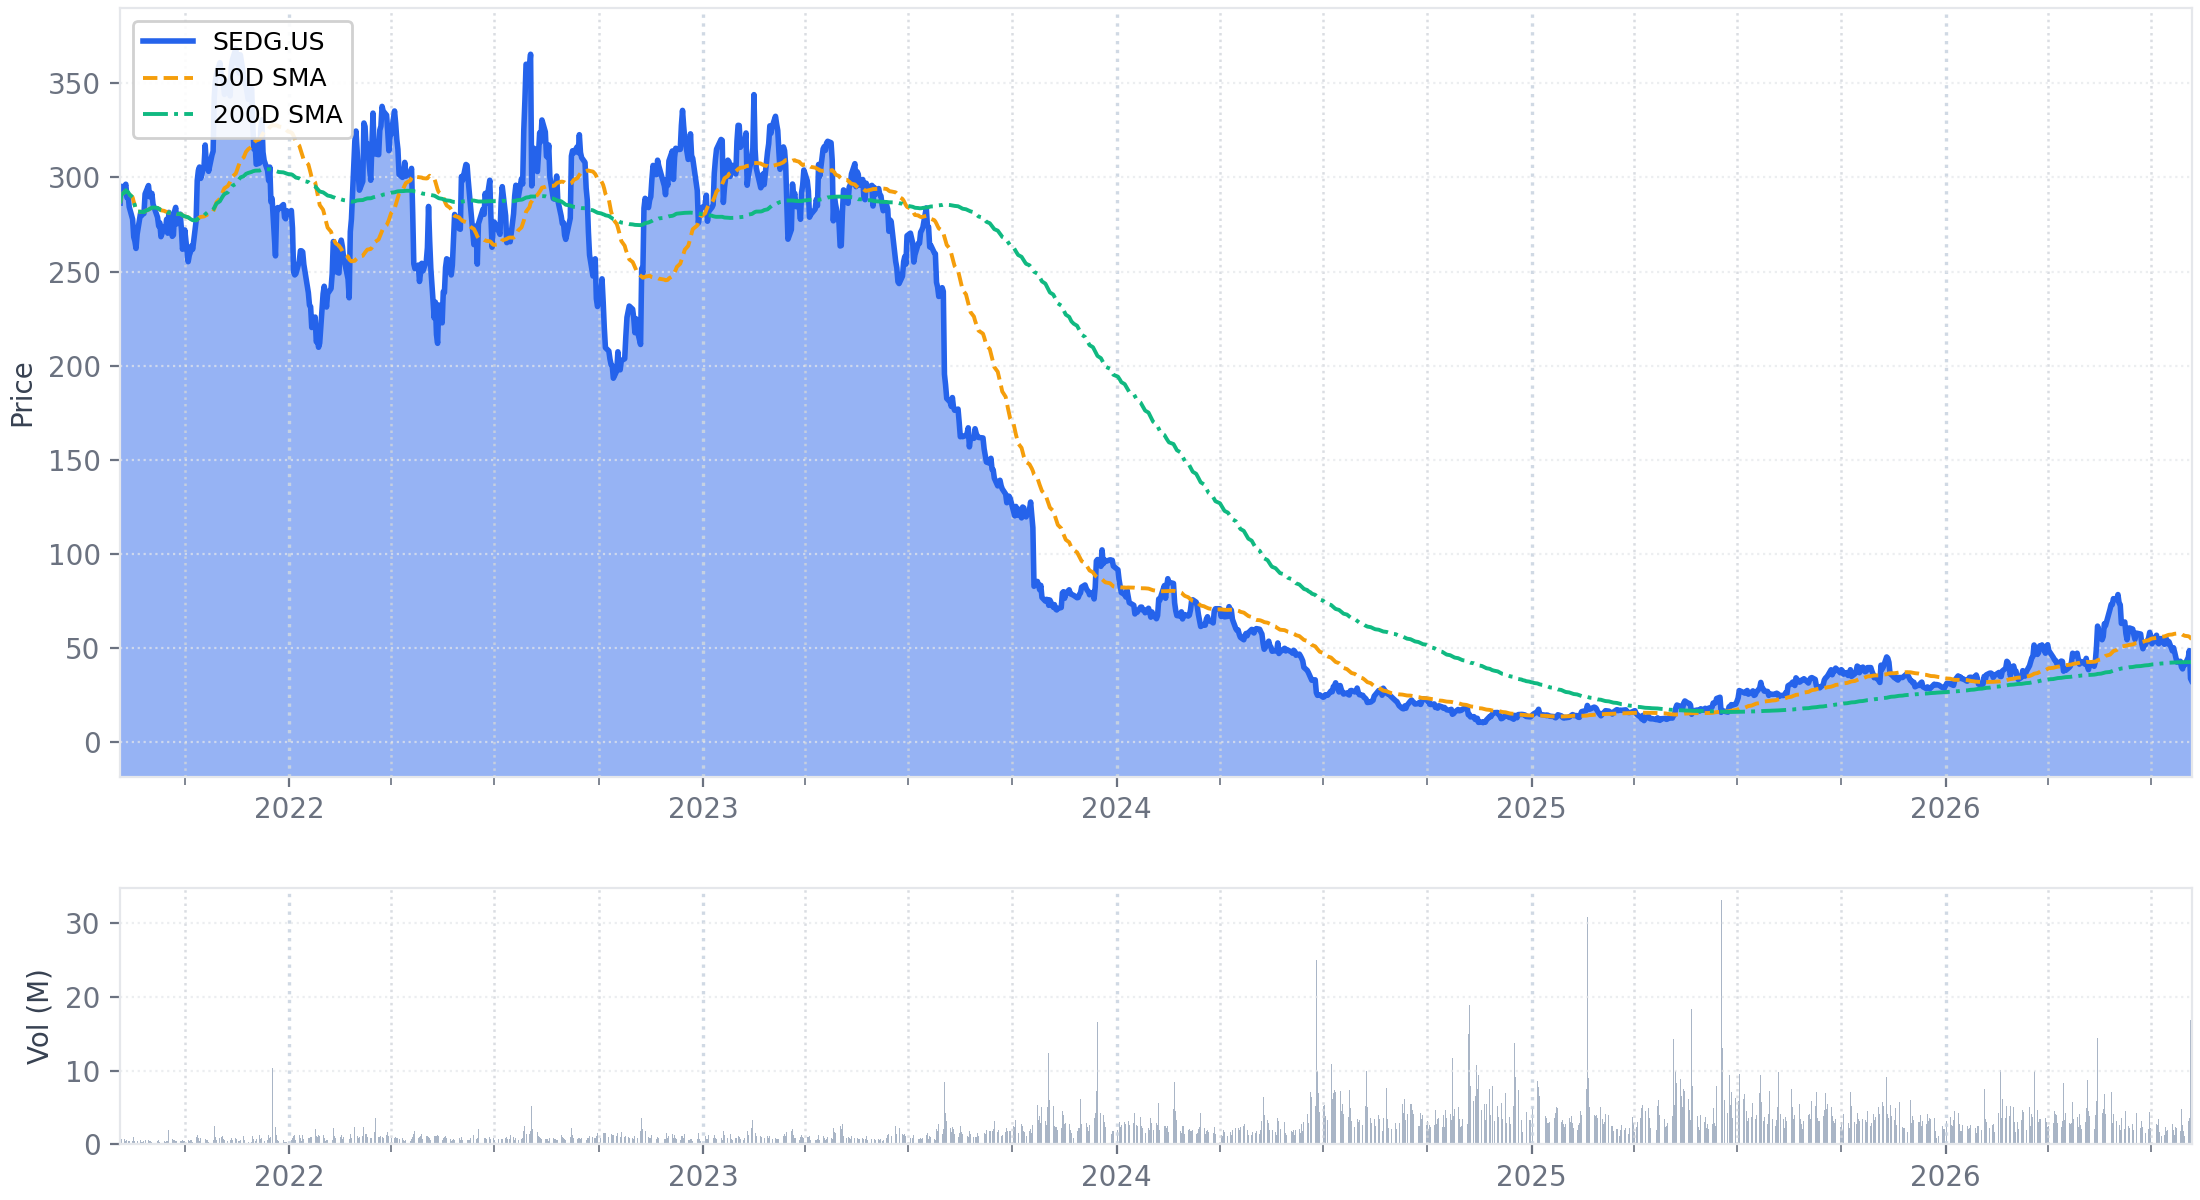
Executive Summary
SolarEdge reported Non-GAAP revenue of $345.5 million, up 23.0% year-over-year, exceeding the guidance midpoint of $340.0 million. Non-GAAP gross margin expanded to 28.6%, beating the guided range of 23.0% to 27.0% due to operational leverage, product mix, and a $13.3 million International Emergency Economic Powers Act (IEEPA) tariff refund. Operating performance reached Non-GAAP operating income of $10.2 million, surpassing the implied guidance loss of $(3.5) million and marking the company's first operating profit in nearly three years.
Geographic performance diverged significantly. In Europe, revenue increased 137.5% year-over-year to $154.4 million, driven by battery attach rates and initial commercial shipments of the three-phase Nexis platform exceeding $60 million. Domestically, U.S. commercial rooftop market share surpassed 50%, supported by domestic content and Foreign Entity of Concern (FEOC) compliance. In contrast, the U.S. residential segment remained constrained by tight tax equity financing and regulatory uncertainty, precluding the typical third-quarter seasonal volume increase.
Forward guidance projects Q3 revenue of $310.0 million to $340.0 million and Non-GAAP gross margin of 22.0% to 26.0%, reflecting European summer seasonality and lower volume scale. When factoring in an additional $11.5 million in tariff refunds collected in July 2026, the guidance midpoint implies sustained Non-GAAP operating profitability. The central question for investors is whether European storage demand and commercial market share momentum can sustain positive operating margins while the U.S. residential installation channel navigates prolonged financing headwinds.
1. Financial Performance Summary
A. Income Statement Metrics
SolarEdge reported GAAP revenue of $346.2 million (up 19.6% year-over-year) and Non-GAAP revenue of $345.5 million (up 23.0% year-over-year), exceeding the midpoint of management guidance ($325 million to $355 million). Non-GAAP gross margin expanded for the sixth consecutive quarter to 28.6%, beating the guided range of 23.0% to 27.0%. Non-GAAP operating expenses of $88.5 million landed at the exact midpoint of guidance ($86 million to $91 million). The company returned to Non-GAAP operating profitability of $10.2 million, surpassing the implied guidance loss of approximately $(3.5) million and marking its first profitable operating quarter since Q2 2023.
| Metric | Q2 2026 | Q2 2025 | Change (%) | Notes |
|---|---|---|---|---|
| GAAP Revenue | $346.2M | $289.4M | +19.6% | Beat guidance midpoint of $340.0M ($325M–$355M); up 11.5% quarter-over-quarter. |
| Non-GAAP Revenue[1] | $345.5M | $281.0M | +23.0% | Beat guidance midpoint of $340.0M ($325M–$355M); no safe harbor revenue pull-forward. |
| - United States | $154.9M | $185.0M | -16.3% | Represents 44.7% of GAAP revenue; down 2.0% quarter-over-quarter due to soft residential demand. |
| - Europe | $154.4M | $65.0M | +137.5% | Represents 44.6% of GAAP revenue; up 36.0% quarter-over-quarter driven by storage adoption. |
| - International Markets | $36.9M | $31.0M | +19.0% | Represents 10.7% of GAAP revenue; down 5.0% quarter-over-quarter. |
| GAAP Gross Profit | $95.2M | $32.1M | +196.1% | GAAP Gross Margin of 27.5% vs. 11.1% in Q2 2025 and 22.0% in Q1 2026. |
| Non-GAAP Gross Profit[2] | $98.7M | $36.9M | +167.4% | Non-GAAP Gross Margin of 28.6% vs. 13.1% in Q2 2025. Beat guidance of 23.0%–27.0%. |
| GAAP Operating Loss | $(16.0M) | $(115.5M) | -86.1% | GAAP Operating Margin of (4.6)% vs. (39.9)% in Q2 2025; loss narrowed by $99.4M. |
| Adjusted Operating Income (Loss) (Non-GAAP)[3] | $10.2M | $(48.3M) | N/A | Non-GAAP Operating Margin of 3.0% vs. (17.2)% in Q2 2025. Beat implied guidance of ~$(3.5M). |
| GAAP Net Loss | $(30.8M) | $(124.7M) | -75.3% | GAAP Net Margin of (8.9)% vs. (43.1)% in Q2 2025 and (18.5)% in Q1 2026. |
| Adjusted Net Income (Loss) (Non-GAAP)[4] | $3.6M | $(47.7M) | N/A | Non-GAAP Net Margin of 1.0% vs. (17.0)% in Q2 2025; first net profit since Q2 2023. |
| GAAP Diluted EPS (Loss) | $(0.50) | $(2.13) | -76.5% | Based on 61.05M basic and diluted shares vs. 58.57M in Q2 2025. |
| Adjusted Diluted EPS (Non-GAAP)[5] | $0.05 | $(0.81) | N/A | Based on 65.82M diluted shares vs. 58.57M in Q2 2025. |
Source: SEC Form 8-K filed August 5, 2026, and earnings conference call transcript.
Footnotes
- Non-GAAP revenue excludes discontinued operations revenues of $0.15M ($8.13M in Q2 2025) and revenues from financing components of $0.57M ($0.30M in Q2 2025). Geographic revenue figures represent GAAP revenue disclosures provided by management during the call.
- Non-GAAP Gross Profit reconciliation: GAAP Gross Profit of $95.15M excludes discontinued operations net costs of $0.09M, financing component revenue of $(0.57M), stock-based compensation of $3.69M, amortization of stock-based compensation capitalized in inventories of $0.32M, and amortization and depreciation of acquired assets of $0.50M, resulting in Non-GAAP Gross Profit of $98.70M. Gross profit included a $13.3M gross benefit from IEEPA tariff refunds.
- Adjusted Operating Income (Non-GAAP) reconciliation: GAAP Operating Loss of $(16.05M) excludes net pre-tax adjustments totaling $26.23M (163.5% of absolute GAAP value). Adjustments comprise stock-based compensation of $19.70M (R&D: $8.40M; S&M: $4.00M; G&A: $3.61M; Cost of revenues: $3.69M), assets impairment and disposal by abandonment of $6.65M, amortization and depreciation of acquired assets of $0.62M, amortization of stock-based compensation capitalized in inventories and assets of $0.43M, restructuring reversals of $(0.02M), discontinued operations of $(0.57M), and financing component revenues of $(0.57M), resulting in Non-GAAP Operating Income of $10.18M. Non-GAAP operating expenses were $88.52M, meeting guidance ($86M–$91M).
- Adjusted Net Income (Non-GAAP) reconciliation: GAAP Net Loss of $(30.75M) excludes net adjustments totaling $34.33M (111.6% of absolute GAAP value). Adjustments include operating adjustments of $26.23M, non-cash interest expense of $5.21M, currency fluctuations related to lease standards of $4.38M, cumulative translation adjustment (CTA) reclassification of $0.02M, financial discontinued operations of $(1.61M), and income tax adjustments of $0.11M, resulting in Non-GAAP Net Income of $3.58M.
- Adjusted Diluted EPS reconciliation: GAAP Diluted EPS of $(0.50) excludes net adjustments of $0.55 per share (110.0% of absolute GAAP value). Adjustments comprise stock-based compensation of $0.34, assets impairment and abandonment of $0.10, non-cash interest expense of $0.08, currency lease standard fluctuations of $0.06, amortization of SBC capitalized in inventories and assets of $0.02, discontinued operations of $(0.04), and financing components of $(0.01). Diluted share count expanded by 4.77M shares to 65.82M shares due to the dilutive effect of equity awards in a net income position.
B. Balance Sheet Highlights
SolarEdge ended the second quarter of 2026 with $601.6 million in total cash, restricted cash, and marketable securities, an increase of $20.5 million from December 31, 2025. Management reported that its cash and investments portfolio, net of debt, expanded to $264.6 million, up from $244.2 million as of year-end 2025. Total assets stood at $2.30 billion, with inventories representing 26.0% and total warranty liabilities representing 13.4% of total assets.
| Metric | June 30, 2026 | December 31, 2025 | Change (%) | Notes |
|---|---|---|---|---|
| Cash and Cash Equivalents | $527.3M | $455.1M | +15.9% | Primary liquidity source; increased $72.2M year-to-date. |
| Restricted Cash | $54.7M | $84.8M | -35.5% | Collateral and regulatory escrow deposits; decreased $30.1M year-to-date. |
| Marketable Securities | $19.7M | $38.1M | -48.3% | Short-term liquid available-for-sale securities. |
| Total Cash, Restricted Cash & Marketable Securities | $601.6M | $577.9M | +4.1% | Total liquid assets available to the company. |
| Total Debt[1] | $393.9M | $386.8M | +1.8% | Includes senior notes, finance leases, and operating lease liabilities. |
| - Convertible Senior Notes, net | $332.3M | $331.6M | +0.2% | Long-term convertible debt carrying an carrying value of $332.3M. |
| - Finance Lease Liabilities | $19.2M | $18.6M | +3.3% | Principal balance of equipment and facility finance leases. |
| - Capitalized Operating Lease Liabilities | $42.4M | $36.6M | +15.6% | Long-term operating lease commitments. |
| Net Cash Position (Total Liquidity less Total Debt)[2] | $207.7M | $191.2M | +8.6% | Total cash and securities ($601.6M) less Total Debt ($393.9M). |
| Net Cash (Management Definition)[3] | $264.6M | $244.2M | +8.4% | Defined by management as cash and investments portfolio net of debt. |
| Trade Receivables, net | $211.9M | $267.4M | -20.8% | Allowance of $28.9M vs. $17.2M at year-end; DSO improved to 55.1 days. |
| Inventories, net | $599.8M | $552.6M | +8.5% | Represents 26.0% of total assets; driven by Nexis production ramp. |
| Prepaid Expenses and Other Current Assets | $454.8M | $341.8M | +33.1% | Material current asset representing 19.7% of total assets. |
| Property, Plant and Equipment, net | $253.9M | $269.4M | -5.7% | Material long-term asset representing 11.0% of total assets. |
| Trade Payables | $460.1M | $272.0M | +69.2% | Material liability representing 20.0% of total assets; DPO extended to 164.9 days. |
| Accrued Expenses and Other Current Liabilities | $274.8M | $297.8M | -7.7% | Material liability representing 11.9% of total assets. |
| Warranty Obligations[4] | $308.9M | $357.9M | -13.7% | Material liability representing 13.4% of total assets. |
| Deferred Revenues and Customer Advances[5] | $377.0M | $363.7M | +3.7% | Material liability representing 16.4% of total assets. |
| Working Capital[6] | $947.8M | $936.4M | +1.2% | Current assets of $1,868.1M less current liabilities of $920.3M. |
| Total Stockholders' Equity | $412.1M | $427.5M | -3.6% | Represents 17.9% of total assets; lower due to first-half net loss. |
Source: SEC Form 8-K filed August 5, 2026.
Footnotes
- Total Debt is calculated as Convertible senior notes, net ($332.33M) + Finance lease liabilities ($19.17M) + Long-term operating lease liabilities ($42.38M) = $393.88M. As of December 31, 2025: $331.56M + $18.56M + $36.65M = $386.77M. Total funded debt excluding operating leases was $351.50M ($350.12M at year-end 2025).
- Net Cash Position (Total Liquidity less Total Debt) = Total Cash, Restricted Cash & Marketable Securities ($601.60M) - Total Debt ($393.88M) = $207.72M. As of December 31, 2025: $577.94M - $386.77M = $191.18M.
- Management definition of Net Cash from Exhibit 99.1 press release: "cash and investments portfolio, net of debt, grew by $20.4 million to $264.6 million, compared to $244.2 million as of December 31, 2025."
- Total Warranty Obligations combines current warranty obligations ($69.92M) and long-term warranty obligations ($238.98M) = $308.90M ($89.33M current and $268.56M long-term at December 31, 2025, totaling $357.89M).
- Total Deferred Revenues and Customer Advances combines current deferred revenues ($49.33M) and long-term deferred revenues ($327.68M) = $377.01M ($70.37M current and $293.33M long-term at December 31, 2025, totaling $363.70M).
- Working Capital is calculated as Total Current Assets ($1,868.14M) less Total Current Liabilities ($920.33M) = $947.81M. As of December 31, 2025: $1,739.85M - $803.50M = $936.35M.
C. Cash Flow Analysis
For the first six months of 2026, SolarEdge generated $35.8 million in operating cash flow and $23.9 million in GAAP Free Cash Flow, compared to $26.0 million and $14.7 million in the prior-year period. Free cash flow for the second quarter standalone was $3.1 million (compared to $20.7 million in Q1 2026 and negative $9.1 million in Q2 2025). Full-year 2026 capital expenditures are expected to be between $60.0 million and $80.0 million, with management reaffirming positive full-year free cash flow.
| Metric | 6M 2026 | 6M 2025 | Change (%) | Notes |
|---|---|---|---|---|
| Operating Cash Flow (GAAP) | $35.8M | $26.0M | +37.7% | Q2 standalone OCF was $11.4M ($24.4M in Q1 2026 and $(7.8M) in Q2 2025). |
| Share-Based Compensation[1] | $39.5M | $50.7M | -22.0% | Represents 110.3% of operating cash flow in 6M 2026 (194.8% in 6M 2025). |
| Capital Expenditures | $(12.0M) | $(11.4M) | +5.4% | Purchases of PPE. Q2 CapEx was $(8.3M); FY 2026 guidance maintained at $60M–$80M. |
| Free Cash Flow (GAAP)[2] | $23.9M | $14.7M | +62.8% | Operating Cash Flow ($35.8M) less Capital Expenditures ($(12.0M)). |
| Free Cash Flow after Lease Payments[3] | $(3.0M) | $12.8M | N/A | GAAP FCF less $(26.2M) headquarters lease pre-commencement payment and $(0.7M) lease financing. |
| Free Cash Flow (Management Definition)[4] | $23.9M | $10.8M | +121.1% | Q2 FCF was $3.1M ($20.7M in Q1 2026); FY 2026 positive FCF guidance reaffirmed. |
| Dividend Payments | $0.0M | $0.0M | — | No dividends paid or declared. |
| Share Repurchases / Issuances (Net)[5] | $11.5M | $0.3M | +3,358.9% | Net cash inflow from stock option exercises ($3.9M) and award tax withholding ($7.7M). |
| Net Share Repurchases after Share-Based Compensation[6] | $(28.0M) | $(50.4M) | -44.3% | Notional calculation: Net share issuances ($11.5M) minus SBC expense ($39.5M). |
| Debt Repayments / Issuances (Net)[7] | $0.0M | $(5.1M) | N/A | No debt repurchases in 6M 2026 vs. $(5.1M) convertible debt repurchase in 6M 2025. |
| Major Lease Payments / Pre-Commencement Payments[8] | $(26.2M) | $0.0M | N/A | One-time non-operational payment for Israel headquarters campus lease amendment. |
Source: SEC Form 8-K filed August 5, 2026.
Footnotes
- Share-based compensation expense of $39.55M for 6M 2026 ($50.69M in 6M 2025) exceeds 5% of operating cash flow ($35.84M), representing 110.3% of OCF.
- Free Cash Flow (GAAP) = Net cash provided by operating activities ($35.84M) - Purchase of property, plant, and equipment ($11.98M) = $23.86M. 6M 2025: $26.02M - $11.37M = $14.66M.
- Free Cash Flow after Lease Payments = GAAP FCF ($23.86M) - Payments made before lease commencement in investing activities ($(26.16M)) - Other financing activities ($(0.74M), representing principal lease payments) = $(3.04M). 6M 2025: $14.66M - $(1.85M) other financing activities = $12.81M.
- Free Cash Flow (Management Definition) from filing reconciliation table: 6M 2026 is $23.86M (Q1: $20.73M; Q2: $3.13M). 6M 2025 is $10.79M (Q1: $19.85M; Q2: $(9.06M)), which excludes $(3.87M) from discontinued operations.
- Share Repurchases / Issuances (Net) breakdown from Financing Activities: Issuance of common stock upon exercise of stock-based awards ($3.85M) + Tax withholding in connection with stock-based awards, net ($7.67M) = $11.52M net cash inflow. 6M 2025: $0.01M + $0.32M = $0.33M.
- Net Share Repurchases after Share-Based Compensation is a notional calculation mixing cash financing proceeds ($11.52M) and non-cash SBC expense ($39.55M): $11.52M - $39.55M = $(28.03M).
- Debt Repayments / Issuances (Net) is $0 in 6M 2026. In 6M 2025, $(5.09M) was paid for the repurchase of convertible debt.
- Payments made before lease commencement of $(26.16M) occurred in Q1 2026 for a lease amendment regarding the new headquarters in Israel, reducing future annual lease expenses by approximately $8.0M.
D. Key Financial Ratios
Working capital velocity improved significantly during the quarter. Days Sales Outstanding (DSO) fell to 55.1 days from 64.6 days in the prior quarter, driven by strong receivables collections. Days Payable Outstanding (DPO) expanded to 164.9 days, leading to an overall compression in the cash conversion cycle.
| Metric | Q2 2026 | Q1 2026 | Q2 2025 | Notes |
|---|---|---|---|---|
| Days Sales Outstanding (DSO)[1] | 55.1 days | 64.6 days | 67.5 days | Improved 9.5 days quarter-over-quarter and 12.4 days year-over-year on strong collections. |
| Days Inventory Outstanding (DIO)[1] | 215.0 days | 221.6 days | 185.0 days | Improved 6.6 days quarter-over-quarter; elevated due to Nexis and battery ramp. |
| Days Payable Outstanding (DPO)[1] | 164.9 days | 150.3 days | 95.2 days | Extended 14.6 days quarter-over-quarter and 69.7 days year-over-year. |
| Cash Conversion Cycle (CCC)[1] | 105.2 days | 135.9 days | 157.3 days | Compressed 30.7 days quarter-over-quarter and 52.1 days year-over-year. |
| Current Ratio[2] | 2.03x | 2.15x | 2.06x | Current assets ($1,868.1M) divided by current liabilities ($920.3M). |
| Total Debt to Equity[3] | 0.96x | 0.94x | 0.98x | Total Debt including operating leases ($393.9M) divided by equity ($412.1M). |
Footnotes
- Working capital ratios are calculated using annualized quarterly GAAP revenue ($346.25M) and GAAP cost of revenues ($251.09M) with a 90-day convention:
- DSO = (Trade receivables, net / GAAP Revenue) × 90 = ($211.87M / $346.25M) × 90 = 55.1 days.
- DIO = (Inventories, net / GAAP Cost of revenues) × 90 = ($599.82M / $251.09M) × 90 = 215.0 days.
- DPO = (Trade payables / GAAP Cost of revenues) × 90 = ($460.14M / $251.09M) × 90 = 164.9 days.
- CCC = DSO (55.1 days) + DIO (215.0 days) - DPO (164.9 days) = 105.2 days.
- Current Ratio = Total Current Assets ($1,868.14M) / Total Current Liabilities ($920.33M) = 2.03x.
- Total Debt to Equity = Total Debt including operating lease liabilities ($393.88M) / Total Stockholders' Equity ($412.09M) = 0.96x. Funded debt to equity (excluding operating leases: $351.50M / $412.09M) was 0.85x.
E. Operational Metrics
Management highlighted significant operational momentum in commercial rooftop market share, European platform deployment, and data center technology milestones.
| Metric | Q2 2026 | Q2 2025 | Change (%) | Notes |
|---|---|---|---|---|
| U.S. C&I Rooftop Market Share | >50% | ~33% | +1,700 bps | Exceeded 50% of U.S. commercial rooftop installations in the latest industry report. |
| Fortune 100 Rooftop Penetration | >60% | >50% | +1,000 bps | SolarEdge systems installed on rooftops of over 60% of Fortune 100 enterprise accounts. |
| European Nexis 3-Phase Rollout Shipments | >$60M | $0.0M | N/A | Commercial rollout of 3-phase Nexis platform in Europe began in Q2 2026. |
| European Retrofit Upsell Revenue | >$20M | N/A | N/A | Generated from installed base retrofit campaigns in the Netherlands and DACH region. |
| European Installed Base (Netherlands & DACH) | >1.0M homes | ~0.8M homes | +25.0% | Target market for storage and battery retrofit upsells ahead of net metering phaseout. |
| U.S. Manufacturing Share (Inverters & Optimizers) | >90% | <50% | +4,000 bps | Over 90% of production manufactured in U.S. plants (Texas, Florida, Utah) supporting exports. |
| AI Factory Solid-State Transformer (SST) Efficiency | 99% | N/A | N/A | Validated in live lab demonstrations; converts 34.5 kV AC directly to 800V regulated DC bus. |
2. Forward-Looking Guidance
A. Guidance Summary
SolarEdge introduced guidance for the third quarter of 2026 projecting revenue of $310.0 million to $340.0 million and Non-GAAP gross margin of 22.0% to 26.0%, excluding potential tariff refunds. Management maintained its full-year 2026 capital expenditure outlook of $60.0 million to $80.0 million and reaffirmed its expectation of positive full-year free cash flow. At the midpoint of Q3 operating guidance, when factoring in $11.5 million of tariff refunds received in July 2026, the guidance implies a non-GAAP operating profit. Consistent with corporate policy, management did not provide annual revenue or EPS targets, restricting financial guidance to the forward quarter.
| Metric | Period | Current Guidance | Prior Guidance | Change | Management Commentary |
|---|---|---|---|---|---|
| Revenue | Q3 2026 | $310.0M – $340.0M | — | Introduced | Reflects a sequential European decline of ~$15M at midpoint due to seasonality and continued softness in U.S. residential. Excludes safe harbor revenue pull-forward. |
| Non-GAAP Gross Margin[1] | Q3 2026 | 22.0% – 26.0% | — | Introduced | Midpoint of 24.0% reflects lower volume scale and fixed cost absorption. Stated range excludes potential IEEPA tariff refunds. |
| Non-GAAP Operating Expenses | Q3 2026 | $86.0M – $91.0M | — | Introduced | In line with Q2 run rate ($88.5M); reflects ongoing operational cost control and planned R&D investments in Nexis and AI factory power solutions. |
| Implied Non-GAAP Operating Income (Loss)[2] | Q3 2026 | ~$1.0M Profit (with refund) / $(10.5M) Loss (base) | — | Introduced | Base midpoint implies an operating loss of $(10.5M); factoring in $11.5M of IEEPA refunds collected in July 2026, guidance implies positive non-GAAP operating profit. |
| Capital Expenditures[3] | FY 2026 | $60.0M – $80.0M | $60.0M – $80.0M | Maintained | Key investments: U.S. manufacturing capacity (PV and batteries), Israel R&D campus facilities, AI factory infrastructure, and maintenance CapEx. |
| Free Cash Flow | FY 2026 | Positive | Positive | Maintained | Supported by improving operating performance, expense and capital investment discipline, and ongoing monetization of Section 45X tax credits. |
| European Nexis Single-Phase Rollout | Q1 2027 | Commercial Rollout | — | Introduced | Expansion of the Nexis platform into European single-phase markets scheduled for Q1 2027 following the Q2 2026 three-phase commercial ramp. |
| AI Factory Solid-State Transformer (SST) | Long-Term (2026–2028) | Working System: 2026; Pilots: 2027; Volume: 2028 | Working System: 2026; Pilots: 2027; Volume: 2028 | Maintained | Working lab proof-of-concept targeted by end-2026; customer data center pilot deployments planned in 2027, followed by commercial volume shipments in 2028. |
| Safe Harbor Deployment Window | Multi-Year (2026–2030) | Up to 4-Year Horizon | Up to 4-Year Horizon | Maintained | Physical work test transactions lock in commercial and residential product delivery and share gains over up to 4 years without in-period revenue pull-forward. |
| Investor Day | Event Date | September 10, 2026 | After Labor Day 2026 | Maintained | Briefing to provide detailed safe harbor transaction disclosures across resi and C&I, as well as revenue opportunity evolution for AI factory power solutions. |
Source: SEC Form 8-K filed August 5, 2026, and earnings conference call transcript.
Footnotes
- Non-GAAP Gross Margin guidance excludes any potential impact from IEEPA tariff refunds. The company collected $11.5 million in cash refunds in July 2026 that will be recognized in Q3 2026 results, but excluded them from the guided 22.0% to 26.0% operating baseline range.
- Implied Non-GAAP Operating Income (Loss) Calculation:
- Base Calculation (excluding refunds): Revenue midpoint of $325.0M × Gross Margin midpoint of 24.0% = $78.0M Gross Profit. Operating Expenses midpoint = $88.5M. Implied Base Operating Loss = $78.0M - $88.5M = $(10.5M).
- Calculation with Stated IEEPA Refund: Adding the $11.5M refund received in July 2026 yields an adjusted Gross Profit of $89.5M ($78.0M + $11.5M). Implied Operating Profit = $89.5M - $88.5M = $1.0M.
- First-half 2026 actual capital expenditures totaled $12.0M ($3.7M in Q1 and $8.3M in Q2), leaving $48.0M to $68.0M to be deployed across the second half of 2026.
B. Additional Notes & Commentary
-
Third Quarter Revenue Dynamics & Geographic Drivers:
- European Summer Seasonality: Management expects Europe to account for the sequential revenue contraction, declining by approximately $15 million at the midpoint from Q2's $154.4 million level due to normal summer installation slowdowns across PV and residential storage.
- U.S. Residential Softness: The typical third-quarter seasonal volume pickup in the U.S. residential market will not materialize in 2026. Residential installers and distributors continue to operate cautiously due to high capital costs, a slower tax equity funding environment, and uncertainty surrounding Foreign Entity of Concern (FEOC) definitions.
- Safe Harbor Recognition Framework: Reported Q2 results and Q3 revenue guidance exclude artificial pull-forward of demand from Section 48E or safe harbor provisions. Management's reliance on the "physical work test" enables customers to draw down equipment over up to four years as projects reach construction, aligning revenue recognition with actual channel installation rather than creating transient inventory accumulation.
-
Gross Margin Deleveraging vs. Underlying Performance:
- The guided sequential decline in Non-GAAP gross margin (from 28.6% in Q2 to 24.0% at the Q3 midpoint) is driven primarily by reduced revenue scale and fixed cost absorption ($90 million to $95 million in quarterly fixed manufacturing overhead within COGS).
- Management indicated that after adjusting for the revenue scale variance and the non-recurrence of the $13.3 million IEEPA benefit recorded in Q2, underlying gross margin demonstrates a modest quarter-over-quarter operational improvement.
-
Regulatory Landscape & Trade Compliance:
- FCC Foreign Inverter Covered List: Management affirmed that SolarEdge operates as a Delaware corporation listed on NASDAQ, with over 90% of its inverter and optimizer manufacturing situated domestically in Texas, Florida, and Utah. The company confirmed that its products comply with the FCC Covered List and do not require regulatory waivers or exemptions, which management views as a competitive tailwind against non-compliant C&I inverter competitors (such as Chint and SMA).
- European Regulatory Directives: European Bank-funded infrastructure projects mandate non-Chinese, authorized inverter equipment. While sentiment regarding wider commercial and residential equipment restrictions is emerging, management declined to speculate on broader regional import bans.
-
Component Procurement and Cost Environment:
- Broad supply chain availability remains stable, though heightened global demand for AI infrastructure is exerting localized pricing and availability pressure on memory components. Management stated it has secured adequate buffer inventory and is absorbing these isolated cost increases without material financial disruption.
3. Operational & Strategic Developments
A. Business Performance & Operations
-
Volume and Pricing Trends:
- Per-Product Pricing Stability: Management stated that pricing across product lines remained stable quarter-over-quarter. Average selling price (ASP) variations observed between periods were driven by geographic and product mix shifts rather than underlying price cuts. SolarEdge maintained its pricing structure despite discounting by peers, relying on product efficiency benchmarks and energy management software to defend price premiums.
- Storage Volume and Attach Rate Acceleration: Battery demand expanded across all major regions, with attach rates exceeding 90% in California under NEM 3.0 frameworks. In Europe, adoption is supported by dynamic utility tariffs and negative daytime rates. Retrofit activities—installing batteries on existing PV systems—generated over $20 million in upsell revenue in Europe during the second quarter.
- Commercial Scaling of Nexis: Initial European commercial shipments of the three-phase Nexis platform exceeded $60 million in Q2 2026. Management cited an independent engineering consultancy benchmark showing that Nexis delivers up to €5,000 in additional homeowner savings over 15 years compared to a leading European competitor, attributed to superior round-trip efficiency across low- and high-power operating bands.
-
Market Position and Competitive Dynamics:
- U.S. C&I Market Consolidation: SolarEdge expanded its market share to over 50% of U.S. commercial rooftop installations in the latest industry report, while rooftop penetration reached more than 60% of Fortune 100 companies. Management characterizes this share gain as structural, driven by domestic manufacturing at scale meeting domestic content, FEOC, and FCC Covered List requirements over foreign competitors like SMA and Chint.
- U.S. Residential Posture: While broader residential installations remained depressed by tight tax equity and FEOC uncertainty, management noted that safe harbor transactions executed ahead of the July 4 deadline position the company for market share gains once channel liquidity recovers.
- European Market Momentum: European revenue rose 137.5% year-over-year to $154.4 million (up 36.0% sequentially). The company capitalized on growing storage adoption ahead of net metering phaseouts in the Netherlands and DACH region, where SolarEdge maintains an installed base of more than 1 million homes.
-
Differences vs. Prior Guidance and Expectations:
- Top-Line Outperformance: Non-GAAP revenue of $345.5 million beat the guidance midpoint ($340.0 million; guidance range $325.0 million to $355.0 million), driven by accelerated European battery demand and three-phase Nexis platform shipments exceeding $60 million.
- Gross Margin Upside: Non-GAAP gross margin of 28.6% exceeded the upper end of guidance (23.0% to 27.0%) by 160 basis points, benefiting from the $13.3 million IEEPA tariff refund, favorable mix, and fixed-cost absorption over higher revenue.
- Early Return to Operating Profitability: Non-GAAP operating income reached $10.2 million, substantially outperforming the implied guidance loss of $(3.5) million, aided by the flow-through of gross profit and disciplined Non-GAAP operating expenses ($88.5 million vs. $86.0 million to $91.0 million range).
B. Strategic Initiatives
-
AI Factory Solid-State Transformer (SST):
- SolarEdge transitioned its data center power solution from development to live customer demonstrations. Engineering teams from prospective hyperscale operators evaluated lab units converting 34.5 kilovolt (kV) medium-voltage AC directly to a regulated 800-volt DC bus at 99% conversion efficiency, bypassing traditional low-voltage step-down transformers.
- Management reaffirmed its development schedule: a fully operational proof-of-concept lab system by year-end 2026, customer data center pilot installations in 2027, and commercial volume production in 2028. Further market sizing details will be disclosed at the September 10, 2026 Investor Day.
-
Safe Harbor Strategy via "Physical Work Test":
- The company closed a significant volume of safe harbor transactions prior to the July 4 statutory deadline across residential and commercial channels. Adhering to the physical work test model, these transactions establish multi-year delivery pipelines (up to four years) without pulling forward near-term revenue, securing future market share and smoothing production schedules.
-
Manufacturing Footprint and Operational Efficiency:
- Domestic Production and Export Hub: Manufacturing facilities operated with contract partners (Jabil and Flex) in Florida, Texas, and Utah remained fully ramped, with more than 90% of inverters and optimizers manufactured domestically. This footprint supplies domestic demand with domestic content compliance while supporting margin-accretive exports to Europe and International markets.
- Working Capital and Facility Rationalization: Operating discipline compressed the cash conversion cycle by 30.7 days sequentially to 105.2 days. Following the Q1 2026 lease amendment for the new Israel headquarters campus (which incurred a one-time pre-commencement payment of $26.2 million), the company remains on track to reduce ongoing annual operating lease costs by approximately $8.0 million beginning in 2027.
- Single-SKU Architecture: Nexis continues to drive hardware simplification. By replacing multiple legacy regional models with a unified inverter architecture supporting multiple power classes, distribution partners can carry less inventory while fulfilling equivalent or higher sales volumes.
C. Risk Factors & Headwinds
1. Financial Health Indicators
-
Cash Flow Profile and Back-Half Capital Intensity:
- Standalone Q2 free cash flow moderated to $3.1 million, compared to $20.7 million in Q1 2026. First-half CapEx deployments totaled only $12.0 million ($3.7 million in Q1 and $8.3 million in Q2) against full-year guidance of $60.0 million to $80.0 million.
- This implies an acceleration in capital expenditures to $48.0 million to $68.0 million across the second half of 2026 to fund U.S. manufacturing expansion, the Israel R&D facility, and AI data center lab equipment, which may constrain second-half free cash flow.
-
Working Capital and Supplier Payables Expansion:
- Trade payables surged by $188.2 million (+69.2%) in the first half of 2026, rising from $272.0 million at year-end 2025 to $460.1 million as of June 30, 2026, expanding DPO to 164.9 days. Operating cash flow in 6M 2026 ($35.8 million) was heavily supported by this working capital expansion; a normalization of supplier credit terms in future periods represents a potential cash drag.
- Inventories remained elevated at $599.8 million (26.0% of total assets; DIO of 215.0 days), reflecting component procurement and finished goods build for the Nexis launch and battery lines.
-
Material Liabilities:
- Total warranty obligations stood at $308.9 million (13.4% of total assets), comprising $69.9 million in current liabilities and $239.0 million in long-term liabilities. First-half cash settlements for warranty obligations totaled $49.0 million, representing a continuous operational cash commitment.
- Total deferred revenues and customer advances stood at $377.0 million (16.4% of total assets), requiring ongoing product delivery execution.
2. Operational Challenges
-
U.S. Residential Channel Contraction (Persistent Headwind):
- Sluggish tax equity funding and ongoing regulatory ambiguity regarding FEOC rules continue to constrain U.S. residential installations.
- Financing delays have reduced liquidity available to residential installers, leading distributors to lower inventory targets and exercise purchasing caution. Management confirmed that the typical seasonal volume rebound in U.S. residential will not occur in Q3 2026. While no new bad debt provisions were recorded in Q2 (following the $14.0 million doubtful debt charge in Q1 2026), the solvency of the residential installer network remains an ongoing risk.
-
European Summer Seasonality and Operating Leverage:
- Third quarter 2026 revenue guidance implies a sequential contraction of 1.8% to 10.5%, driven by an approximate $15 million sequential decline in Europe at the midpoint. Because fixed manufacturing overhead within COGS remains relatively static ($90 million to $95 million per quarter), lower quarterly volume scale is expected to compress Non-GAAP gross margin to 22.0% to 26.0% in Q3 2026.
-
Supply Chain Bottlenecks in Memory:
- Heightened global demand from AI data center buildouts has created supply constraints and upward pricing pressure on critical electronic components, particularly memory modules. While SolarEdge has secured buffer inventory and absorbed these increases, prolonged tightness could introduce cost inflation.
3. Reporting and Transparency Issues
-
Treatment of IEEPA Tariff Refunds in Guidance:
- SolarEdge collected $11.5 million in cash tariff refunds in July 2026 under the Supreme Court IEEPA ruling. However, management excluded this amount from its formal Q3 2026 Non-GAAP gross margin guidance range (guided at 22.0% to 26.0%), while noting in remarks that factoring in the refund brings the guidance midpoint to Non-GAAP operating profitability. Excluding known, collected cash items from standard guidance ranges introduces complexity in tracking underlying operational trajectories.
-
Deferred Backlog Metrics:
- Management declined to disclose specific figures regarding the volume, capacity, or monetary value of safe harbor agreements secured ahead of the July 4 deadline, deferring quantitative disclosures to the September 10, 2026 Investor Day. Granular megawatt shipment volumes and channel sell-through data remain omitted from quarterly disclosures.
4. Management Changes
- Chief Financial Officer Transition:
- Maoz Sigron formally assumed the role of Chief Financial Officer, succeeding Asaf Alperovitz, whose departure was effective June 9, 2026. Maoz led his first earnings call in the CFO capacity, outlining three immediate priorities: supporting profitable core growth tied to clear milestones and returns, driving manufacturing and supply chain cost discipline, and managing cash flow and liquidity preservation.
4. Q&A Session Key Themes
A. Analyst Focus Areas
- Sequential Margin Deleveraging and Scale: Analysts questioned the operational drivers behind the guided sequential decline in Non-GAAP gross margin (from 28.6% in Q2 to a midpoint of 24.0% in Q3), probing whether the contraction was mix-related or structural. Management clarified that the compression is mathematical: lower projected Q3 volume absorbs static fixed COGS overhead ($90 million to $95 million per quarter) less efficiently. Isolating volume scale and the non-recurrence of the $13.3 million Q2 IEEPA refund, underlying operational gross margin actually reflects a slight quarter-over-quarter improvement.
- Safe Harbor Strategy Divergence vs. Peers: Analysts pressed management on why SolarEdge has reported zero pull-forward safe harbor revenue throughout 2026, whereas primary competitors have recognized material volumes under safe harbor provisions over multiple consecutive quarters. Management reiterated that its enterprise and TPO partners deliberately selected the physical work test model over the 5% safe harbor method to align equipment deliveries with construction schedules over an extended horizon (up to four years), avoiding channel inventory accumulation.
- Regulatory Scrutiny (FCC Covered List and European Directives): Analysts focused on trade and regulatory policy, specifically inquiring whether the FCC Covered List action on foreign inverters would disrupt or delay the U.S. Nexis rollout, whether SolarEdge requires exemptions, and whether similar inverter bans are developing in Europe. Nir firmly rejected the assertion that Nexis requires an exemption, stating that SolarEdge is a U.S. company manufacturing over 90% of its optimizers and inverters domestically, making it fully compliant with the FCC Covered List.
- AI Factory SST Milestones: Analysts probed the multi-year development timeline for the data center solid-state transformer, asking what operational milestones to expect over the next six months and when management will provide revenue sizing models. Management confirmed that lab demonstrations with hyperscaler engineering teams successfully validated 99% conversion efficiency from 34.5 kV medium-voltage AC to an 800V regulated DC bus, keeping development on track for a full proof-of-concept system by year-end 2026.
- Channel Inventory Health and Q4 Trajectory: Analysts sought clarity on distributor inventory weeks-on-hand in the U.S. and Europe, asking whether cautious distributor purchasing could persist into Q4. Management stated that channel inventory across both regions has normalized, though U.S. distributors are intentionally limiting restocking until there is clarity regarding FEOC rules and tax equity availability.
- Comparison with Prior Period Themes: Inquiries regarding customer solvency, the Freedom Forever bankruptcy ($100 million UCC lien), and bad debt write-downs completely subsided in Q2 2026, with analysts shifting their focus toward regulatory impacts, margin leverage, and new product execution.
B. Key Challenges & Concerns
- Sequential Gross Margin Contraction in Q3:
- Analyst Challenge: Christine Cho (Barclays) challenged management on the primary factors driving Non-GAAP gross margin down from 28.6% in Q2 to 24.0% at the Q3 midpoint, pressing for clarity on whether the compression was concentrated in the U.S. or Europe and whether underlying product economics were worsening.
- Management Response: CFO Maoz Sigron explained that the sequential contraction is driven by revenue scale: lower projected Q3 revenue absorbs static fixed COGS overhead ($90 million to $95 million per quarter) less efficiently. Sigron stated that when isolating volume scale variance and the non-recurrence of the $13.3 million Q2 IEEPA refund, underlying operational gross margin reflects a slight quarter-over-quarter improvement.
- Distributor Destocking and Q4 Seasonality:
- Analyst Challenge: Christine Cho (Barclays) and Brian Lee (Goldman Sachs) challenged management regarding distributor inventory behavior in the U.S., questioning whether channel partners might continue reducing inventory through Q4, whether destocking ahead of the Nexis rollout was depressing demand, and whether Q4 could face a further sequential revenue drop.
- Management Response: Nir clarified that channel inventory is normalized and that distributors are not destocking to prepare for Nexis. Instead, distributors are managing working capital cautiously due to broader macroeconomic uncertainty and a lack of regulatory clarity regarding FEOC definitions. For Q4, management noted counter-seasonal drivers, including the Nexis volume ramp and accelerated storage retrofit demand in the Netherlands ahead of net metering elimination.
- Safe Harbor Strategy Disparity vs. Competitors:
- Analyst Challenge: Brian Lee (Goldman Sachs) pressed management on why SolarEdge has consistently reported no safe harbor pull-forward revenue across 2026, while its primary microinverter competitor recognized substantial safe harbor revenue. Lee questioned whether this disparity stemmed from a go-to-market disadvantage, customer preferences, or market share losses.
- Management Response: Nir defended SolarEdge's strategy, arguing that its enterprise and TPO partners deliberately selected the physical work test model. Nir emphasized that the physical work test allows customers to pull hardware only as projects reach construction, creating a healthier channel flow without artificial inventory buildup. Furthermore, customers committed to multi-year safe harbor agreements specifically because they view the Nexis platform as technologically durable through that horizon.
- FCC Foreign Inverter Action and Nexis Regulatory Standing:
- Analyst Challenge: Philip Shen (ROTH Capital Partners) challenged management on the operational impact of the recent FCC foreign inverter action. Shen asked whether SolarEdge had submitted waiver or exemption applications for Nexis, whether an approval process could delay the U.S. Nexis commercial launch by several weeks, and whether the resulting market tailwind was strictly limited to C&I rather than residential.
- Management Response: Nir issued a direct response dismissing the premise of the question, stating: "Nexis is made in the U.S. by a U.S. company. There is no need or reason to ask for exemption. It's [part of / compliant with] the FCC list. Period. And I don't know where that comes from, but it's not true." Nir confirmed that the U.S. Nexis rollout remains on schedule for Q3 with widespread financing platform approvals. Regarding market tailwinds, Nir agreed that C&I is the primary near-term beneficiary, noting that SolarEdge already commands >50% of U.S. commercial rooftop installations and that foreign competitors (SMA and Chint) lack both domestic manufacturing and FEOC compliance.
5. Strategic Themes & Inflection Points
A. Current Period Themes
- Dominant Narratives:
- Operating Profitability Milestone: Management centered its narrative on achieving Non-GAAP operating profitability for the first time in nearly three years, framing the quarter as a critical validation of its multi-quarter turnaround strategy.
- Geographic and Segmental Decoupling: The business is increasingly defined by a bifurcated operating environment. Rapid European storage adoption and dominant U.S. commercial rooftop penetration (>50% market share) have emerged as the primary growth engines, insulating consolidated performance from ongoing stagnation in U.S. residential installations.
- Value-Driven Pricing vs. Peer Discounting: Management explicitly rejected broad-based price reductions, differentiating SolarEdge from competitors that cut prices to protect volumes. The company's narrative emphasizes technological efficiency advantages (such as Nexis round-trip efficiency and energy management software) and regulatory compliance to defend price premiums.
- Operational Focus:
- Nexis Platform Industrialization: Allocating operational and commercial resources to scale three-phase Nexis shipments in Europe while initiating certification and rollouts across major U.S. financing networks ahead of the single-phase European rollout in early 2027.
- Hardware Validation in AI Data Center Power: Transitioning the solid-state transformer (SST) initiative from lab-stage research into live demonstrations with hyperscaler engineering teams, validating direct medium-voltage to 800-volt DC conversion.
- Working Capital and Cash Discipline: Managing working capital velocity under new CFO Maoz Sigron, prioritizing collections and free cash flow generation to fund an accelerated second-half capital expenditure plan.
- Changes in Tone, Messaging, and Disclosures:
- Shift from Defense to Assertive Execution: Compared to the risk-mitigation tone of Q1 2026—which was heavily focused on installer financial distress and bad debt write-downs—management adopted a noticeably more assertive posture in Q2 2026, highlighted by CEO Shuki Nir's defense of Nexis's U.S. manufacturing origin and regulatory standing.
- Cessation of Customer Credit Inquiries: Discussion of customer insolvency risks, which was the dominant theme of the Q1 2026 call following the Freedom Forever bankruptcy, subsided completely during Q2 2026, replaced by questions regarding product scaling, gross margin operating leverage, and trade policy.
- Selective Disclosure Framework: Management continued to withhold granular megawatt shipment volumes and channel sell-through figures (discontinued in Q2 2025). However, it introduced specific commercial milestones for new initiatives (such as European Nexis shipments and installed-base retrofit revenue) while deferring comprehensive multi-year safe harbor metrics to its September 10, 2026 Investor Day.
B. Future Considerations
- Emerging Opportunities:
- Hyperscale Data Center Power Architecture: The SST platform represents an expansion into utility-scale power infrastructure for AI data centers. If successful, management expects this initiative to address multi-gigawatt power delivery requirements beginning with commercial deployments in 2028.
- European Installed Base Monetization: SolarEdge is leveraging its footprint of more than one million residential systems across the Netherlands and DACH regions to drive high-margin battery and software retrofit upsells as European net metering programs expire.
- U.S. Enterprise C&I Expansion: Structural domestic content and FEOC advantages are enabling SolarEdge to capture large enterprise accounts, with penetration now extending to over 60% of Fortune 100 commercial rooftops.
- External Environment:
- U.S. Financing Constraints vs. Regulatory Moats: Sluggish tax equity markets and FEOC regulatory ambiguity continue to delay the recovery of U.S. residential installations. Conversely, tightening trade policies—including domestic content thresholds and the FCC Covered List—are functioning as competitive barriers that limit market access for foreign inverter competitors.
- European Dynamic Tariffs: Rapid utility adoption of dynamic hourly pricing and negative feed-in tariffs in Western Europe is structuralizing consumer demand for DC-coupled storage and automated energy management software.
- AI Supply Chain Competition: Hyperscale data center construction is generating localized supply shortages and pricing pressure in memory components, introducing potential cost headwinds that require active supply chain buffering.
- Transformation Initiatives:
- Domestic Manufacturing as an Export Engine: The completion of SolarEdge's U.S. onshoring program (>90% domestic inverter and optimizer manufacturing) has transitioned from a capital-intensive restructuring initiative into an operational export hub, leveraging Section 45X manufacturing credits to enhance gross margins on shipments to Europe and international markets.
- Product Simplification via Single-SKU Architecture: The transition toward unified hardware SKUs within the Nexis platform is designed to permanently lower distributor working capital requirements, streamline field serviceability, and reduce manufacturing warranty overhead.
- Comparison of Messaging Across Periods:
- Safe Harbor Strategy Evolution: In Q2 2025, safe harbor was treated as an uncertain legislative variable following the passage of the One Big Beautiful Bill Act. By Q1 2026, management established a preference for the physical work test. In Q2 2026, management firmly positioned this method as a structural differentiator against competitors' 5% revenue pull-forwards, framing it as a multi-year baseline that aligns factory revenue with actual project construction schedules.
- AI Power Road Map Progression: Commentary on data center power has progressed methodically over successive calls—moving from high-level architectural concepts in mid-2025, to live partner demonstrations at industry events in Q1 2026, to direct hyperscaler engineering validations of 99% conversion efficiency in Q2 2026, maintaining a consistent commercial timeline targeting 2028 volume production.
- Financial Guidance Conservatism: Under new CFO Maoz Sigron, guidance methodology reflects an increasingly conservative baseline. Formal Q3 2026 gross margin targets exclude already-collected cash tariff refunds, establishing a clear separation between operational manufacturing profitability and non-recurring regulatory recoveries.
6. Key Items to Monitor Next Quarter
A. Prior Quarter Monitoring Review
| Prior Item | Current Status | Management Commentary |
|---|---|---|
| U.S. Installer Channel Financial Health | Mixed Progress | Solvency and credit metrics stabilized during the quarter, with no new bad debt provisions or customer bankruptcy disclosures following the $14.0 million doubtful debt charge in Q1 2026. Strong receivables collections lowered Days Sales Outstanding (DSO) to 55.1 days. However, underlying market conditions remain constrained as tight tax equity funding and Foreign Entity of Concern (FEOC) ambiguity continue to pressure installer cash flows and prompt distributors to restrict inventory purchases. Management noted that the typical third-quarter seasonal pickup in U.S. residential will not materialize in 2026. |
| European Market Recovery and Nexis Sales Velocity | Achieved | European revenue more than doubled year-over-year to $154.4 million (up 36.0% quarter-over-quarter), driven by resilient storage adoption ahead of net metering phaseouts and dynamic electricity tariffs. Commercial scaling of the three-phase Nexis platform commenced successfully, with European shipments exceeding $60.0 million in Q2 2026. Additionally, retrofit campaigns across the Netherlands and the DACH region generated over $20.0 million in upsell revenue from the installed base. |
| "Physical Work Test" Safe Harbor Execution | Achieved | Management secured a significant volume of safe harbor agreements across both residential and commercial sectors prior to the July 4 statutory deadline. Adhering strictly to the physical work test model, these transactions establish multi-year delivery pipelines without pulling forward near-term revenue. Detailed metrics regarding contracted capacity and delivery schedules were deferred to the September 10, 2026 Investor Day. |
| U.S. C&I Market Share Momentum | Ahead of Schedule | SolarEdge expanded its U.S. commercial rooftop installation share to over 50% in the latest industry report, while growing rooftop penetration to more than 60% of Fortune 100 enterprise accounts. Management characterized this position as a structural advantage driven by domestic manufacturing at scale (Texas, Florida, Utah) and full compliance with domestic content, FEOC, and FCC Covered List requirements over competitors such as SMA and Chint. |
| IEEPA Tariff Refund Realization | Achieved | SolarEdge realized a $13.3 million gross profit benefit in Q2 2026 from International Emergency Economic Powers Act (IEEPA) tariff refunds following the U.S. Supreme Court ruling. In July 2026, the company collected an additional $11.5 million in cash refunds (to be accounted for in Q3 results), progressing toward the total anticipated recovery of approximately $55.0 million. |
B. Current Quarter Focus Items
| Category | Item | Timeline | What to Monitor | Why It Matters |
|---|---|---|---|---|
| Strategic | Safe Harbor Contracted Backlog & Revenue Pacing | September 10, 2026 (Investor Day) | Disclosures detailing safe harbor transactions closed ahead of the July 4 deadline, specifically the quantified multi-year revenue pipeline, contracted megawatt volumes, customer mix across TPO and enterprise C&I, and projected deployment pacing over the four-year deployment window. | Validates SolarEdge's differentiated physical work test strategy over competitor 5% safe harbor revenue pull-forwards, securing multi-year revenue visibility and market share while de-risking long-term manufacturing utilization without channel inventory overhang. |
| Operational | Nexis Platform Commercial Scaling & Geographic Rollout | Q3 2026 – Q1 2027 | In the U.S., track volume installation velocity and adoption across approved TPO, prepaid PPA, and loan platforms following Q2 financing certifications. In Europe, monitor market share gains in the DACH region and operational progress toward the Q1 2027 commercial launch of the single-phase Nexis architecture. | Nexis is the core platform underpinning residential margin recovery and market share recapture, delivering €5,000 in additional 15-year homeowner savings via superior round-trip efficiency, driving distributor working capital efficiency through single-SKU simplification, and penetrating larger residential installations (>10 kW). |
| Strategic | AI Factory Solid-State Transformer (SST) Proof-of-Concept & Commercial Roadmap | 2026–2028 (Proof-of-Concept by year-end 2026; Investor Day September 10, 2026) | Delivery of a fully operational 3-phase 34.5 kV proof-of-concept prototype in the laboratory by year-end 2026, the transition of live customer lab demonstrations (validating 99% efficiency direct to 800V DC) into contracted data center pilot installations for 2027, and addressable market sizing models presented at the September 10 Investor Day. | Represents SolarEdge's highest-potential long-term adjacency, positioning the company as a key provider of medium-voltage high-efficiency power infrastructure for hyperscale AI data centers and opening a multi-billion-dollar addressable market ahead of projected 2028 commercial volume shipments. |
| Risk | U.S. Residential Financing Liquidity & FEOC Regulatory Resolution | Next Quarter / Ongoing | Monitor the pace of tax equity funding commitments to TPO financiers, formal Treasury/IRS regulatory guidance establishing clear FEOC definitions, and whether distributors maintain restricted inventory purchasing or resume normal replenishment in Q4. | Protracted tax equity illiquidity and regulatory ambiguity prevent the seasonal recovery of U.S. residential installations, perpetuate cash flow and solvency strains across the installer base, and suppress distributor purchasing velocity in SolarEdge's highest-margin geographic segment. |
| Opportunity | FCC Foreign Inverter Covered List Enforcement & C&I Market Consolidation | 2H 2026 / Ongoing | Enforcement procedures, import restrictions, or channel exclusion of non-compliant foreign inverter manufacturers (such as Chint and SMA) under the FCC Covered List, alongside SolarEdge's ability to expand U.S. C&I rooftop installation share beyond 50% and convert additional Fortune 100 enterprise accounts. | SolarEdge operates as the sole major C&I inverter supplier manufacturing at scale in the U.S. (Texas, Florida, Utah) meeting domestic content, non-FEOC, and FCC Covered List requirements, establishing a structural competitive moat that accelerates commercial rooftop market share consolidation. |
Appendix: Quotes by Theme
-
Operating Profitability: Turnaround Milestone Achieved: Management underscored the return to non-GAAP operating profitability as a validating event for its multi-quarter restructuring, marking the end of nearly three years of operating losses.
"Combined with our continued expense discipline, we delivered non-GAAP operating profitability for the first time in nearly 3 years, an important milestone in our transformation and a reflection of the relentless focus our team has maintained on operational efficiency and customer centricity." — Yehoshua Nir, CEO
vs Q1-FY26:
"At the midpoint of our guidance, we expect to approach breakeven operating profit in the second quarter. This marks an important milestone in our transformation and reflects the relentless focus our entire team has had on operational efficiency and delivering best-in-class products and customer experience." — Yehoshua Nir, CEO
-
Regulatory Scrutiny & FCC Covered List: Nexis Compliance Rebuttal: Management issued an emphatic rejection of analyst suggestions that the platform requires regulatory exemptions under recent FCC foreign inverter actions.
"I'd like to be very, very clear. Nexis is made in the U.S. by a U.S. company. There is no need or reason to ask for exemption. It's [part of / compliant with] the FCC list. Period. And I don't know where that comes from, but it's not true. So it's not going to delay the Nexis rollout in any way, shape or form." — Yehoshua Nir, CEO
-
Safe Harbor Commercial Architecture: Physical Delivery vs. Revenue Pull-Forward: Management defended its decision to bypass the "5% safe harbor" revenue pull-forwards utilized by peers, positioning the multi-year "physical work test" method as a healthier mechanism to lock in long-term share without creating channel inventory overhang.
"...the strong preference is obviously to go with the physical walk test. The physical walk test allows them to align their purchases with their demand basically. So when they need the equipment, they are pulling it or they are buying it from us. That will align our revenue with their purchases, with their installations, and it's a healthier flow of the channel, if you will. And because of that and due to the fact that many of them have seen Nexis, believe in the value that it brings to the table and they understand very well that even in 3 or 4 years from now, it will still be a leading product in the market... they felt comfortable going with the physical walk test safe harbor deals with us." — Yehoshua Nir, CEO
vs Q1-FY26:
"...the 5% safe harbor deals are transactions in which the customer is actually buying the product in the first 100 days after the signing of the contract. And it's not necessarily for products that are going to install in the period. This is why they are referred to as pull forward of revenue. While the physical work test has a built-in advantage to the customers because they will complete the transaction only when they need the product, and this is when they're going to install the product. And from our perspective... it's a future, revenue, and share." — Yehoshua Nir, CEO
-
U.S. Commercial Rooftop Dominance: Moat Deepens to Structural Hegemony: Management upgraded its commercial market narrative from an operational advantage to a structural moat, citing majority installation share and deep Fortune 100 enterprise penetration supported by domestic manufacturing.
"Better execution across EPCs, small C&I customers and enterprise accounts has helped increase our market share to more than 50% of U.S. C&I rooftop installations in the most recent report. In addition, SolarEdge systems are now installed on rooftops of more than 60% of Fortune 100 companies... We have been the only major C&I inverter vendor to deliver U.S.-manufactured products at scale designed to meet domestic content, non-FEOC and FCC Covered List requirements." — Yehoshua Nir, CEO
vs Q1-FY26:
"We view this position as structural rather than cyclical. Domestic content and FEOC compliance are difficult for non-U.S. competitors to replicate quickly. And we expect this continue to support our market share over multiple quarters." — Yehoshua Nir, CEO
vs Q2-FY25:
"In the U.S. C&I segment, we believe that the growing importance of domestic content and increasing FEOC restrictions offer us a compelling opportunity to gain share... we announced a multiyear agreement with Solar Landscape to deploy SolarEdge equipment on more than 500 C&I rooftops across the country. In addition, we signed a multiyear frame agreement with a leading U.S. retailer..." — Yehoshua Nir, CEO
-
U.S. Residential Financing Liquidity: Prolonged Installer Strain Defers Seasonal Recovery: Management acknowledged that persistent illiquidity in tax equity markets and unresolved FEOC definitions continue to compress installer cash flows, eliminating the typical third-quarter seasonal volume uplift.
"The U.S. resi market demand remained soft in the second quarter as customers navigated a slower tax equity funding environment and continued uncertainty around FEOC. This environment has resulted in less funds available to start new projects and to pay for the completion of existing ones. It has put a strain on installers' businesses and cash flows and led to lower purchases from distributors... At the same time, given the continued softness in the market, we do not expect the typical third quarter pickup in the U.S." — Yehoshua Nir, CEO
vs Q1-FY26:
"The market got off to a slow start this year as customers face changes in tax credit policies and uncertainty related to FEOC. These uncertainties have slow tax equity funding for TPOs, creating strain on installer businesses and cash flows. Even so, we believe we are well positioned to benefit when the market rebound..." — Yehoshua Nir, CEO
-
European Market Expansion: From Destocking Relief to Nexis Commercial Ramp: Management highlighted a doubling of European revenue year-over-year, evolving from initial channel inventory normalization into an aggressive commercial ramp for Nexis and storage retrofits ahead of net metering expirations.
"In Europe, we more than doubled our revenue year-over-year as demand for solar grew in anticipation of higher electricity prices and demand for storage increased in anticipation of the phaseout of net metering across several major markets... In the second quarter, we began to meaningfully roll out the 3-phase version of Nexis in Europe with shipments exceeding $60 million." — Yehoshua Nir, CEO
vs Q1-FY26:
"The market was slow in the first 2 months of the year, but picked up in March, a trend that continued into April, driven in part by rising electricity prices in the region... The revenue growth is a result of stronger battery demand in both resi and C&I across the region. I would like to highlight that the strength in Europe is even before we have fully ramped the export of U.S. manufactured products and before the roll out of SolarEdge Nexis platform." — Yehoshua Nir, CEO
vs Q2-FY25:
"As a result, the majority of our distribution partners reached normalized inventory levels at the end of Q2 2025 as we had anticipated. And importantly, we have seen initial market share gains in Europe in the second quarter. That said, our share in Europe is still below what SolarEdge commanded in the past and is well below what I think we can and should be." — Yehoshua Nir, CEO
-
AI Factory Solid-State Transformer (SST): Moving from Concept to Live Engineering Proof: The company's data center power initiative transitioned from internal laboratory development to live customer demonstrations with hyperscalers, validating 99% conversion efficiency directly from medium voltage to an 800-volt DC bus.
"Prospective customers, which importantly included their technical and engineering teams, had the opportunity to see live demonstrations of our SST in our labs. These demonstrations validated several critical elements of the system, including 99% efficiency across a range of power levels, direct conversion from medium-voltage AC to a regulated DC bus and encouraging installation results... Efficiency directly translates into greater compute capacity within a fixed-power envelope." — Yehoshua Nir, CEO
vs Q1-FY26:
"At GTC26, NVIDIA featured a live, energized 800-volt DC power rack which reinforced that high-voltage DC power is moving from concept to infrastructure road map... Since our last call, we've continued to advance our solid-state transformer platform and have made progress toward the system capable of converting 34.5 kilovolt directly to 800-volt DC at efficiencies above 99%." — Yehoshua Nir, CEO
-
Storage Pricing Stability & Product Mix: Resisting Industry Discounting: In contrast to peers implementing price cuts, management confirmed pricing stability across its storage hardware portfolio, asserting that ASP movements reflect product mix rather than margin concessions.
"Overall, our storage prices have remained stable per product. What you're seeing, the differences that you're seeing quarter-to-quarter are mainly due to product mix, I would say. But as I mentioned earlier, we definitely are seeing a growing demand for storage products in general in the market and for our own storage products specifically." — Yehoshua Nir, CEO
vs Q1-FY26:
"So we have not implemented the price cut. And as I mentioned before, we believe that price reflects -- value is reflected in the price. It's not necessarily a cost plus model. And we believe that with the value that we bring to the customers that both in terms of the C&I side... and in the resi side with Nexis... We feel confident that we can gain share, while keeping this premium over competition." — Yehoshua Nir, CEO
-
Sequential Margin Deleveraging: Mathematical Scale vs. Operational Health: In response to analyst scrutiny regarding the guided step-down in Q3 gross margin to 24.0% at the midpoint, management defended underlying operational trajectory by isolating static manufacturing overhead from volume changes.
"The gross margin for Q3, we're expecting 24%. The main reason for that is the scale of the business that is different in Q3 and very much in line with our fixed cost that we have in the cost of goods. And this is actually the main reason. If you take this out, you actually can see a small improvement quarter-over-quarter." — Maoz Sigron, CFO
-
Incoming CFO Capital Allocation Agenda: Milestone Returns and Cash Discipline: On his debut earnings conference call, newly appointed CFO Maoz Sigron outlined three operational and capital allocation priorities focused on strict investment hurdle rates, manufacturing rigor, and liquidity preservation.
"My immediate priorities are continuity and execution, including: first, supporting profitable growth of our core business by ensuring our investments in Nexis and in our offering in the AI factory market are aligned with clear milestones and returns; second, focusing on operational excellence by driving cost discipline and cost structure while strengthening execution rigor across manufacturing and the supply chain; third, managing cash by prioritizing free cash flow generation, maintaining a strong balance sheet and liquidity position." — Maoz Sigron, CFO
Historical Performance