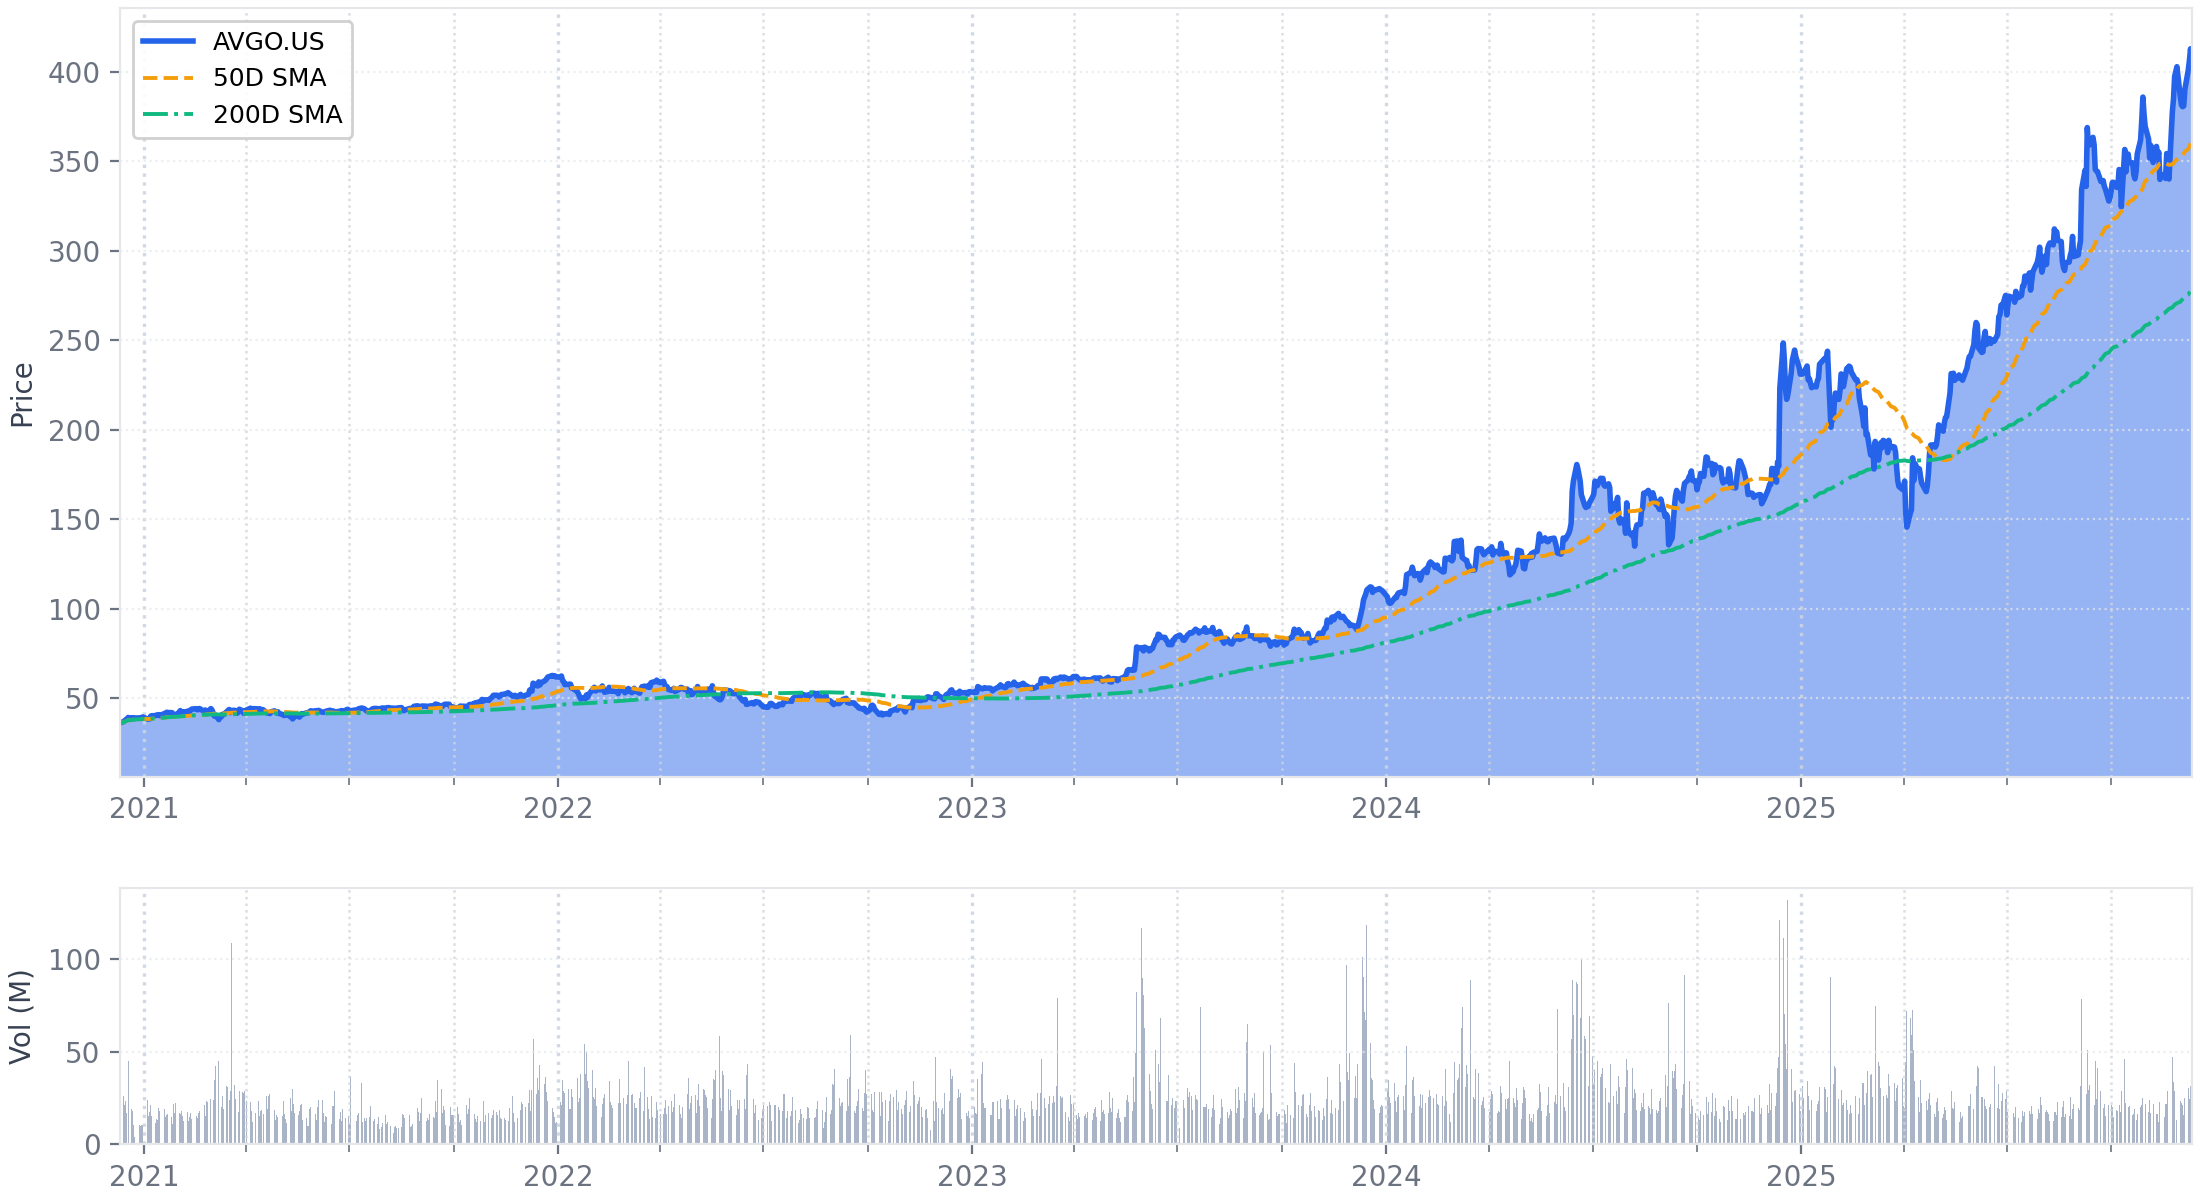
Executive Summary
Broadcom solidified its transformation into an AI powerhouse, announcing a massive $73 billion AI-related order backlog that it expects to deliver over the next 18 months. This provides unprecedented visibility and was bolstered by significant commercial wins, including securing a fifth custom AI accelerator (XPU) customer with a $1 billion order and a large $11 billion follow-on order from its fourth customer. This momentum drove record Q4 results, with revenue reaching $18.0 billion (↑ 28% YoY), and a robust forecast for Q1 FY2026, where management expects AI revenue to double year-over-year to $8.2 billion.
For the full fiscal year 2025, revenue grew 24% to $63.9 billion, while free cash flow increased 39% to $26.9 billion. Based on this strong performance, the company announced a 10% increase in its quarterly dividend. While the non-AI semiconductor business remains stable with limited signs of recovery in enterprise spending, the narrative is now overwhelmingly centered on AI. The company also confirmed a strategic shift toward selling integrated, full-system "racks" for certain customers, aiming to capture more value.
The massive, tangible backlog significantly de-risks Broadcom's multi-year growth trajectory, cementing its position as a primary enabler of hyperscale AI infrastructure builds and overshadowing the cyclical weakness in its legacy markets.
1. Financial Performance Summary
A. Income Statement Metrics (Q4 & Full Year)
Broadcom reported record revenue of $18.0 billion for Q4 (↑ 28% YoY) and $63.9 billion for the full fiscal year 2025 (↑ 24% YoY), beating its prior guidance. The growth was driven by a 74% year-over-year increase in AI semiconductor revenue in the fourth quarter. Profitability also exceeded expectations, with a Q4 adjusted EBITDA margin of 67.8%, surpassing the guided 67%. For the full year, adjusted EBITDA grew 35% to a record $43.0 billion.
| Metric (Non-GAAP unless noted) | Q4 FY2025 | Q4 FY2024 | FY FY2025 | FY FY2024 | Notes |
|---|---|---|---|---|---|
| Total Net Revenue | $18.02 B | $14.05 B | $63.89 B | $51.57 B | Q4 ↑ 28.2%, FY ↑ 23.9%. Beat Q4 guidance of ~$17.4B, driven by stronger-than-expected AI semiconductor and software results. |
| — Semiconductor Solutions | $11.07 B | $8.23 B | $36.86 B | $30.10 B | Q4 ↑ 34.5%, FY ↑ 22.5%. Growth driven by a 74% YoY increase in AI revenue in Q4. |
| — Infrastructure Software | $6.94 B | $5.82 B | $27.03 B | $21.48 B | Q4 ↑ 19.2%, FY ↑ 25.8%. Strong adoption of VMware Cloud Foundation (VCF) was a key driver. |
| Gross Margin | 77.9% | 76.9% | 78.6% | 76.5% | Q4 was better than guided due to higher software revenues and favorable product mix within semiconductors. |
| Operating Income (GAAP) | $7.51 B | $4.63 B | $25.48 B | $13.46 B | Q4 ↑ 62.2%, FY ↑ 89.3%. Q4 margin 41.7%, FY margin 39.9%. |
| Operating Income (Non-GAAP)[1] | $11.92 B | $8.81 B | $42.00 B | $30.74 B | Q4 ↑ 35.3%, FY ↑ 36.6%. Q4 margin 66.2%, FY margin 65.7%. Operating leverage drove a 70 bps sequential margin increase in Q4. |
| — Semiconductor Solutions Margin | 59.0% | 56.0%[2] | — | 56.0%[2] | Q4 up 250 bps YoY. |
| — Infrastructure Software Margin | 78.0% | 72.0%[2] | — | 72.0%[2] | Q4 up 600 bps YoY, reflecting completion of VMware integration. |
| Net Income (GAAP) | $8.52 B | $4.32 B | $23.13 B | $5.90 B | Q4 ↑ 97.1%, FY ↑ 292.1%. |
| Net Income (Non-GAAP)[1] | $9.71 B | $6.97 B | $33.73 B | $23.73 B | Q4 ↑ 39.3%, FY ↑ 42.1%. |
| Diluted EPS (GAAP) | $1.74 | $0.90 | $4.77 | $1.23 | Q4 ↑ 93.3%, FY ↑ 287.8%. |
| Diluted EPS (Non-GAAP)[1] | $1.95 | $1.42 | $6.82 | $4.87 | Q4 ↑ 37.3%, FY ↑ 40.0%. |
| Adjusted EBITDA[1] | $12.22 B | $9.09 B | $43.00 B | $31.90 B | Q4 ↑ 34.4%, FY ↑ 34.8%. Q4 margin of 67.8% beat guidance of 67%. |
Footnotes
- Non-GAAP figures exclude items such as amortization of acquisition-related intangible assets, stock-based compensation, and restructuring charges. For Q4 FY25, total adjustments to operating income were $4.41B. For FY25, total adjustments were $16.51B. Full reconciliations are provided in the company's 8-K filing.
- Prior year segment operating margin figures are sourced from the Q4 FY2024 earnings transcript.
B. Balance Sheet Highlights
Broadcom ended the fiscal year with a robust cash position of $16.2 billion, an increase of $5.5 billion from the prior quarter, driven by strong free cash flow generation. The company maintained discipline in working capital management, with days of inventory decreasing sequentially to 58 days.
| Metric | Nov 2, 2025 | Nov 3, 2024 | Change | Notes |
|---|---|---|---|---|
| Cash & Cash Equivalents | $16.18 B | $9.35 B | ↑ 73.0% | Increased by $5.5B sequentially in Q4. |
| Total Debt[1] | $65.14 B | $67.57 B | ↓ 3.6% | Comprised of $3.15B in short-term and $61.98B in long-term debt. |
| Net Debt[2] | $48.96 B | $58.22 B | ↓ 15.9% | Deleveraging remains a focus following the VMware acquisition. |
| Accounts Receivable, net | $7.15 B | $4.42 B | ↑ 61.8% | Days Sales Outstanding (DSO) was 36 days, compared to 29 days in the prior year period. |
| Inventory | $2.27 B | $1.76 B | ↑ 29.0% | Days of Inventory (DOI) was 58 days, down from 66 days in Q3. |
| Shareholders' Equity | $81.29 B | $67.68 B | ↑ 20.1% | Increased due to retained earnings from strong profitability. |
Footnotes
- Total Debt is the sum of short-term debt ($3,152M) and long-term debt ($61,984M) from the consolidated balance sheet.
- Net Debt is calculated as Total Debt less Cash & Cash Equivalents: $65.14B - $16.18B = $48.96B.
C. Cash Flow Analysis
The company generated a record $26.9 billion in free cash flow for fiscal 2025, a 39% year-over-year increase, representing a strong 42.1% margin on revenue. In Q4, free cash flow was $7.5 billion. Broadcom returned $17.5 billion to shareholders during the fiscal year through a combination of dividends and share repurchases.
| Metric | Q4 FY2025 | Q4 FY2024 | FY FY2025 | FY FY2024 | Notes |
|---|---|---|---|---|---|
| Cash from Operations | $7.70 B | $5.60 B | $27.54 B | $19.96 B | Q4 ↑ 37.5%, FY ↑ 38.0%. |
| Capital Expenditures | ($0.24 B) | ($0.12 B) | ($0.62 B) | ($0.55 B) | — |
| Free Cash Flow[1] | $7.47 B | $5.48 B | $26.91 B | $19.41 B | Q4 ↑ 36.2%, FY ↑ 38.6%. FY FCF margin was 42.1%. |
| Dividend Payments | ($2.80 B) | ($2.48 B) | ($11.14 B) | ($9.81 B) | Q4 ↑ 12.7%, FY ↑ 13.5%. |
| Share Repurchases & Eliminations (Net)[2] | $0.00 B | ($1.20 B) | ($6.31 B) | ($12.39 B) | FY25 includes $2.45B in programmatic repurchases and $3.86B for tax withholdings on vested equity. |
| Debt Activity (Net)[3] | $0.85 B | ($2.50 B) | ($2.81 B) | $20.35 B | Q4 reflects net proceeds from borrowings. FY reflects net repayments. |
Footnotes
- Free Cash Flow is calculated as Cash from Operations less Capital Expenditures and matches the company's reported figure.
- Net Share Repurchases & Eliminations is calculated from the cash flow statement (Repurchases of common stock + Shares repurchased for tax withholdings on vesting of equity awards). Q4 FY25: $0M. FY25: $2,450M + $3,860M = $6,310M.
- Net Debt Activity is calculated from the cash flow statement (Proceeds from borrowings - payments on debt obligations - repayments of commercial paper, net). Q4 FY25: $4,971M - $3,638M - $488M = $845M. FY25: $15,666M - $18,478M - $0M = ($2,812M).
D. Key Financial Ratios
Leverage improved significantly year-over-year, with the Net Debt to Adjusted EBITDA ratio falling to 1.1x from 1.8x, reflecting strong earnings growth and debt reduction. Return on Equity increased substantially due to a sharp rise in net income.
| Metric | FY 2025 | FY 2024 | Change | Notes |
|---|---|---|---|---|
| Return on Equity (ROE)[1] | 31.1% | 8.7%[2] | ↑ 2,240 bps | Improved due to a 292% increase in GAAP Net Income. |
| Net Debt to Adjusted EBITDA[3] | 1.1x | 1.8x | -0.7x | Deleveraging improved the ratio, driven by higher EBITDA and debt paydown. |
| Days Sales Outstanding (DSO) | 36 days | 29 days | +7 days | Management noted DSO was 36 days vs 29 days a year ago. |
| Days Inventory Outstanding (DIO) | 58 days | N/A | N/A | Management stated DOI was 58 days in Q4, down from 66 days sequentially. Prior year data not provided. |
Footnotes
- Return on Equity = Net Income / Average Shareholders' Equity. FY25: $23,126M / (($81,292M + $67,678M)/2) = 31.1%.
- FY24 ROE is calculated using period-end equity as average equity data for the period was not available in the filings. FY24: $5,895M / $67,678M = 8.7%.
- Net Debt to Adjusted EBITDA = Net Debt at period end / Full Year Adjusted EBITDA. FY25: $48.96B / $43.00B = 1.1x. FY24: $58.22B / $31.90B = 1.8x.
E. Operational Metrics & Business Performance
Broadcom's operational performance was highlighted by the accelerating momentum in its AI business, which now accounts for a significant portion of its semiconductor revenue. The company announced a fifth custom silicon (XPU) customer and a substantial backlog, signaling strong demand visibility.
| Metric | Q4 FY2025 | Q4 FY2024 | FY FY2025 | FY FY2024 | Notes |
|---|---|---|---|---|---|
| AI Revenue | $6.5 B | $3.7 B[1] | $20.0 B | $12.2 B[1] | Q4 ↑ 74.3%, FY ↑ 63.9%. Growth trajectory has exceeded 10x over the past 11 quarters. |
| Non-AI Semi Revenue[2] | $4.6 B | $4.5 B[1] | $16.9 B | $17.8 B[1] | Q4 ↑ 2.2%, FY ↓ 5.1%. Broadband showed solid recovery, while enterprise spending remains weak. |
| AI as % of Semi Revenue | 58.7% | 45.0% | 54.3% | 40.5% | The mix continues to shift significantly toward AI. |
| Consolidated Backlog | $162 B | — | $162 B | — | New metric disclosed. Comprised of $73B for AI, $73B for Software, and $16B for non-AI semi. |
| — AI Backlog | $73 B | — | $73 B | — | Expected to be delivered over the next 18 months. |
Footnotes
- Prior year AI and Non-AI revenue figures sourced from the Q4 FY2024 earnings transcript.
- Non-AI Semiconductor Revenue is calculated as Total Semiconductor Solutions Revenue less AI Revenue. Q4 FY25: $11.07B - $6.5B = $4.57B (~$4.6B). FY25: $36.86B - $20.0B = $16.86B (~$16.9B).
2. Forward-Looking Guidance
A. Guidance Summary
Broadcom provided a robust outlook for Q1 FY2026, forecasting consolidated revenue of $19.1 billion (↑ 28% YoY), driven by the continued acceleration of its AI business. Management expects AI semiconductor revenue to double year-over-year to $8.2 billion. The company also initiated full-year 2026 guidance, projecting that AI revenue will continue to accelerate, non-AI semiconductor revenue will remain stable, and infrastructure software will grow at a low double-digit rate.
| Metric | Period | Current Guidance | Prior Guidance | Change | Management Commentary |
|---|---|---|---|---|---|
| Consolidated Revenue | Q1 FY2026 | ~$19.1 B | N/A | New | Represents ~28% YoY growth. |
| Adjusted EBITDA Margin | Q1 FY2026 | ~67% | N/A | New | Expected to be approximately flat sequentially. |
| Semiconductor Revenue | Q1 FY2026 | ~$12.3 B | N/A | New | Represents ~50% YoY growth. |
| — AI Revenue | Q1 FY2026 | $8.2 B | N/A | New | Expected to double year-over-year (↑ ~100%). |
| — Non-AI Revenue | Q1 FY2026 | ~$4.1 B | N/A | New | Forecast to be approximately flat year-over-year. |
| Infrastructure Software Revenue | Q1 FY2026 | ~$6.8 B | N/A | New | Represents ~2% YoY growth. |
| Non-GAAP Tax Rate | FY 2026 | ~6.5%[1] | N/A | New | Increase from 14% attributed to the global minimum tax and a shift in the geographic mix of income. |
| AI Revenue Growth | FY 2026 | To continue to accelerate | Growth rate to accelerate vs. FY2025[2] | Reaffirmed | AI is expected to drive most of the company's growth in FY2026. |
| AI Backlog Delivery | Next 18 mos. | $73 B | N/A | New | The current $73B AI backlog is scheduled for delivery over the next six quarters, with management expecting further orders to be booked for shipment within this timeframe. |
| Infrastructure Software Growth | FY 2026 | Low double-digit % | N/A | New | Growth will continue to be driven by VMware. |
| Non-AI Semi Outlook | FY 2026 | Stable | "U-shaped recovery" into mid-to-late FY2026[2] | Maintained | Outlook remains consistent with a gradual, non-accelerating recovery. |
Footnotes
- Management stated the tax rate would "increase from 14% to approximately 6.5%," which appears to be a typo in the transcript as this represents a decrease. A rate of 16.5% may have been intended.
- Prior guidance was provided during the Q3 FY2025 earnings call.
B. Additional Notes & Commentary
-
Q1 FY2026 Modeling Assumptions:
- Gross Margin: Consolidated gross margin is expected to decline by approximately 100 basis points sequentially in Q1, primarily due to a higher mix of AI revenue.
- Share Count: The non-GAAP diluted share count for Q1 is forecast to be approximately 4.97 billion shares, excluding the potential impact of share repurchases.
-
Capital Allocation Updates:
- Dividend Increase: The quarterly common stock cash dividend was increased by 10% to $0.65 per share, implying a record target annual dividend of $2.60 per share for fiscal 2026. This marks the 15th consecutive annual dividend increase.
- Share Repurchase Program: The board approved an extension of the existing share repurchase program, of which $7.5 billion remains, through the end of calendar year 2026.
3. Operational & Strategic Developments
A. Business Performance & Operations
Broadcom's operational performance was characterized by an explosive acceleration in its AI business, which secured a fifth major customer and saw its order book swell to over $70 billion. In contrast, the non-AI semiconductor segment showed signs of stabilization but no significant recovery, while the infrastructure software business continued its steady growth trajectory post-VMware integration.
-
AI and Networking Momentum: The AI segment's growth continued to accelerate, driven by both custom silicon (XPUs) and networking components.
- Fifth XPU Customer Secured: Broadcom announced it has acquired a fifth custom AI accelerator (XPU) customer, who placed a $1 billion order for delivery in late 2026. This follows the addition of the fourth customer in the prior quarter.
- Major Follow-on Orders: The fourth XPU customer, secured in Q3, placed an additional $11 billion order in Q4 for delivery in late 2026, a strong validation of the partnership on top of the initial $10 billion order.
- Massive AI Backlog: The company disclosed a total AI-related order backlog of $73 billion, which it expects to deliver over the next 18 months. Management noted this is a "snapshot" and expects more orders to be booked for shipment within that period.
- The backlog consists of approximately $53 billion in XPUs and $20 billion in other AI components, including networking switches, DSPs, optical components, and PCIe switches.
- Record Networking Demand: The order backlog for AI switches now exceeds $10 billion. Management highlighted record booking rates for its latest 102 terabit per second Tomahawk 6 switch, calling it one of the fastest-ramping switch products in the company's history.
-
Non-AI Semiconductor Performance: The segment showed signs of bottoming, with a sequential recovery driven by seasonality, but underlying enterprise demand remains weak.
- Q4 Performance: Revenue of $4.6 billion was up 2% year-over-year, with a solid recovery in broadband and flat performance in wireless. However, other end markets tied to enterprise spending continued to decline.
- Outlook Remains Muted: The forecast for Q1 FY2026 is for revenue to be flat year-over-year at $4.1 billion. This outlook is consistent with the "U-shaped recovery" narrative from the prior quarter, with management seeing limited signs of a broad-based enterprise spending recovery.
-
Infrastructure Software Performance: The segment exceeded expectations, driven by strong bookings and the continued adoption of VMware Cloud Foundation (VCF).
- Strong Bookings: The total contract value booked in Q4 exceeded $10.4 billion, a significant increase from $8.2 billion in the same period last year.
- Growing Backlog: The infrastructure software backlog ended the fiscal year at $73 billion, up from $49 billion a year ago, providing significant revenue visibility.
B. Strategic Initiatives
The company's strategic focus remains centered on deepening its leadership in custom AI silicon, including a move toward selling integrated systems, and securing its advanced manufacturing supply chain to support its massive backlog.
-
Expansion of Custom Silicon Model:
- System-Level Sales: For its fourth customer, Broadcom is delivering a complete system or "rack" sale, not just the XPU chip. Management stated, "it begins to make sense to do it as a system sales and be... fully responsible for the entire system." This strategic shift allows Broadcom to capture more value but has implications for gross margins.
- Pushback on "Customer-Owned Tooling": The CEO characterized the idea that hyperscale customers will increasingly bring all silicon design in-house as an "overblown hypothesis," arguing that the rapid evolution of silicon technology and the need to compete with merchant GPUs make partnership with specialists like Broadcom a durable model.
-
Supply Chain Fortification:
- Management is actively addressing potential supply chain bottlenecks for leading-edge technologies (3nm/2nm wafers, advanced substrates, HBM).
- The company is building a "fairly substantial" advanced packaging facility in Singapore. The primary motivation is not cost savings but to achieve supply chain security and delivery assurance by partially insourcing this critical step.
-
OpenAI Partnership Clarification:
- In the Q&A, management clarified that its relationship with OpenAI consists of two distinct parts:
- A long-term 10-gigawatt alignment for the 2027-2029 timeframe.
- A separate XPU development program that is at a "very advanced stage" and is expected to progress "very, very quickly."
- In the Q&A, management clarified that its relationship with OpenAI consists of two distinct parts:
C. Risk Factors & Headwinds
-
Gross Margin Dilution from AI Mix (Acknowledged Risk):
- Management explicitly confirmed that the growing mix of AI revenue, particularly the move to lower-margin system sales, will continue to pressure consolidated gross margins. The Q1 gross margin guidance reflects this, with an expected 100 bps sequential decline.
- However, the company expects this to be offset by significant operating leverage. As the CFO noted, "operating margin dollars will go up, but the margin itself, a percentage of revenues will come down a bit."
-
Weak Enterprise Spending (Persistent):
- The lack of recovery in non-AI semiconductor end markets tied to enterprise spending remains a persistent headwind. This is consistent with cautious commentary from the past several quarters and the "U-shaped" recovery outlook provided in Q3.
-
Supply Chain Execution (Managed Risk):
- While management expressed confidence in its supply chain strategy, the sheer scale of the $73 billion AI backlog makes execution on leading-edge manufacturing and advanced packaging a critical ongoing risk. Any disruption could impact the company's ability to meet its aggressive delivery targets.
-
Reporting and Transparency:
- Dynamic AI Forecast: While providing unprecedented visibility with the $73 billion AI backlog figure, management emphasized that it is a "moving target" and declined to provide a precise full-year revenue forecast for fiscal 2026, citing the dynamic nature of bookings. This maintains a degree of uncertainty for financial models despite the strong backlog.
4. Q&A Session Key Themes
The Q&A session was dominated by intense analyst focus on quantifying the scale and durability of Broadcom's AI business, particularly dissecting the newly disclosed $73 billion AI backlog. Management maintained a confident tone, providing unprecedented long-term visibility while consistently deflecting attempts to secure a precise full-year fiscal 2026 revenue forecast.
A. Analyst Focus Areas
Analysts repeatedly sought to understand the implications of the massive AI backlog, the nature of new customer engagements, and the long-term strategic positioning of the custom silicon business.
-
Deconstructing the $73 Billion AI Backlog: This was the primary focus for nearly every analyst.
- Recurring Questions: Multiple analysts attempted to translate the $73 billion figure deliverable over 18 months into an annualized revenue run rate, often arriving at a figure north of $50 billion for fiscal 2026.
- Management Response: The CEO consistently characterized the $73 billion as a "snapshot" or a "milestone," not a ceiling. He emphasized that with lead times of six to twelve months, the company fully expects to book additional orders for shipment within that 18-month window, implying the final revenue figure will be higher.
-
Nature of New Customer Wins & Sales Model:
- Recurring Questions: Analysts probed for details on the newly announced fifth XPU customer and the large follow-on order from the fourth. Questions centered on the sales model (rack-level system vs. individual chip) and the identity of the customers, with specific inquiries about OpenAI.
- Management Response: The CEO confirmed that for the fourth customer, the engagement is a "real system sale," where Broadcom is responsible for the entire rack. He also clarified the OpenAI relationship, distinguishing between a long-term (2027-2029) 10-gigawatt strategic alignment and a separate, near-term XPU development program that is at a "very advanced stage." He explicitly declined to name the fifth customer.
-
Long-Term Viability of the Custom Silicon Model:
- New Strategic Question: An analyst introduced a new line of questioning regarding the emerging debate around "customer-owned tooling," where hyperscalers might take more of the design process in-house.
- Management Response: The CEO delivered a forceful rebuttal, calling the concept an "overblown hypothesis." He argued that the rapid pace of silicon innovation and the need to compete with vertically integrated merchant GPU providers makes a partnership model with specialists like Broadcom a more effective long-term strategy for LLM developers.
B. Performance Deep Dives
Analysts drilled down into the financial and operational implications of the AI segment's explosive growth, focusing on margin trajectory and supply chain execution.
-
Margin Trajectory in an AI-Dominated Mix:
- Analysts directly addressed the financial model implications of shifting toward lower-margin AI revenue, particularly system-level sales. One analyst asked if consolidated gross margins could eventually fall into the 60s.
- Management confirmed the expected pressure on gross margin percentage, guiding for a 100 bps sequential decline in Q1. However, they stressed that the model is built on operating leverage. The CFO stated that while the operating margin percentage may "come down a bit" over time, the absolute operating margin dollars will continue to grow significantly due to the sheer scale of revenue growth against a more fixed R&D and SG&A base.
-
Supply Chain and Execution Risks:
- Given the massive backlog, analysts questioned the company's ability to secure sufficient supply of leading-edge components, including 3nm/2nm wafers, advanced substrates (CoWos), and HBM.
- Management expressed confidence, noting they are constantly working to expand capacity. A key strategic initiative highlighted was the construction of a "fairly substantial" advanced packaging facility in Singapore, aimed at ensuring "supply chain security and delivery" rather than just cost reduction.
-
Non-AI Semiconductor Outlook:
- In contrast to the intense focus on AI, there was only one direct question regarding the non-AI business.
- Management's response was consistent with the prior quarter's "U-shaped recovery" theme, stating that while broadband is recovering well, the broader business shows "limited signs of recovery" in enterprise spending. The outlook for FY2026 is for this segment to be "stable."
C. Analyst Challenges & Concerns
While the tone of the call was overwhelmingly positive, analysts persistently challenged management to provide more specific long-term guidance and clarity on strategic positioning.
-
Push for a Definitive FY2026 AI Revenue Target: The most consistent point of tension was analysts' attempts to corner management into providing a concrete full-year 2026 AI revenue forecast. Analysts repeatedly presented their own calculations based on the backlog figure and asked for confirmation. The CEO skillfully deflected each attempt, reiterating that the backlog is a dynamic number and that he would not provide guidance beyond the current quarter, effectively maintaining strategic flexibility.
-
Customer Identification: Analysts made several attempts to identify the new XPU customers, specifically asking if the fifth customer or the OpenAI partnership accounted for the new orders. Management adeptly separated the issues, clarifying the OpenAI relationship without confirming its link to a specific customer win, thereby protecting customer confidentiality.
5. Strategic Themes & Inflection Points
A. Current Period Themes
-
Dominant Narratives:
- AI Acceleration Quantified: The central theme shifted from a qualitative forecast to a quantitative one. The prior quarter's narrative of "accelerating" AI growth was substantiated this quarter with the disclosure of a massive $73 billion AI-related backlog deliverable over the next 18 months. This provides unprecedented, tangible visibility into the medium-term revenue trajectory.
- Validation of Custom Silicon Model: The custom accelerator (XPU) strategy was significantly de-risked and validated by two key events: the signing of a fifth major customer and a large $11 billion follow-on order from the fourth customer secured just last quarter.
- Strategic Shift to System-Level Value Capture: Management confirmed a move beyond selling standalone chips to delivering fully integrated systems or "racks" for certain XPU customers. This represents a strategic evolution to capture more value within the AI ecosystem, albeit with acknowledged implications for gross margin percentages.
-
Changes in Tone & Messaging:
- From Directional to Definitive Visibility: The most significant change from prior quarters was the shift in communication regarding the AI outlook. Management moved from providing directional guidance ("growth will accelerate") to offering a concrete backlog figure ($73 billion) that anchors financial models. This signals a material increase in confidence and a willingness to provide long-term visibility.
- New Disclosure Framework: Updated its consolidated backlog disclosure to a record $162 billion, up from $110 billion in the prior quarter, and provided a detailed breakdown for the first time between AI, Software, and non-AI semiconductors. This enhanced metric is intended to frame the company's overall long-term revenue stability and growth profile.
- Proactive Defense of Partnership Model: In a new and forceful messaging point, the CEO proactively addressed and dismissed the "customer-owned tooling" narrative, defending the durability of Broadcom's partnership model by emphasizing the intense pace of silicon innovation required to remain competitive.
B. Future Considerations
-
Emerging Opportunities:
- Converting the Final AI Prospects: The company's highly selective pipeline of seven target LLM developers still includes two prospects. The successful conversion of these remaining players into revenue-generating customers represents the next major catalyst for expanding the AI SAM.
- Expansion of System-Level Sales: The rack-level sale to the fourth customer serves as a potential template for future large-scale engagements. Success here could lead to a broader adoption of this higher-value, integrated sales model across its custom silicon business.
-
External Environment:
- Hyperscaler Capex Dependency: The AI growth story remains fundamentally tied to the capital expenditure cycles and specific deployment timelines of a concentrated set of hyperscale customers. Any change in their strategic priorities or spending pace is the most significant external variable.
- Persistent Enterprise Weakness: The muted recovery in the non-AI business is directly linked to the macro environment for enterprise and telco spending. The "stable" outlook for this segment in FY2026 suggests management does not see a near-term catalyst for a broad-based rebound.
-
Transformation Initiatives:
- The company's transformation into an AI-centric powerhouse is accelerating. The rapid growth of the AI segment is fundamentally reshaping Broadcom's revenue mix, margin structure, and go-to-market strategy (i.e., system sales). The primary internal initiative is now centered on executing the massive AI backlog, which requires significant focus on securing the advanced manufacturing and packaging supply chain.
6. Key Items to Monitor Next Quarter
A. Prior Quarter Monitoring Review
Broadcom made significant and measurable progress on all key items identified in the previous quarter. The company upgraded its AI outlook with a tangible backlog figure, converted another AI prospect into a customer, and saw record adoption of its new networking hardware, effectively achieving or exceeding expectations across its primary strategic initiatives.
| Prior Item | Current Status | Management Commentary |
|---|---|---|
| Conversion of Remaining AI Prospects | Achieved | The company successfully converted one of its three remaining prospects into its fifth qualified XPU customer, securing a $1 billion initial order. |
| Pace and Shape of Non-AI Semiconductor Recovery | On Track | Management's forecast for flat YoY non-AI revenue in Q1 and a "stable" outlook for FY2026 aligns with the previously communicated "U-shaped" recovery, as enterprise spending shows "limited signs of recovery." |
| Execution of VMware "Phase Two" (Deployment & Upsell) | No Update | While management noted strong software bookings and VCF adoption driving revenue, there was no specific update on the "Phase Two" deployment and upsell strategy outlined in the prior quarter. |
| Commercial Adoption of New Networking Portfolio | Achieved & Ahead of Schedule | The company reported a significant acceleration in adoption, with the AI switch backlog exceeding $10 billion and the Tomahawk 6 switch booking at "record rates," indicating a successful and rapid commercial ramp. |
| Granularity on the $110B Backlog | Achieved | Management significantly increased transparency, updating the consolidated backlog to $162 billion and providing a breakdown: $73B for AI, $73B for Infrastructure Software, and the remainder for non-AI semiconductors. |
B. Current Quarter Focus Items
For the upcoming quarters, the focus shifts from forecasting AI acceleration to executing against the massive, disclosed backlog. Key items include managing the margin implications of a changing sales model, converting the final AI prospects, and ensuring the timely ramp of new customers, all while monitoring the stabilization of the non-AI business.
| Category | Item | Timeline | What to Monitor | Why It Matters |
|---|---|---|---|---|
| Operational / Risk | Execution of the $73B AI Backlog | Next 18 months | The pace of revenue conversion from this backlog, any commentary on supply chain constraints (3nm/2nm wafers, advanced packaging), and the rate of new bookings being added on top of the existing backlog. | The $73B AI backlog is the single most important driver of Broadcom's medium-term growth. Successfully executing this massive order book is critical to meeting heightened expectations, and any supply chain disruptions present a significant risk to the revenue trajectory. |
| Strategic / Risk | Margin Impact of System-Level Sales | Ongoing (H2 FY26+) | The trajectory of consolidated gross margin and semiconductor segment operating margin. Specifically, watch for management's ability to offset gross margin pressure with operating leverage as guided. | The strategic shift to selling full "racks" or systems captures more value but comes with lower gross margins. Validating the model's profitability through operating leverage is crucial to proving that the shift is accretive to overall earnings power and not just a revenue growth story. |
| Opportunity / Strategic | Progress with Remaining AI Prospects | Ongoing | Any commentary on the conversion of the remaining two XPU prospects into qualified customers with production orders. | Each new hyperscale customer represents a multi-billion-dollar, multi-year revenue stream. Converting the final two prospects would further de-risk the long-term AI growth narrative, expand the SAM, and solidify Broadcom's position as the leading custom silicon partner. |
| Operational / Opportunity | Ramp of New XPU Customers (4th & 5th) | Late 2026 | Updates on the development and production timelines for the fourth customer (with its $21B in orders) and the fifth customer ($1B order). Any pull-ins or delays in their expected "late 2026" delivery schedules. | These two new customers are key to sustaining growth momentum beyond the current base. Their successful and timely ramp is essential for diversifying the AI customer base and meeting the aggressive growth implied by the backlog. |
| Risk / Operational | Stabilization of the Non-AI Semiconductor Business | Ongoing through FY2026 | Sequential and YoY growth trends in the non-AI segment revenue. Watch for any deviation from the guided "stable" outlook for FY2026, particularly signs of either renewed deterioration or a surprising acceleration in enterprise spending. | While AI is the growth driver, the non-AI business still represents a substantial revenue base (~$17B in FY25). A failure to stabilize would create a significant headwind to consolidated results, while a faster-than-expected recovery would provide material upside to the overall financial model. |
Appendix: Quotes by Theme
-
AI Revenue Trajectory Shifts from a Forecast to a Tangible Backlog: Management's commentary on the AI outlook evolved from a qualitative forecast of "acceleration" in Q3 to the disclosure of a massive, quantitative backlog in Q4, providing unprecedented visibility into the medium-term revenue stream.
"as of now, we have $73 billion of backlog in place, account of XPU switches, DSPs, lasers, for AI data centers that we anticipate shipping over the next eighteen months. And... we fully expect more bookings to come in over that period of time. And so do not take that $73 billion as that's the revenue we ship over the next eighteen months." — Hock Tan, CEO
vs. Q3-FY25:
"we're seeing the growth rate accelerate. As opposed to just remain steady at that 50, 60% We are expecting and seeing 2026 to accelerate more than the growth rate we see in '25." — Hock Tan, CEO
-
Custom Silicon (XPU) Model Validated with New Customer and Major Follow-on Order: The company announced its fifth XPU customer and a significant follow-on order from its fourth, signaling strong validation and accelerating momentum for its custom silicon strategy.
"I am pleased today to report that during this quarter, we acquired a fifth XPU customer through a $1 billion order placed for delivery in late 2026. In this quarter Q4, we received an additional $11 billion order from this same customer [customer #4] for delivery in late 2026." — Hock Tan, CEO
vs. Q3-FY25:
"Last quarter, one of these prospects released production orders to Broadcom. And we have accordingly characterized them as a qualified customer for XPUs. And in fact, has secured over $10 billion of orders of AI regs based on our XPUs." — Hock Tan, CEO
-
Strategic Shift to System-Level Sales in AI: In a significant evolution of its business model, management confirmed it is selling entire integrated systems ("racks") to its newer custom silicon customers, aiming to capture more value beyond the chip level.
"It's a system sale. How about that? It's a real system sale... we believe it begins to make sense to do it as a system sales and be... fully responsible for the entire system or rack as you call it." — Hock Tan, CEO
-
Forceful Rebuttal of "Customer-Owned Tooling" Threat: The CEO directly addressed the narrative that hyperscalers will bring all silicon design in-house, dismissing it as an "overblown hypothesis" and defending the durability of Broadcom's partnership model.
"I see that as this concept of customer tooling is an overblown hypothesis which frankly I do not think will happen... if you are an LLM player, where do you put your resources in order to compete...? Especially when you have to compete at the end of the day against merchant GPU. Who are not slowing down in their rate of evolution." — Hock Tan, CEO
-
Explicit Guidance on Margin Structure Shift: Management clearly articulated the financial trade-off of its accelerating AI business: consolidated gross margin percentages will face pressure, but this will be more than offset by operating leverage driving higher operating margin dollars.
"we expect operating leverage to benefit us at the operating margin level even as gross margin will start to deteriorate." — Hock Tan, CEO
"operating margin dollars will go up, but the margin itself, a percentage of revenues will come down a bit." — Kirsten Spears, CFO
-
Cautious Outlook for Non-AI Semiconductor Recovery Maintained: The commentary on the non-AI business remains consistent with the prior quarter, with management signaling a "stable" environment and seeing "limited signs of recovery" in enterprise spending.
"in Q1, we forecast non-AI semiconductor revenue to be approximately $4.1 billion, flat from a year ago... enterprise spending continued to show limited signs of recovery." — Hock Tan, CEO
vs. Q3-FY25:
"I'm expecting to see more of a u shaped recovery in non AI. And perhaps by... mid twenty six, late twenty six, we'll start to see some meaningful recovery. But as of right now, not clear." — Hock Tan, CEO
-
Record Demand for AI Networking Hardware: The company provided new, specific metrics on its networking business, highlighting a massive order book and record demand for its latest generation of high-speed switches.
"Our current order backlog for AI switches exceeds $10 billion as our latest 102 terabyte terabit per second Tomahawk six switch... continues to book at record rates. This is one of the fastest-growing products in terms of deployment that we have ever seen." — Hock Tan, CEO
-
Analyst Focus Remains on Quantifying the AI Revenue Ramp: The Q&A was dominated by analysts attempting to translate the new $73 billion backlog figure into a concrete fiscal 2026 revenue forecast, a dynamic similar to the prior quarter but with more specific data points.
"Just wanted to clarify, Hock, you said $73 billion over eighteen months for AI. That's, you know, roughly $50 billion plus for fiscal 2026... I just wanted to make sure I got that right." — Vivek Arya, Analyst
"Hock, again, I just want to sort of verify this... you talked about total AI backlog of $73 billion over the next six quarters... as time moves forward, that backlog number for more shipments in '26 will probably still go up. Right? Is that the correct interpretation?" — Harlan Sur, Analyst
Hock Tan's response: "You can say that $73 billion is the backlog we have today. To ship over the next six quarters... we expect revenue a minimum revenue, one way to look at it, of $73 billion over the next six quarters. But we do expect much more as more orders come in."
Historical Performance