Executive Summary
Annaly Capital Management concluded a landmark year, delivering a 20.2% full-year economic return and an 8.6% return for Q4 2025, marking its ninth consecutive positive quarter. Performance was driven by a 5.0% sequential increase in book value per share to $20.21. Core profitability remained robust, with Earnings Available for Distribution (EAD) of $0.74 per share again covering the $0.70 dividend, which management reaffirmed is "safe" for 2026.
The results showcased the strength of the company's diversified model, particularly the record-setting performance of its Residential Credit platform. The Onslow Bay franchise set all-time highs for the quarter and drove full-year securitization issuance to a record $15.2 billion, a 38% increase year-over-year. The MSR portfolio also grew 15% in 2025, with Annaly ranking as the second-largest buyer of conventional MSR.
This operational success underpins management's reaffirmed strategic pivot. Citing Agency MBS valuations at the "very tight end of the range," the company detailed a long-term capital allocation target of 50% Agency, 30% Residential Credit, and 20% MSR. This signals a deliberate shift away from what are now perceived as fully-valued assets toward its proven, higher-return proprietary growth engines, establishing a clear but execution-dependent path for future returns.
1. Financial Performance Summary
A. Income Statement Metrics (Q4 & Full Year)
Annaly's Q4 and full-year 2025 performance was marked by a substantial increase in GAAP Net Income, driven by strong investment gains from spread tightening and lower volatility. Core profitability, measured by Earnings Available for Distribution (EAD), remained robust. EAD per share for the quarter was $0.74, which again exceeded the quarterly dividend of $0.70. For the full year, EAD per share was $2.92.
| Metric | Q4 2025 | Q4 2024 | FY 2025 | FY 2024 | Notes |
|---|---|---|---|---|---|
| Net Interest Income | $366.6M | $187.3M | $1,135.5M | $247.8M | Q4 ↑ 95.7%, FY ↑ 358.2%. The year-over-year growth reflects a more favorable interest rate and funding environment compared to the prior year. |
| Economic Net Interest Income (ex-PAA)¹ | $533.2M | $434.3M | $1,936.2M | $1,529.1M | Q4 ↑ 22.8%, FY ↑ 26.6%. Demonstrates strong growth in the core earnings power of the portfolio, excluding certain non-cash amortization adjustments. |
| Net Income (to common) | $971.1M | $443.3M | $1,869.3M | $847.4M | Q4 ↑ 119.0%, FY ↑ 120.6%. The increase was primarily driven by unrealized gains on the investment portfolio. |
| GAAP EPS (Diluted) | $1.40 | $0.78 | $2.92 | $1.62 | Q4 ↑ 79.5%, FY ↑ 80.2%. |
| EAD per Share¹ | $0.74 | $0.72 | $2.92 | $2.70 | Q4 ↑ 2.8%, FY ↑ 8.1%. Exceeded the $0.70 dividend. Management noted EAD rose marginally from the prior quarter. |
Footnotes
- Earnings Available for Distribution (EAD), EAD per Share, and Economic Net Interest Income (ex-PAA) are non-GAAP financial measures provided by the company to offer insight into its operating performance. EAD is a key metric used by management to assess dividend coverage.
B. Balance Sheet Highlights
Annaly's balance sheet expanded significantly in 2025, with the total investment portfolio growing 34.5% year-over-year to $132.1 billion. This growth was driven by the deployment of $2.9 billion in accretive capital raised during the year. The company's liquidity position remained robust, with $9.4 billion in total assets available for financing.
| Metric | Dec 31, 2025 | Dec 31, 2024 | Change | Notes |
|---|---|---|---|---|
| Cash and Cash Equivalents | $2.0B | $1.5B | ↑ 36.9% | — |
| Total Investment Portfolio | $132.1B | $98.2B | ↑ 34.5% | Management noted the portfolio grew accretively by approximately 30% during the year. |
| Assets transferred or pledged to securitization vehicles | $32.1B | $22.0B | ↑ 45.9% | This material asset represents residential mortgage loans transferred to securitization vehicles. |
| Total GAAP Debt | $116.2B | $89.6B | ↑ 29.7% | Growth in debt supported the expansion of the investment portfolio. |
| - Repurchase Agreements | $81.9B | $65.7B | ↑ 24.7% | The weighted average maturity decreased to 35 days from 49 days in the prior quarter. |
| - Debt Issued by Securitization Vehicles | $28.9B | $19.5B | ↑ 48.2% | Reflects a record year of securitization activity in the Residential Credit business. This debt is non-recourse. |
| Total Equity | $16.2B | $12.7B | ↑ 27.2% | Bolstered by $2.9B in capital raised during the year ($2.6B common equity, $275M preferred stock). |
| Assets Available for Financing¹ | $9.4B | $6.9B | ↑ 36.2% | A key liquidity metric, which includes $6.1B in cash and unencumbered Agency MBS, up $500M from the prior quarter. |
Footnotes
- Company-defined liquidity metric, comprised of unencumbered assets ($7.8B) and fair value of MSR pledged to committed warehouse facilities that can be converted to cash ($1.5B), as per management commentary.
C. Cash Flow Analysis
A formal cash flow statement was not provided in the earnings materials. The following table summarizes key capital flow activities based on management commentary and financial filings. The primary use of cash was for portfolio growth, while the primary source was from financing activities and capital raises.
| Metric | Q4 2025 | FY 2025 | Notes |
|---|---|---|---|
| Net Common Equity Issuances | $560M | $2.6B | Represents cash inflow from the company's at-the-market (ATM) program. |
| Preferred Stock Issuances | — | $275M | Represents gross proceeds from the Series J preferred stock issuance during the summer. |
| Net Debt Issuances¹ | $9.2B | $26.6B | Reflects net new financing, primarily through repurchase agreements and securitizations, to fund portfolio expansion. |
| Dividends Declared (Common & Preferred) | ($543.8M) | ($2.0B) | Represents a recurring use of cash for shareholder distributions. |
Footnotes
- Calculated as the period-over-period change in Total GAAP Debt from the Consolidated Statements of Financial Condition. Q4 2025: $116.2B - $107.0B = $9.2B. FY 2025: $116.2B - $89.6B = $26.6B.
D. Key Financial Ratios
Annaly delivered a strong 8.6% economic return for the quarter and 20.2% for the full year, driven by a 5.0% sequential increase in book value per share. The company maintained a conservative leverage profile, with the economic leverage ratio decreasing slightly to 5.6x. Key profitability metrics like Net Interest Margin and Spread remained stable and comparable to prior periods.
| Metric | Q4 2025 | Q3 2025 | Q4 2024 | Notes |
|---|---|---|---|---|
| Book Value per Share | $20.21 | $19.25 | $19.15 | ↑ 5.0% sequentially; ↑ 5.5% year-over-year. |
| Economic Return¹ | 8.6% | 8.1% | 1.3% | Marks the ninth consecutive quarter of positive economic returns. |
| Annualized EAD ROE² | 14.28% | 14.70% | 14.27% | Remained strong and consistent with prior periods. |
| Economic Leverage² | 5.6x | 5.7x | 5.5x | Decreased modestly quarter-over-quarter, remaining at historically low levels. |
| GAAP Leverage | 7.2x | 7.1x | 7.1x | — |
| Net Interest Margin (ex-PAA)² | 1.69% | 1.70% | 1.71% | Remained strong and comparable to prior periods. |
| Net Interest Spread (ex-PAA)² | 1.49% | 1.50% | 1.47% | Remained strong and comparable to prior periods. |
Footnotes
- Economic Return is calculated as the change in book value per common share plus dividends declared, divided by the beginning period's book value. Q4 2025 Calculation: ($20.21 - $19.25 + $0.70) / $19.25 = 8.6%.
- Annualized EAD Return on Average Equity, Economic Leverage, Net Interest Margin (ex-PAA), and Net Interest Spread (ex-PAA) are non-GAAP measures defined and reconciled in the company's financial supplement.
E. Industry-Specific Operational Metrics
Annaly's operational metrics highlighted significant growth and record-setting activity, particularly within its Residential Credit business. The MSR portfolio also expanded, maintaining its differentiated low-note-rate profile. The company's capital allocation remained anchored in the Agency strategy, which comprised 62% of dedicated capital.
Portfolio Composition & Capital Allocation
| Metric | Dec 31, 2025 | Sep 30, 2025 | Dec 31, 2024 | Notes |
|---|---|---|---|---|
| Total Portfolio (Economic Value)¹ | $104.7B | $97.7B | — | ↑ 7.2% sequentially. Prior year figure not available for direct comparison. |
| - Agency | $92.9B | $87.3B | $70.6B | Represents 62% of dedicated capital. |
| - Residential Credit | $8.0B | $6.9B | $4.6B | Represents 19% of dedicated capital. |
| - MSR | $3.8B | $3.5B | $3.3B | Represents 19% of dedicated capital. |
Financing & Hedging
| Metric | Q4 2025 | Q3 2025 | Q4 2024 | Notes |
|---|---|---|---|---|
| Wtd. Avg. Repo Days | 35 | 49 | 32 | The decrease from Q3 reflects management's financing strategy around market conditions. |
| Wtd. Avg. Repo Rate (Period-End) | 4.02% | 4.36% | 4.76% | ↓ 34 bps sequentially, reflecting lower borrowing costs. |
| Hedge Ratio | 90% | 92% | 100% | Maintained a conservative hedging posture. |
Residential Credit (Onslow Bay) Operational Highlights
| Metric | Q4 2025 | Q3 2025 | FY 2025 | FY 2024 | Notes |
|---|---|---|---|---|---|
| Lock Volume | $6.4B | $6.2B | $23.1B | — | Q4 set an all-time high. |
| Funding Volume | $5.0B | $4.0B | $16.5B | $11.7B | Q4 set an all-time high. FY 2025 volume increased 41% year-over-year. |
| Securitization Issuance | $4.6B | $3.9B | $15.2B | $11.0B | Q4 set an all-time high across 8 deals. FY 2025 issuance increased 38% year-over-year across 29 deals. |
| Credit Quality (Locked Pipeline) | 762 FICO / 68% LTV | 765 FICO / 68% LTV | — | 757 FICO / 68% LTV | Credit discipline remains a focus, with metrics stable and strong. |
Mortgage Servicing Rights (MSR) Operational Highlights
| Metric | Q4 2025 | Q3 2025 | Notes |
|---|---|---|---|
| Portfolio Wtd. Avg. Note Rate | 3.28% | 3.25% | The portfolio remains significantly out-of-the-money, supporting stable cash flows. |
| Portfolio CPR | 4.6% | 4.8% | Prepayment speeds were unchanged quarter-over-quarter. |
| Serious Delinquencies | 0.55% | 0.50% | Delinquencies remain muted. |
| UPB Onboarded (FY 2025) | — | — | Onboarded $59B in UPB throughout the year, making Annaly the second-largest buyer of conventional MSR. |
Footnotes
- Total Portfolio (Economic Value) represents Annaly’s on- and off-balance sheet investments where it has economic exposure, as defined in company filings. It includes TBA contracts and unsettled MSR commitments.
2. Forward-Looking Guidance
A. Guidance Summary
Management did not provide specific numerical guidance for revenue or GAAP EPS. The forward-looking commentary centered on the stability of core earnings (EAD), dividend coverage, and a continued strategic shift in capital allocation priorities toward non-Agency assets.
| Metric | Period | Current Guidance | Prior Guidance | Change | Management Commentary |
|---|---|---|---|---|---|
| EAD per Share | Q1 2026 | Expect to out-earn the dividend | N/A | Introduced | Management expressed confidence in near-term earnings power, stating, "We expect [to] outearned certainly in Q1." |
| Dividend Coverage | 2026 | Dividend is considered "safe" | Dividend was considered "safe" and well-covered for Q4 2025 | Reaffirmed | Management expressed confidence, stating, "we feel like the dividend is safe here." |
| Capital Allocation Priorities | 2026 / Long-Term | Increase allocation to non-Agency strategies (Resi & MSR) with a long-term target of 50% Agency / 30% Resi / 20% MSR | Increase allocation to Residential Credit and MSR to a combined 40% | Reaffirmed & Refined | "Our non-Agency strategies will likely see additional capital allocation, all else equal." Management provided a more specific long-term target, refining the strategic pivot announced in the prior quarter. |
B. Additional Notes & Commentary
- Intra-Quarter Book Value Update: Management provided an update on book value performance quarter-to-date as of the close on Tuesday, January 27, 2026.
- Book value per share was reported to be up approximately 3%, net of the dividend accrual. Inclusive of the dividend, the book value was up 4%.
3. Operational & Strategic Developments
A. Business Performance & Operations
Annaly's diversified model delivered strong results, with each of its three investment strategies demonstrating double-digit growth for the year. This performance was underpinned by record-setting activity in the credit businesses and strategic growth in the core Agency portfolio.
-
Agency Portfolio: The portfolio continued its expansion, with management deploying capital into current coupon assets and Agency CMBS to optimize returns in a steeper curve environment. The portfolio's construction, with a high concentration of specified pools, provided significant call protection that successfully mitigated the impact of faster prepayments in the broader market as rates declined.
-
Residential Credit (Onslow Bay): The platform achieved a milestone quarter, setting all-time highs across all key operational metrics. This record-breaking performance in locks, fundings, and securitization issuance demonstrated significant market share gains and operational scale. Throughout this rapid growth, the company maintained its disciplined approach to credit quality, a key focus for the business.
-
Mortgage Servicing Rights (MSR): The MSR portfolio continued to expand, solidifying Annaly's position as a top buyer in the market. The portfolio maintained its highly differentiated characteristics, including a low note rate and high credit quality, which supported stable cash flows and muted delinquencies.
B. Strategic Initiatives
-
Capital Allocation Pivot: Management reaffirmed and provided more specific long-term targets for the strategic pivot first announced in the prior quarter. While Agency will remain the portfolio's anchor, the company plans to increase capital allocation to its non-Agency strategies.
- The stated long-term objective is a portfolio composition of approximately 50% Agency, 30% Residential Credit, and 20% MSR.
- This shift is driven by a change in relative valuations, as spreads across asset classes have tightened unevenly, making the optionality to invest in the most accretive assets a key advantage over monoline peers.
-
Capital & Liquidity Management:
- Accretive Capital Raising: The company raised $560 million of common equity through its at-the-market (ATM) program in Q4, bringing the full-year total capital raised to $2.9 billion (including a Series J preferred stock issuance).
- Enhanced Liquidity: The liquidity position strengthened further, with total assets available for financing increasing by $500 million sequentially to $9.4 billion. This represents 58% of the total capital base.
- Warehouse Capacity: Total warehouse capacity for the Residential Credit and MSR businesses reached $6.9 billion, with utilization rates of 47% and 50%, respectively, providing ample capacity for future growth.
-
MSR Flow Business Expansion: The company is actively expanding its MSR flow business to access current coupon MSR. It is now active across all GSE platforms and has established relationships with nearly 100 counterparties. While management currently sees better relative value in lower note rate MSR, this infrastructure provides the optionality to purchase new production MSR opportunistically.
C. Risk Factors & Headwinds
-
Financial Health Indicators: The balance sheet remains strong, characterized by what management describes as a "conservative leverage profile," with economic leverage decreasing modestly and a robust liquidity position being maintained.
-
Operational Challenges & External Headwinds: Management highlighted several new and persistent risks they are monitoring, reflecting a cautious outlook despite the strong performance.
- New/Elevated Risk - Agency MBS Valuations: A key risk highlighted by management is that Agency MBS valuations are at the very tight end of their historical range, near levels seen during quantitative easing. While justified by strong technicals and lower volatility, this leaves the assets vulnerable to spread widening.
- New/Elevated Risk - Broad Market Euphoria: Management expressed concern about potential "euphoria in asset markets," noting that the price of gold has doubled since the beginning of 2024. This suggests a broader macro risk of a potential correction across asset classes.
- Persistent Risk - Housing Policy Uncertainty: This risk, discussed in prior quarters, remains a key focus. The potential for a guarantee-fee (G-fee) cut by the administration could impact the prepayment environment and MBS spreads. Management's view is that any cut should be confined to new purchase loans to avoid disrupting the existing MBS market.
- Persistent Risk - Global Fiscal Picture: Management cited the significant amount of global debt, including in the U.S., as a major macro risk that could lead to a higher volatility environment. This is a continuation of a theme of monitoring broad macro uncertainty.
- Improved Condition - MBS Technicals & Funding Environment: A significant tailwind has been the improvement in the technical backdrop for MBS and the broader funding markets.
- Management noted that market technicals for MBS are "vastly better than at any time since the Fed was actively buying MBS," driven by strong bond fund inflows, REIT equity raises, and GSE portfolio growth.
- The Fed's shift from quantitative tightening to balance sheet expansion through bill purchases was highlighted as an "underappreciated" positive for financing markets, increasing stability for balance-sheet-intensive products like Agency MBS.
4. Q&A Session Key Themes
The Q&A session centered on the sustainability of returns in a tight-spread environment, the execution of the company's strategic pivot toward non-Agency assets, and emerging risks from housing policy uncertainty. Analysts sought to understand how Annaly could maintain its performance after the significant tightening in Agency MBS spreads, prompting detailed discussions on relative value, hedging strategy, and the growth trajectory of the Residential Credit and MSR businesses.
A. Analyst Focus Areas
-
Capital Allocation & Dividend Sustainability: A primary focus was on the firm's forward-looking strategy now that Agency spreads have tightened.
- Reaffirmation of Strategic Pivot: Multiple analysts probed the relative attractiveness of the three business segments. Management explicitly reaffirmed the strategic pivot signaled last quarter, stating that "non-Agency strategies will likely see additional capital allocation." They provided a more concrete long-term target of 50% Agency, 30% Residential Credit, and 20% MSR, a refinement of the prior quarter's goal to simply increase the non-Agency weighting.
- Dividend Confidence: In response to direct questions about dividend safety in 2026, management expressed strong confidence. They noted that the company out-earned its dividend in Q4, expects to do so again in Q1, and that the overall earnings power of the balance sheet supports the current payout, stating, "we feel like the dividend is safe here." This is a consistent message from the prior quarter.
-
GSE Role & Housing Policy Risk: A significant new theme, not prominent in prior calls, was the potential impact of government actions on the mortgage market.
- Analysts questioned management on the GSEs' recently announced MBS purchase program and the possibility of a guarantee-fee (G-fee) cut.
- Management believes a G-fee cut on new purchase loans would be appropriate but warned that a broad cut impacting existing loans would damage the MBS market, a view they have communicated to policymakers. They are hopeful the GSEs will evolve into a "spread stabilizing force" for the market.
-
MSR Strategy Nuances: Analyst questions on MSR evolved from high-level supply dynamics to more granular strategic trade-offs.
- Discussions focused on the relative value of purchasing current coupon MSR versus the company's existing portfolio of low note rate MSR.
- Management explained that while they have built the infrastructure to acquire current coupon MSR, the most compelling opportunities remain in low note rate assets, as originators are forced to sell these to maintain liquidity.
-
Sustainability of Returns: Analysts implicitly questioned how Annaly can continue to generate mid-teens returns with Agency MBS spreads near "QE type levels."
- Management defended the return profile, arguing that lower hedging costs (due to low volatility) and stable funding markets (supported by the Fed's shift away from QT) still make Agency returns achievable versus swaps.
- They also emphasized that the residential whole-loan-to-securitization channel continues to generate mid-teens ROEs, providing a durable source of high returns to complement the Agency portfolio.
B. Key Challenges & Concerns
While the tone of the Q&A was analytical rather than confrontational, analysts' questions highlighted two primary underlying concerns.
-
Valuation Risk: The most significant implicit concern was the risk posed by tight valuations.
- Analysts probed the durability of returns in an environment where, as management acknowledged, Agency MBS spreads are at the "very tight end of the range."
- Management themselves flagged this as a key risk, along with broader "euphoria in asset markets," suggesting a cautious posture despite strong recent performance.
-
External & Policy Risks: Analysts showed a clear focus on external factors that could disrupt the current "low-risk environment."
- Questions about potential G-fee cuts and the factors that could cause a spike in volatility indicate a focus on tail risks.
- Management acknowledged these concerns, identifying "housing policy uncertainty" and the "global fiscal picture" as the primary risks they are monitoring closely.
5. Strategic Themes & Inflection Points
Annaly's Q4 and full-year 2025 results marked a transition from navigating market volatility to confidently executing on its diversified strategy in a more constructive environment. The commentary reinforced the strategic pivot announced in the prior quarter, providing a clearer long-term roadmap while also introducing a new layer of caution around valuations and external policy risks.
A. Current Period Themes
- Validation of the Diversified Model: The dominant narrative was the success and resilience of the diversified housing finance model, which delivered a 20.2% economic return for the full year. Management emphasized that strong, double-digit growth across all three business segments—Agency, Residential Credit, and MSR—validated the company's strategic evolution beyond a monoline Agency mREIT.
- Capitalizing on a Constructive Environment: The company's focus has shifted from navigating the volatility of prior periods to capitalizing on what management described as a highly favorable market. Key tailwinds included declining interest rate volatility, a steepening yield curve, and significantly improved technicals for MBS, which were characterized as the best since the Fed was actively buying.
- From Pivot Announcement to Strategic Reaffirmation: While Q3 marked the announcement of a strategic pivot toward non-Agency assets, Q4 served as a confident reaffirmation of this strategy. The message has evolved from a near-term goal to a more clearly defined long-term vision, with management now providing specific capital allocation targets.
B. Future Considerations
- Executing the Long-Term Portfolio Rebalance: The most significant forward-looking initiative is the execution of the portfolio rebalancing toward a stated long-term target of 50% Agency, 30% Residential Credit, and 20% MSR. Monitoring the pace of this capital reallocation will be critical to understanding the company's future risk and return profile. This is a more concrete articulation of the pivot announced in the prior quarter.
- Navigating Policy and Valuation Risks: A new theme of caution has emerged. Management explicitly flagged the risk of tight Agency MBS valuations, which are near "QE type levels," and broader market "euphoria." Additionally, housing policy uncertainty, including potential G-fee cuts and the role of the GSEs, was a prominent topic and represents a key external variable for 2026.
- Growth Through Operational Scale: Future growth is expected to be driven by the continued scaling of the non-Agency platforms. Management highlighted the expectation for the highest non-Agency securitization issuance since 2007, positioning the market-leading Onslow Bay platform as a primary growth engine. Similarly, the build-out of the MSR flow business provides a new avenue for opportunistic growth in addition to the bulk channel.
6. Key Items to Monitor Next Quarter
A. Prior Quarter Monitoring Review
The following table reviews the status of key items identified in the prior quarter's analysis, based on developments and commentary from the Q4 2025 earnings call.
| Prior Item | Current Status | Management Commentary |
|---|---|---|
| Execution of Capital Reallocation to Credit & MSR | On Track | Management reaffirmed the strategic pivot, providing a more specific long-term target of 50% Agency, 30% Resi Credit, and 20% MSR. Capital allocation to Agency decreased slightly from 64% to 62% in Q4, with management stating "non-Agency strategies will likely see additional capital allocation." |
| Integration and Performance of PennyMac MSR Partnership | No Update | The specific partnership with PennyMac, announced subsequent to Q3, was not discussed in the Q4 call. Management's commentary focused on overall MSR portfolio growth and market-wide acquisition activity. |
| Unlocking Embedded Value via Securitization Calls | No Update | Management did not provide an update on calling additional legacy securitizations during the Q4 call. The discussion on the Residential Credit platform centered on record-breaking new origination and issuance volumes. |
| Sustainability of Record Residential Credit Volumes | Achieved | The company surpassed its prior-quarter record, setting new all-time highs in Q4 for lock volume ($6.4B vs. $6.2B in Q3) and funding volume ($5.0B vs. $4.0B in Q3), demonstrating continued momentum despite typical winter seasonality. |
| Impact of Weakening Labor Market on Credit Performance | On Track | While acknowledging a "soft" labor market, management reported that credit performance remains strong. MSR serious delinquencies increased slightly to a still-muted 55 basis points (from 50 bps in Q3), and the credit quality of the new residential loan pipeline remains high (762 FICO). |
B. Current Quarter Focus Items
The following table outlines the most critical non-guidance metrics and developments to monitor for assessing the company's trajectory and strategic execution in the upcoming quarters.
| Category | Item | Timeline | What to Monitor | Why It Matters |
|---|---|---|---|---|
| Strategic | Execution of Portfolio Rebalancing Towards Non-Agency Assets | Ongoing | Quarterly change in capital allocation percentages, specifically the reduction in Agency (currently 62%) and increases in Residential Credit and MSR (both 19%), moving toward the long-term target of 50% Agency. | This is the firm's primary strategic pivot. Successful execution is crucial to drive returns in an environment where Agency MBS is perceived as fully valued and to validate the earnings power of the diversified model. |
| Risk | Agency MBS Spread Performance Amid Tight Valuations | Next 1-2 Quarters | Any widening of Agency MBS spreads from their current levels, which management described as at the "very tight end of the range" and "close to QE type levels." | Given the tight starting valuations, the portfolio is vulnerable to spread widening, which would negatively impact book value and economic returns. The stability of these spreads is key to the "safety of those returns." |
| Risk | Impact of U.S. Housing Policy Changes | Ongoing | Any policy announcements from the administration or FHFA regarding housing affordability, particularly a potential guarantee-fee (G-fee) cut or changes to the GSEs' role in the market. | Management explicitly flagged "housing policy uncertainty" as a key risk. A broad G-fee cut could increase prepayment speeds and negatively impact the convexity profile of the entire MBS market, potentially widening spreads and hurting valuations. |
| Operational | Sustainability of Record Residential Credit Origination Momentum | Next Quarter | Q1 2026 lock and funding volumes for the Onslow Bay correspondent channel to assess if momentum can be sustained after consecutive all-time record quarters. | The Residential Credit business is the primary engine for deploying capital into higher-yielding, proprietary assets. Sustaining strong origination volumes is essential for achieving the strategic reallocation away from Agency MBS and growing core earnings. |
| Operational | Prepayment Speeds on Higher Coupon Specified Pools | Next Quarter | The CPR performance of Annaly's higher coupon (e.g., 6.0% and 6.5%) specified pools relative to generic "cheapest to deliver" collateral, especially if mortgage rates remain near 6%. | Management claims their portfolio has "enough call protection to withstand a lower rate environment." This is a direct test of their asset selection strategy and its ability to provide "durable carry" and protect income from prepayment risk. |
Appendix: Quotes by Theme
1. Strategic Pivot: Reaffirming the Shift to Non-Agency with a Clearer Long-Term Vision
Management reinforced the strategic pivot announced in the prior quarter, providing a more specific long-term target for capital allocation and emphasizing the advantages of their diversified model as Agency MBS spreads have tightened.
"While Agency will certainly continue to remain the anchor of our portfolio, our non-Agency strategies will likely see additional capital allocation, all else equal... We have to be very considerate with respect to the credit environment. But nonetheless, when you look at the health of the loans we're acquiring, and our portfolio, we're very comfortable with the credit we're doing. And so we're hopeful we can grow it." — David Finkelstein, CEO
"We've said in the past that the longer term weighting we would like to achieve is 50% Agency, not below that and 30% resi, 20% MSR. We don't have to get there right away, but that is an objective." — David Finkelstein, CEO
- vs Q3-FY25 (when the pivot was first signaled as a near-term goal):
"We'd like to get our Resi and MSR weightings back up to a combined 40%. We're patient to do so. And we feel good about how the portfolio is positioned. But nonetheless, we would like to increase those 2 sectors from a near-term capital allocation perspective." — David Finkelstein, CEO
2. Dividend Confidence: Reaffirming Safety Despite Tighter Spreads
Despite the tightening of Agency MBS spreads, management expressed strong and consistent confidence in the sustainability of the dividend, citing the portfolio's overall earnings power and the performance of the non-Agency businesses.
"When you look at our overall balance sheet, where we own assets is very supportive of the dividend yield. So we feel good about it. We outearned in Q4. We expect [to] outearned certainly in Q1, and we feel like the dividend is safe here." — David Finkelstein, CEO
- vs Q3-FY25 (when confidence was also high):
"We feel very good about the dividend... and we also feel like when we look at the forwards and also the Fed doesn't cut as much as the market, we still feel like the dividend is safe. Our hedge ratio is 92%. So there's a lot of protection around the income stream..." — David Finkelstein, CEO
3. Risk Acknowledgment: Highlighting Tight Agency Valuations
A new and prominent theme was management's explicit acknowledgment that Agency MBS valuations are a key risk, a notable shift from the prior quarter's focus on their attractiveness. This provides the core rationale for the strategic pivot to non-Agency assets.
"As it relates to the Agency market, specifically in our markets, valuation as well is a risk. We are at the very tight end of the range on Agency MBS. It's justified given the facts I mentioned earlier, but nonetheless, they're relatively tight... It's just that spreads are obviously at the tight end of the range. They're close to QE type levels." — David Finkelstein, CEO
- vs Q3-FY25 (when Agency MBS was described as compelling):
"While Agency spreads are tighter, the sector remains compelling as spread compression has been achieved through lower volatility and a steeper yield curve, thus improving the fundamentals of the asset class." — David Finkelstein, CEO
4. Housing Policy Uncertainty: A More Pronounced and Specific Risk
The risk of government intervention in the housing market, a minor topic in prior quarters, became a central point of discussion, with analysts probing the potential impact of guarantee-fee (G-fee) cuts.
"Our view -- and we've been communicated about this to policymakers is that a G-fee cut on purchased loans is perfectly appropriate. We're concerned that if you do broad G-fee cut and impact existing loans, you're going to damage the MBS market and widen spreads. And I think that there's been an awareness of that." — David Finkelstein, CEO
5. Rationale for Sustaining Returns in a Tight-Spread Environment
In response to analyst questions on how to achieve target returns with tight Agency spreads, management pointed to lower hedging costs and the continued strong performance of the residential credit securitization channel.
"When we look at the Agency market, obviously, we've gotten a considerable amount of tightening. But versus swaps, you still get there... MBS hedging costs should be meaningfully lower given the decline in volatility supporting low to mid-teen prospective returns." — David Finkelstein, CEO
"In the resi market, the whole loan channel to securitization is still giving us those returns [mid-teens ROEs]. MSR is a little bit lighter. But when you consider the hedging benefits and diversification benefits will take that." — David Finkelstein, CEO
6. MSR Strategy: Emphasis on Flow Business Expansion and Relative Value
Management provided more detail on the expansion of its MSR flow business, while explaining that the most attractive opportunities currently remain in lower note rate assets due to market dynamics.
"We're focused on expanding our footprint and are now active across all GSE platforms, providing access to current coupon MSR, which we plan to purchase opportunistically... we don't see it as valuable to us at this time based on where we can buy the lower note rate stuff. So to the extent relative value changes and that becomes more attractive, you will see us more active in that area." — Ken Adler, Head of Mortgage Servicing Rights
- vs Q3-FY25 (when the focus was on building partnerships):
"Also to note, we announced a new partnership with PennyMac Financial Services subsequent to quarter end, adding another industry-leading mortgage originator and servicer to our existing set of best-in-class subservicing and recapture partners." — David Finkelstein, CEO
7. Macro Outlook: Acknowledging a "Low-Risk Environment" but Flagging Tail Risks
Management characterized the current environment as low-risk but highlighted several significant macro risks on the horizon, including the global fiscal picture and potential "euphoria in asset markets."
"The 2 biggest risks that we see are the global fiscal picture and the amount of debt out there, including that in the United States and a little bit of complacency around it... And another macro risk is just the euphoria in asset markets and asset pricing. It's been a pretty remarkable run across markets, and there's real signs out there that people should be -- investors should be a little bit concerned." — David Finkelstein, CEO
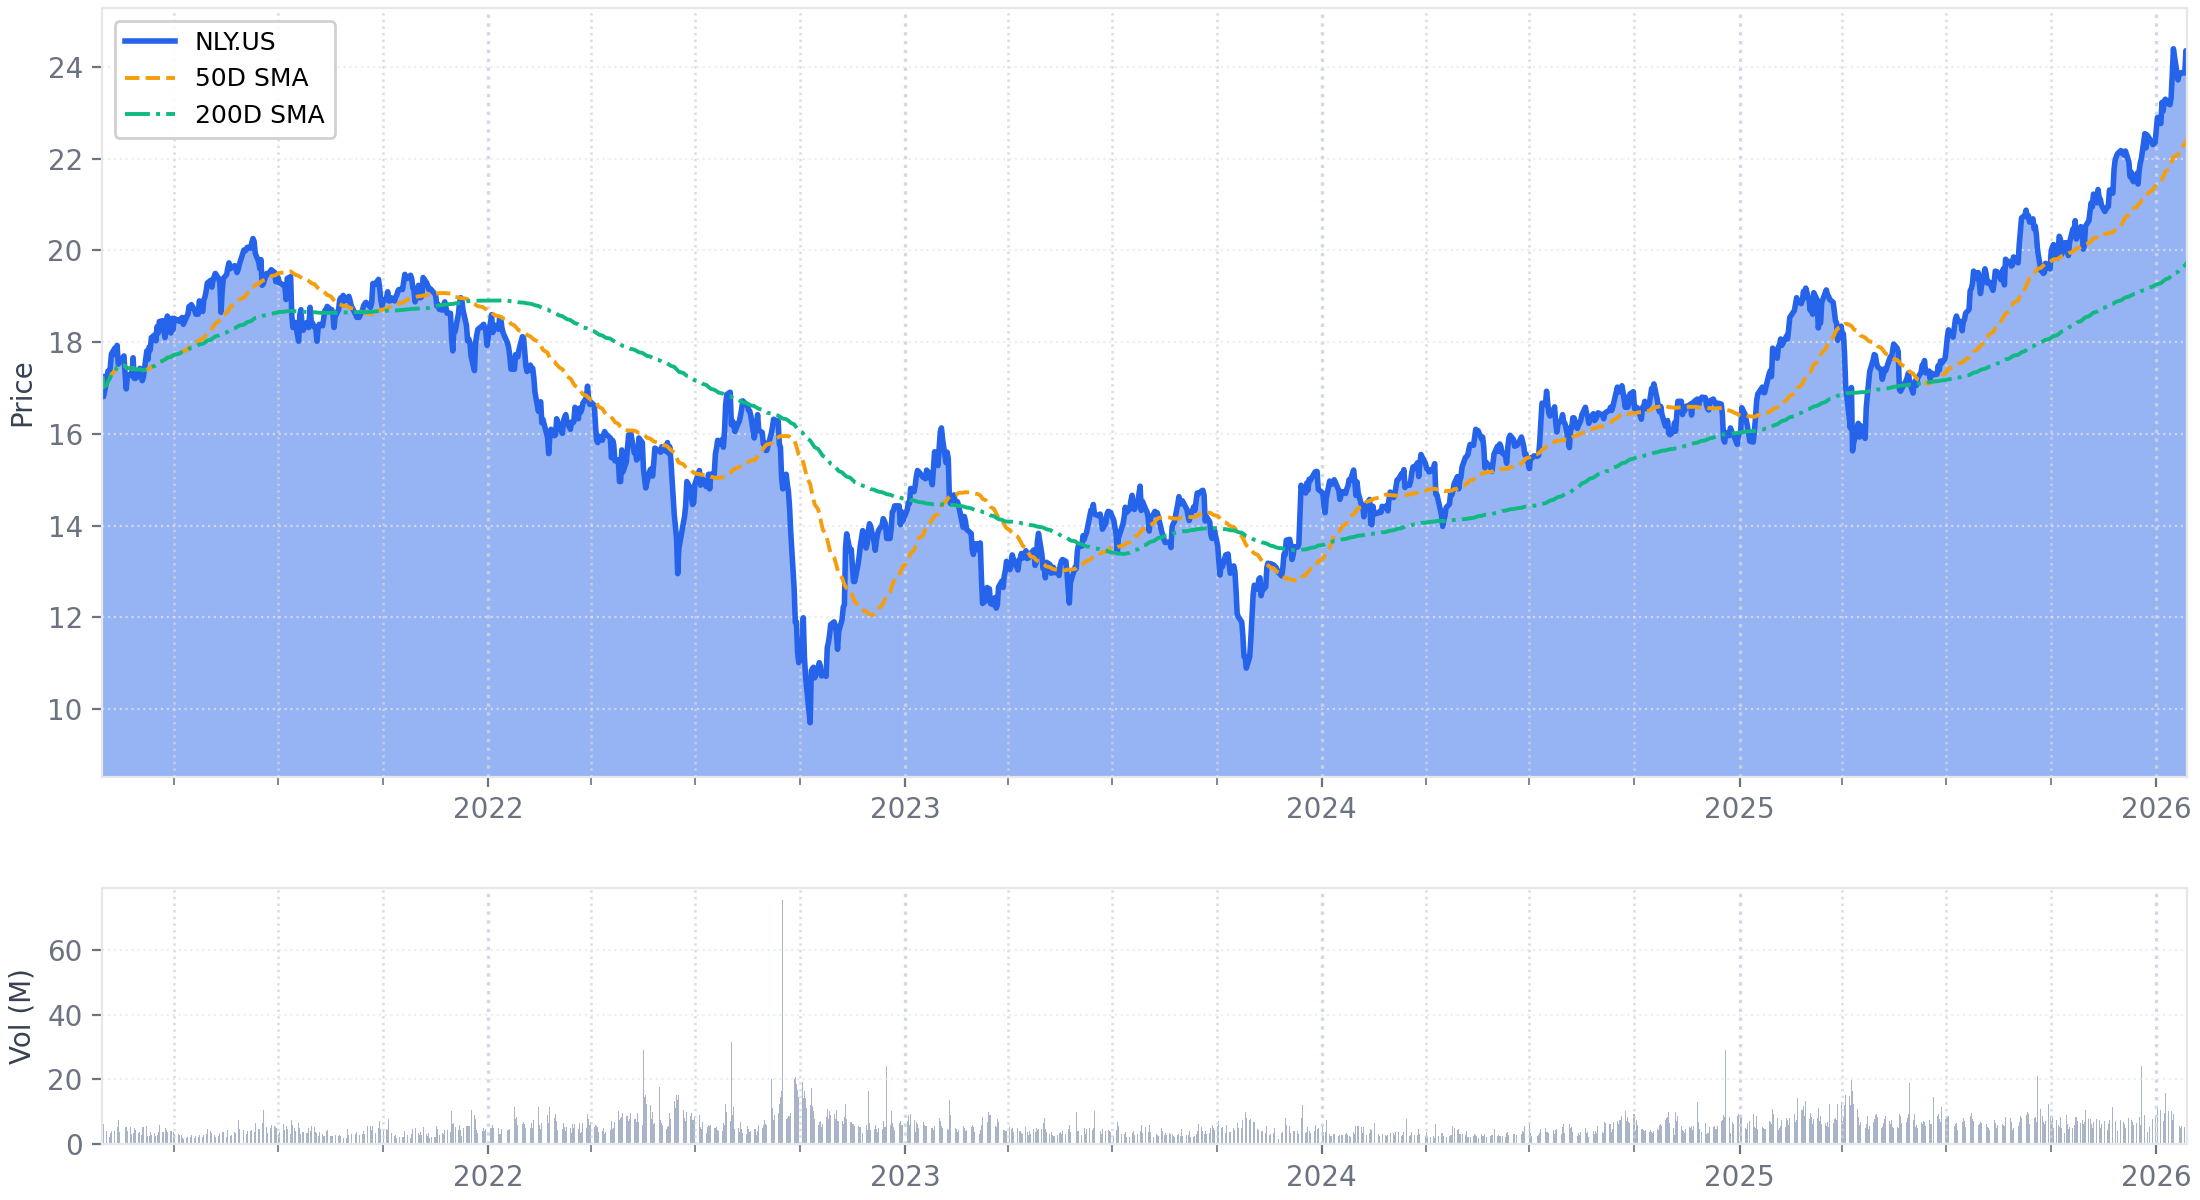
Historical Performance