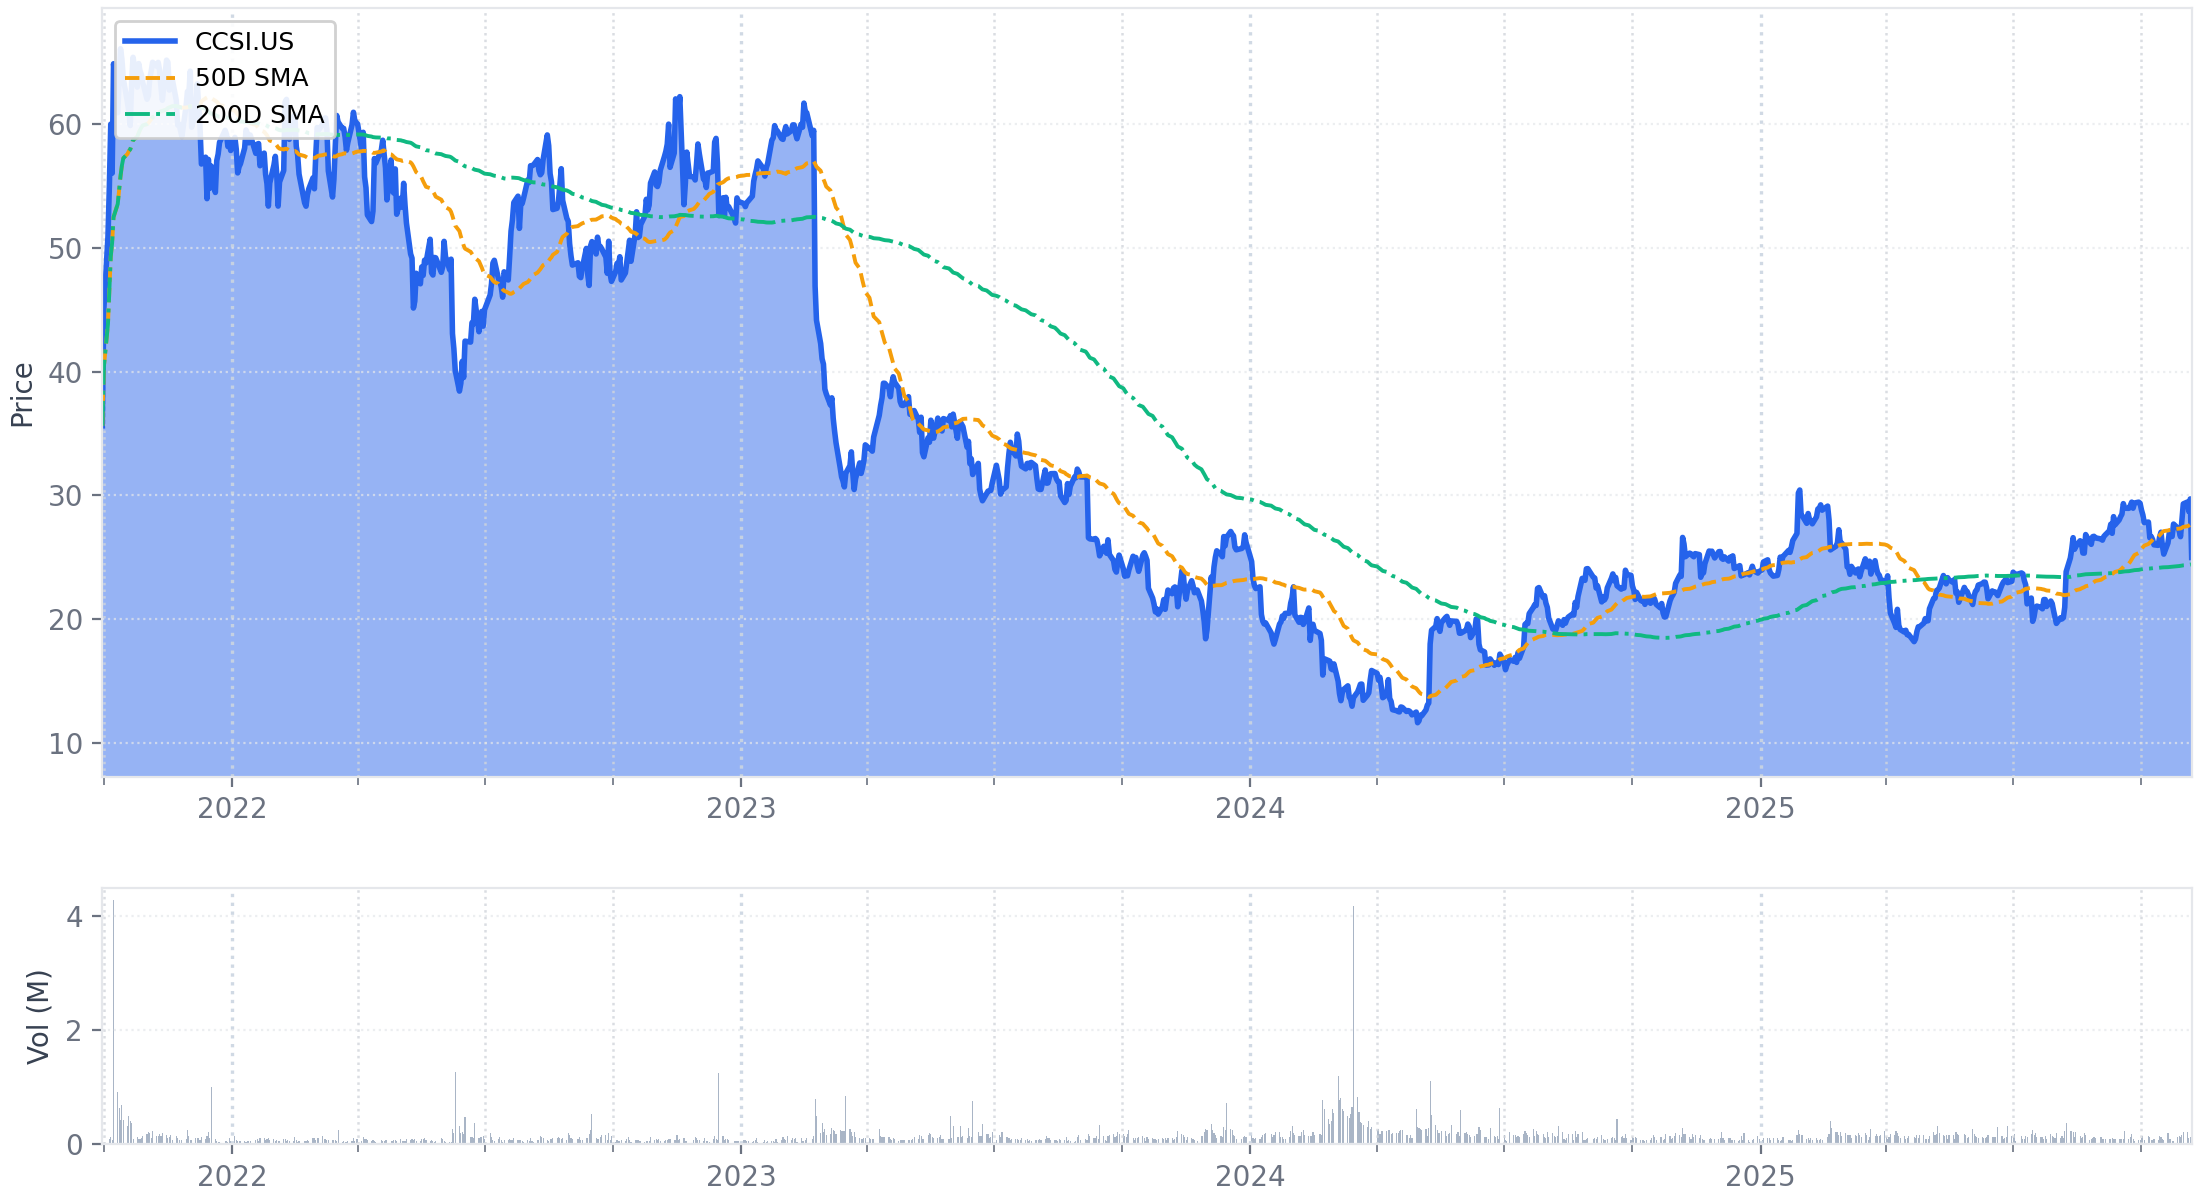
Executive Summary
Consensus Cloud Solutions reported a solid Q3, characterized by sustained execution in its Corporate segment and the near-completion of its balance sheet de-risking strategy. Corporate revenue grew 6.1% YoY to a record $56.3 million, offsetting the planned decline in the SoHo segment and keeping total revenue flat YoY at $87.8 million, in line with guidance. Profitability was healthy, with Adjusted EPS of $1.38 meeting guidance and an Adjusted EBITDA margin of 52.8%.
A key milestone was achieved post-quarter with the retirement of the company's 6% notes, which will reduce total debt to $569 million and bring the company's gross leverage near its 3x target. Operationally, the Corporate business was supported by a stable 101.9% TTM revenue retention rate and record customer additions. Looking forward, management provided a more tangible long-term outlook for its VA contract, expressing high confidence in reaching $10 million in annual revenue over the next few years. However, they also flagged a new near-term headwind in the SoHo segment from changes in the online search environment.
The quarter confirms the company has successfully executed its balance sheet transformation, positioning it to sustain its growth trajectory in the corporate channel while opportunistically allocating capital. The narrative now pivots to realizing the multi-year public sector opportunity against manageable near-term challenges.
1. Financial Performance Summary
Consensus reported Q3 2025 results that were in line with revenue expectations, driven by continued strength in the Corporate segment which offset the planned decline in the SoHo business. Corporate revenue grew 6.1% YoY, supported by record usage and customer additions. Profitability was slightly ahead of management's expectations, with an Adjusted EBITDA of $46.4 million, beating the guidance midpoint. Adjusted EPS of $1.38 met the midpoint of the company's guidance range.
A. Income Statement Metrics
The company's total revenue remained flat year-over-year at $87.8 million. The Corporate segment's 6.1% growth was offset by a 9.2% strategic decline in the SoHo segment. The Adjusted EBITDA margin was a healthy 52.8%, slightly ahead of expectations but down from the prior year due to planned headcount additions.
| Metric | Q3 2025 | Q3 2024 | Change (%) | Notes |
|---|---|---|---|---|
| Total Revenue | $87.8M | $87.8M | — | Met guidance of $85.9M–$89.9M. |
| - Corporate Revenue | $56.3M | $53.1M | ↑ 6.1% | — |
| - SoHo Revenue | $31.5M | $34.7M | ↓ 9.2% | The rate of decline improved from 9.4% in Q2 2025, in line with the company's strategy. |
| Income from Operations | $37.9M | $38.4M | ↓ 1.3% | — |
| GAAP Net Income | $22.1M | $21.1M | ↑ 4.6% | — |
| Adjusted Net Income | $26.6M | $26.8M | ↓ 0.8% | — |
| GAAP EPS (Diluted) | $1.15 | $1.09 | ↑ 5.5% | — |
| Adjusted EPS (Diluted) | $1.38 | $1.38 | — | Met guidance of $1.33–$1.42. |
| Adjusted EBITDA | $46.4M | $46.9M | ↓ 1.2% | Beat guidance of $44.4M–$47.4M. Management noted results were slightly ahead of expectations. |
| - Adjusted EBITDA Margin | 52.8% | 53.5% | ↓ 0.7 pts | Decrease was primarily driven by planned headcount additions. |
B. Balance Sheet Highlights
The company ended the quarter with a strong cash position of $97.6 million. Subsequent to the quarter's close, Consensus utilized its new credit facility and cash on hand to retire its 6% notes, reducing total indebtedness to $569 million.
| Metric | Sep 30, 2025 | Dec 31, 2024 | Change (%) | Notes |
|---|---|---|---|---|
| Cash and Cash Equivalents | $97.6M | $33.5M | ↑ 191.3% | Bolstered by strong free cash flow generation. |
| Total Debt¹ | $578.6M | $593.0M | ↓ 2.4% | Post-quarter, total debt was reduced to $569M. |
| Net Debt² | $481.0M | $559.5M | ↓ 14.0% | — |
| DSOs | 25 days | — | — | Management noted DSOs were driven down to 25 days due to outstanding collections in the corporate channel. |
Footnotes
- Total Debt represents the sum of the current and long-term portions of long-term debt from the consolidated balance sheet. For Sep 30, 2025: $0 + $578.6M = $578.6M. For Dec 31, 2024: $18.9M + $574.1M = $593.0M.
- Net Debt is a calculated metric: Total Debt - Cash and Cash Equivalents. For Sep 30, 2025: $578.6M - $97.6M = $481.0M. For Dec 31, 2024: $593.0M - $33.5M = $559.5M.
C. Cash Flow Analysis
Year-to-date free cash flow increased 15.7% to $98.5 million. Management raised its full-year free cash flow expectation to be in excess of $95 million, ahead of prior expectations.
| Metric | Nine Months Ended Sep 30, 2025 | Nine Months Ended Sep 30, 2024 | Change (%) | Notes |
|---|---|---|---|---|
| Net Cash from Operating Activities | $120.9M | $110.6M | ↑ 9.3% | — |
| Purchases of Property and Equipment | ($22.3M) | ($25.5M) | ↓ 12.3% | — |
| Free Cash Flow¹ | $98.5M | $85.2M | ↑ 15.7% | Management noted Q4 FCF will be minimal due to semi-annual bond interest payments. |
| Common Stock Repurchases (Cash) | ($15.0M) | ($0.7M) | ↑ 2,042.9% | — |
| Debt Repurchases (Cash) | ($15.8M) | ($116.2M) | ↓ 86.4% | — |
Footnotes
- Free Cash Flow is defined by the company as Net Cash Provided by Operating Activities less Purchases of Property and Equipment. For YTD 2025: $120.9M - $22.3M = $98.5M. For YTD 2024: $110.6M - $25.5M = $85.2M. Note: Totals may not sum due to rounding.
D. Key Financial Ratios
| Metric | Q3 2025 | Notes |
|---|---|---|
| Gross Debt / LTM Adj. EBITDA¹ | ~3.0x | Based on post-quarter debt of $569M, management stated they are "very close to our target of 3x". |
| Net Debt / LTM Adj. EBITDA² | ~2.6x | Calculated using post-quarter debt of $569M, quarter-end cash of $97.6M, and LTM Adjusted EBITDA of $184.0M. |
Footnotes
- Leverage ratio is an estimate based on management commentary.
- Net leverage is a calculated estimate. LTM Adjusted EBITDA of $184.0M is calculated as the sum of reported/guided figures (Q3'25: $46.4M, Q2'25: $48.1M, Q4'24: $43.5M, and an implied Q1'25 of ~$46.0M).
E. Operational Metrics
The Corporate segment's key performance indicators remained healthy, with a trailing 12-month revenue retention rate of 101.9%, stable sequentially. Customer account growth continued, though ARPA was impacted by the mix-shift toward the smaller eFax Protect cohort. The SoHo cancellation rate decreased sequentially from 3.84% in Q2 2025, but was up year-over-year.
| Metric | Q3 2025 | Q3 2024 | Change | Notes |
|---|---|---|---|---|
| Corporate Business | ||||
| Customer Accounts (thousands) | 65 | 58 | ↑ 7k (12.1%) | Reached a new record, driven by 6,700 net adds from eFax Protect. |
| ARPA (monthly) | $293.12 | $310.13 | ↓ 5.5% | Sequentially down from $301 in Q2 2025. The decline reflects the mix shift to smaller SMBs with an ARPA of ~$50. |
| TTM Revenue Retention | 101.9% | 99.8% | ↑ 2.1 pts | Stable sequentially from 102.0% in Q2 2025 and remains above the 100% target. |
| Monthly Account Churn | 3.47% | 2.61% | ↑ 0.86 pts | — |
| SoHo Business | ||||
| Customer Accounts (thousands) | 661 | 741 | ↓ 10.8% | Sequentially down from 682k in Q2 2025, as planned. |
| ARPA (monthly) | $15.56 | $15.38 | ↑ 1.2% | In line sequentially with $15.62 in Q2 2025. |
| Monthly Account Churn | 3.71% | 3.53%¹ | ↑ 0.18 pts | Improved sequentially from 3.84% in Q2 2025. |
Footnotes
- Per the Q2 2025 filing, the company eliminated dormant accounts not contributing to revenue from the number of SoHo customer accounts. Prior year periods were revised for consistency. As a result of this change, the Q3 2024 SoHo customer accounts decreased by 26,000.
2. Forward-Looking Guidance
Management introduced guidance for Q4 2025 and updated its full-year 2025 free cash flow outlook. While the press release noted that the full-year 2025 guidance ranges for Revenue, Adjusted EBITDA, and Adjusted EPS were narrowed, specific new ranges were not provided.
A. Guidance Summary
| Metric | Period | Current Guidance | Prior Guidance | Change | Management Commentary |
|---|---|---|---|---|---|
| Revenue | Q4 2025 | $84.9M – $88.9M | N/A | Introduced | Midpoint of $86.9M. |
| Adjusted EBITDA | Q4 2025 | $43.1M – $46.0M | N/A | Introduced | Midpoint of $44.5M. Margin expected to be lower than Q3 due to new hires and seasonal costs. |
| Adjusted EPS | Q4 2025 | $1.27 – $1.37 | N/A | Introduced | Midpoint of $1.32. Assumes ~19.4M shares and a tax rate of 20.5%–22.5%. |
| Revenue | FY 2025 | Narrowed within prior range¹ | $343M – $357M | Narrowed | — |
| Adjusted EBITDA | FY 2025 | Narrowed within prior range¹ | $179M – $190M | Narrowed | — |
| Adjusted EPS | FY 2025 | Narrowed within prior range¹ | $5.25 – $5.65 | Narrowed | — |
Footnotes
- Per the Q3 2025 press release, full-year guidance was "narrowed within the previously provided guidance," but new specific ranges were not disclosed. Prior guidance is from the Q2 2025 earnings call.
B. Additional Notes & Commentary
- Free Cash Flow Outlook: Management has upgraded its full-year 2025 outlook and now expects free cash flow to be in excess of $95 million. This is an increase from the prior quarter's guidance of exceeding the $85 million generated in 2024.
- Management cautioned that Q4 is not expected to generate significant free cash flow due to the semi-annual interest payment on its bonds.
- FY 2026 Guidance: Management stated that full-year 2026 guidance for revenue, adjusted EBITDA, and adjusted EPS will be provided on the Q4 2025 earnings call.
- Long-Term Outlook:
- VA Revenue Potential: Over a 2- to 3-year timeframe, management sees "multiples of revenue" available from the VA contract compared to the $5M+ booked in 2025. They expressed high confidence in reaching $10 million and believe the potential is higher, though the timing to capture all traffic could take three or more years.
- SoHo Revenue Trajectory: Management indicated that the SoHo segment's revenue decline is not expected to level off into the low-single-digits until 2028 or later. A near-term headwind from changes in the search environment could impact the rate of decline in Q4 2025 and potentially Q1 2026.
3. Operational & Strategic Developments
A. Business Performance & Operations
- Corporate Segment Continues Strong Performance: The Corporate segment delivered record revenue of $56.3 million, a 6.1% YoY increase, which management noted was encouraging given a difficult comparison from Q3 2024.
- Key Growth Drivers: Performance was driven by record usage from existing customers, a record number of net additions (6,700) from the eFax Protect service, and record revenue from the VA contract.
- Management emphasized that corporate ARPA net of eFax Protect has experienced sustained growth for several quarters.
- SoHo Decline Rate Improves: The SoHo segment's revenue declined by a planned 9.2% YoY, an improvement from the 9.4% YoY decline reported in Q2 2025.
- The SoHo cancellation rate improved sequentially to 3.71% from 3.84% in the prior quarter. Management noted that the rate in both Q2 and Q3 was temporarily influenced by a cohort of short-lived, low-cost customers acquired in Q2.
- Key Contract & Product Updates:
- VA Contract: The Department of Veterans Affairs (VA) contract continues to expand, setting new all-time high records for usage during the quarter. Management confirmed the rollout to new facilities is ongoing and is expected to continue throughout 2026. They noted that the company is on pace to exceed $5 million in revenue from the contract in 2025.
- Advanced Products: Management highlighted accelerating adoption and revenue from its Clarity AI product (which turns unstructured data into structured data) and its integration engine business as key contributors to corporate growth.
B. Strategic Initiatives
- Debt Refinancing and Deleveraging: The company executed a key strategic priority post-quarter by using its new credit facility and cash on hand to retire its 6% notes due in 2026.
- On October 15, the company retired $200 million of the notes. A call notice was issued for the remaining $34 million.
- This action will reduce total indebtedness to $569 million and bring the company's gross debt to adjusted EBITDA ratio very close to its 3x target.
- The interest rate on the new debt is 5.65%, 35 basis points lower than the cost of the retired notes.
- Brand Refresh and Go-to-Market Strategy: The company is executing a strategic brand refresh following a year-long study.
- The eFax brand will be emphasized to unify the entire go-to-market portfolio, including cloud fax, interoperability, and AI solutions, under a single, well-established name.
- Consensus Cloud Solutions will be maintained as the NASDAQ-listed corporate brand for investor continuity.
- Capital Allocation: Management stated it will continue to look for opportunistic repurchases of both debt and equity. For 2026, the company will evaluate its capital allocation strategy with a focus on the 2028 bond maturity, potentially paying down its revolver, which can be re-borrowed if needed.
C. Risk Factors & Headwinds
- SoHo Search Environment Headwinds (New): Management identified a new near-term headwind in the SoHo segment due to recent changes in the search environment, which contributed to a slight decline in organic sign-ups.
- This is expected to persist into Q4, and management noted it will likely take several months, potentially into early 2026, to fully recover paid adds to the target mid-50,000s level.
- This headwind could cause the rate of YoY revenue decline to "trend modestly" worse in Q4 and possibly Q1 2026, temporarily disrupting the sequential improvement seen in prior quarters.
- Public Sector Pipeline Delays: The temporary government shutdown led to some delayed decision-making among other government agencies, creating a "short-term timing impact" on the conversion of the company’s FedRAMP pipeline. Management’s positive long-term outlook for this pipeline remains unchanged.
- Execution Risks: The VA contract rollout remains a multi-year process. The timeline to capture all potential revenue is not entirely within the company’s control, as it depends on factors like the expiration of incumbent contracts at various VA facilities.
4. Q&A Session Key Themes
A. Analyst Focus Areas
- VA Contract Growth Potential (Recurring): Analysts repeatedly sought to quantify the ultimate revenue potential beyond the current ~$5 million run rate and understand the timeline for achieving it.
- SoHo Revenue Trajectory (Recurring): Analysts probed the drivers behind the SoHo segment’s performance, focusing on the recent decline in paid adds and the long-term timeline for the revenue decline to stabilize.
- Forward Capital Allocation (Evolved): An email question shifted the focus to the company’s capital allocation priorities for 2026, specifically the balance between further debt reduction and share repurchases.
B. Key Challenges & Concerns
- Concern: Quantifying the full potential of the VA contract.
- Management Response: Management expressed high confidence that the VA contract could grow from its current $5M+ pace to $10M. They further stated there is "good reason to believe it’s a higher number than that," but cautioned that capturing all available traffic is a multi-year process that will likely take "at least 3 years".
- Concern: Lack of a clear timeline for the SoHo segment’s stabilization.
- Management Response: Management stated that stabilization is unlikely to occur in 2026 or 2027, projecting it for "2028 or later." They cited the complexity of modeling the aging customer base and the mix of new customer acquisitions as reasons for the extended timeline.
- Concern: Impact of new SoHo headwinds.
- Management Response: Management detailed that recent changes in the search environment created a "near-term headwind" causing a slight decline in organic sign-ups. They acknowledged this could cause the year-over-year rate of decline to worsen modestly in Q4 2025 and potentially Q1 2026.
5. Strategic Themes & Inflection Points
A. Current Period Themes
- Dominant Narrative: Execution and De-risking: The primary message was the successful execution of the company's strategy. This was demonstrated by the Corporate segment's continued 6%+ growth against a difficult prior-year comparison and, most significantly, the post-quarter retirement of the 6% notes, which brought the company to its target leverage ratio. This completes a major strategic objective and shifts the focus to future capital allocation.
- Operational Focus: Brand Consolidation and Channel Management: The key operational initiative highlighted was the strategic brand refresh, elevating the eFax brand to unify the entire product portfolio. This signals a move to leverage a well-known asset to drive growth across all services, from fax to AI. Concurrently, management is navigating a new near-term headwind in the SoHo channel related to changes in the digital search environment.
- Changes in Tone and Messaging: The tone has evolved from the celebratory inflection point of Q2 to one of confident, steady-state operations. The focus on capital allocation has become more forward-looking, moving from the immediate need to refinance debt to the more strategic question of how to deploy capital in 2026.
B. Future Considerations
- Emerging Opportunities: Quantifying the Public Sector Prize: The long-term potential of the VA contract is becoming more defined. Management provided the most concrete outlook to date, expressing high confidence in reaching $10 million in annual revenue and seeing a path to a significantly higher number. However, they also tempered expectations by setting a timeline of "at least 3 years" to capture this full potential.
- External Environment: Navigating SoHo Headwinds: The introduction of "changes in the search environment" as a headwind for the SoHo business is a new, specific external risk. This factor is expected to impact organic sign-ups and could temporarily worsen the segment's rate of revenue decline in Q4 2025 and Q1 2026.
- Transformation Initiatives: The Next Phase of Capital Allocation: The completion of the debt retirement marks the end of a multi-year balance sheet transformation. This pivots the strategic conversation to 2026 and beyond, with management outlining an opportunistic approach to capital allocation between further debt reduction and share repurchases.
6. Key Items to Monitor Next Quarter
A. Prior Quarter Monitoring Review
| Prior Item | Current Status | Management Commentary |
|---|---|---|
| Impact of "One Big Beautiful Bill Act" | No Update | The topic was not discussed during the Q3 call. |
| Public Sector Pipeline Conversion | Delayed | Management cited the temporary government shutdown as a cause for "delayed decision-making" among new government agencies, creating a "short-term timing impact" on the conversion pace of the FedRAMP pipeline. |
| SoHo Churn and Customer Base Composition | Achieved | The SoHo monthly churn rate improved sequentially to 3.71% from 3.84% in Q2, reversing the prior quarter's increase and aligning with management's strategic objectives. |
| Capital Allocation Pace and Priority | On Track | The company executed its debt retirement plan post-quarter, using its new credit facility to retire the 6% notes. It also repurchased $2.7 million of stock in Q3. Management confirmed an opportunistic approach to both debt and equity repurchases going forward. |
| Corporate Revenue Growth Rate Normalization | Achieved | Corporate revenue growth moderated to 6.1% YoY, down from 6.9% in Q2. This was in line with management's prior-quarter expectation of a slowdown due to a difficult prior-year comparison. |
B. Current Quarter Focus Items
| Category | Item | Timeline | What to Monitor | Why It Matters |
|---|---|---|---|---|
| Risk | SoHo Search Environment Headwinds | Next Quarter / Ongoing | The SoHo paid adds figure versus the target of mid-50,000s and the YoY rate of revenue decline. Monitor commentary on recovering from the "search environment" changes, which management expects could take "several months" into early 2026. | A prolonged headwind could cause the SoHo revenue decline to accelerate beyond the planned rate, potentially offsetting Corporate segment gains and impacting the company's overall free cash flow generation and growth profile. |
| Opportunity | VA Contract Revenue Expansion | Ongoing (2-3+ years) | The exit run rate for VA revenue going into 2026 and commentary on progress in capturing incremental traffic from existing sites. Management expressed high confidence in reaching $10M and sees a path to a higher number. | This is the single largest identified growth catalyst. Achieving the $10M+ annual revenue target would significantly accelerate Corporate segment growth and validate the public sector strategy, providing a major proof point for future large-scale contracts. |
| Operational | Corporate ARPA (Net of eFax Protect) | Next Quarter | Management commentary on the growth trend of core enterprise ARPA, excluding the dilutive effect of the lower-priced (~$50 ARPA) eFax Protect cohort. | This metric demonstrates the health of the core, high-value enterprise customer base. Sustained growth here is crucial to prove the company is successfully upselling existing clients and winning larger deals, offsetting the headline ARPA decline from the mix-shift to smaller SMB customers. |
| Strategic | eFax Brand Unification Strategy | Ongoing | Any early indicators of success, such as improved conversion rates on web assets, commentary on cross-selling of advanced products (like Clarity AI) under the unified brand, or changes in customer acquisition costs. | This initiative aims to leverage the well-known eFax brand to drive growth across the entire product portfolio. Its success is key to simplifying the go-to-market message and accelerating adoption of higher-value interoperability and AI solutions. |
| Strategic | 2026 Capital Allocation Priorities | Next Quarter / Ongoing | The balance between share repurchases and further debt reduction (specifically paying down the revolver), now that the company is near its 3x gross leverage target. Monitor for any shift in management's tone towards M&A. | With the balance sheet de-risked, capital allocation decisions will be a primary driver of shareholder returns. The choice between buybacks, debt paydown, or potential M&A will signal management's view on the best use of cash and the next phase of its growth strategy. |
Appendix: Quotes by Theme
-
Quantifying the VA Contract's Long-Term Potential: Management provided its most specific long-term revenue forecast for the VA contract, signaling high confidence in a multi-year expansion well beyond the current run rate.
"If you look out over, say, a 2- to 3-year time frame, there leads us to believe there are multiples of revenue available to what we booked in 2025... I think $10 million is a highly confident number... But I think we have good reason to believe it's a higher number than that. The question is how much higher than $10 million." — James Malone, CFO (Q&A)
- vs Q2-FY25:
"The VA rollout is proceeding well, and we are seeing steady increase in the adoption of our services." — Johnny Hecker, CRO
- vs Q3-FY24:
"The implementation of ECFax at the Department of Veterans Affairs is progressing as planned. We have observed steady growth that is aligned with our projections and allows us to confidently confirm the forecast of over $2 million in revenue from the ECFax program in 2024." — Johnny Hecker, CRO
-
New SoHo Headwind from Search Environment Changes: Management identified a new external challenge impacting the SoHo segment, shifting the narrative from internally-driven churn dynamics in the prior quarter to a market-driven headwind.
"Like all businesses that rely on digital marketing, we are actively navigating the recent changes in the search environment. This has created a near-term headwind contributing to a slight decline in organic sign-ups in Q3, which we believe will continue in Q4." — Johnny Hecker, CRO
- vs Q2-FY25:
"I want to provide some color on the recent volatility in our SoHo cancel rate, which we see as a direct result of our strategic execution. There are two primary drivers. First, as we continuously refine our acquisition strategy, we're attracting a more diverse mix of customers... Second, the outstanding success of our corporate e-commerce channel..." — Johnny Hecker, CRO
-
Extended Timeline for SoHo Revenue Stabilization: In response to analyst questions, management provided a more distant and specific forecast for when the SoHo segment's revenue decline is expected to level off.
"I mean I think look, it's clearly even at the accelerated pace, it's not going to happen in '26, probably depending on where your goal, it's not going to happen in '27. So, it's '28 or later." — R. Turicchi, CEO (Q&A)
-
Capital Allocation Strategy Evolves Post-Deleveraging: With the 6% notes retired and the leverage target nearly met, management's focus for capital allocation has shifted to a more opportunistic, forward-looking stance focused on the 2028 bond maturity.
"One of the things that we're going to be looking at is as we get into '27 and we look at the 6.5s and their maturity in October of '28, what is sort of the right level of debt... if we do have excess cash and we can't buy bonds and we don't like the stock price... we could pay down the revolver. And then if we have needs in the future, we could reborrow the revolver." — R. Turicchi, CEO (Q&A)
- vs Q2-FY25:
"We were able to repurchase approximately $12 million of our common stock during the quarter at a valuation of approximately 5x adjusted EBITDA, which we view as attractive." — R. Scott Turicchi, CEO
-
Highlighting Strength of Core Enterprise Business: Management explicitly segmented the Corporate ARPA trend to emphasize that the underlying health of its core enterprise clients remains strong, despite the dilutive effect of the high-volume, lower-priced eFax Protect product.
"Importantly, we are proud to report strong sustained growth in our corporate ARPA net of eFax Protect for several quarters now, which demonstrates the underlying strength and growing value of our core enterprise customer base." — Johnny Hecker, CRO
-
New Brand Unification Strategy (First mentioned this quarter): The company detailed a new go-to-market strategy centered on leveraging the established eFax brand to unify its entire portfolio of services.
"One key factor in this plan is to emphasize one of our greatest assets, our trademarked and redesigned eFax brand... It allows us to bring our entire go-to-market portfolio from cloud fax to interoperability and AI under one familiar name." — Johnny Hecker, CRO
-
Public Sector Pipeline Conversion Faces Short-Term Delay: After highlighting positive momentum in the prior quarter, management noted that the broader public sector pipeline experienced a temporary slowdown due to external government factors.
"While the temporary government shutdown has led to some delayed decision-making, we see this as a short-term timing impact on the conversion pace, and it does not affect our positive outlook for this new pipeline." — Johnny Hecker, CRO
- vs Q2-FY25:
"We are seeing smaller deals progress through the sales funnel at a higher velocity, of which we're excited to report one just closed early in Q3." — Johnny Hecker, CRO
-
Drivers of Advanced Product Adoption: Management specified that growth in advanced solutions is being driven by the combination of its AI-powered data extraction tool and its interoperability services.
"One of them Clarity adoption and Clarity revenue, which is that AI product that abstracts data... And the other one was in combination with that, really our integration engine business, right, where we help customers connect their EHR systems to provide that interoperability." — Johnny Hecker, CRO (Q&A)
Historical Performance