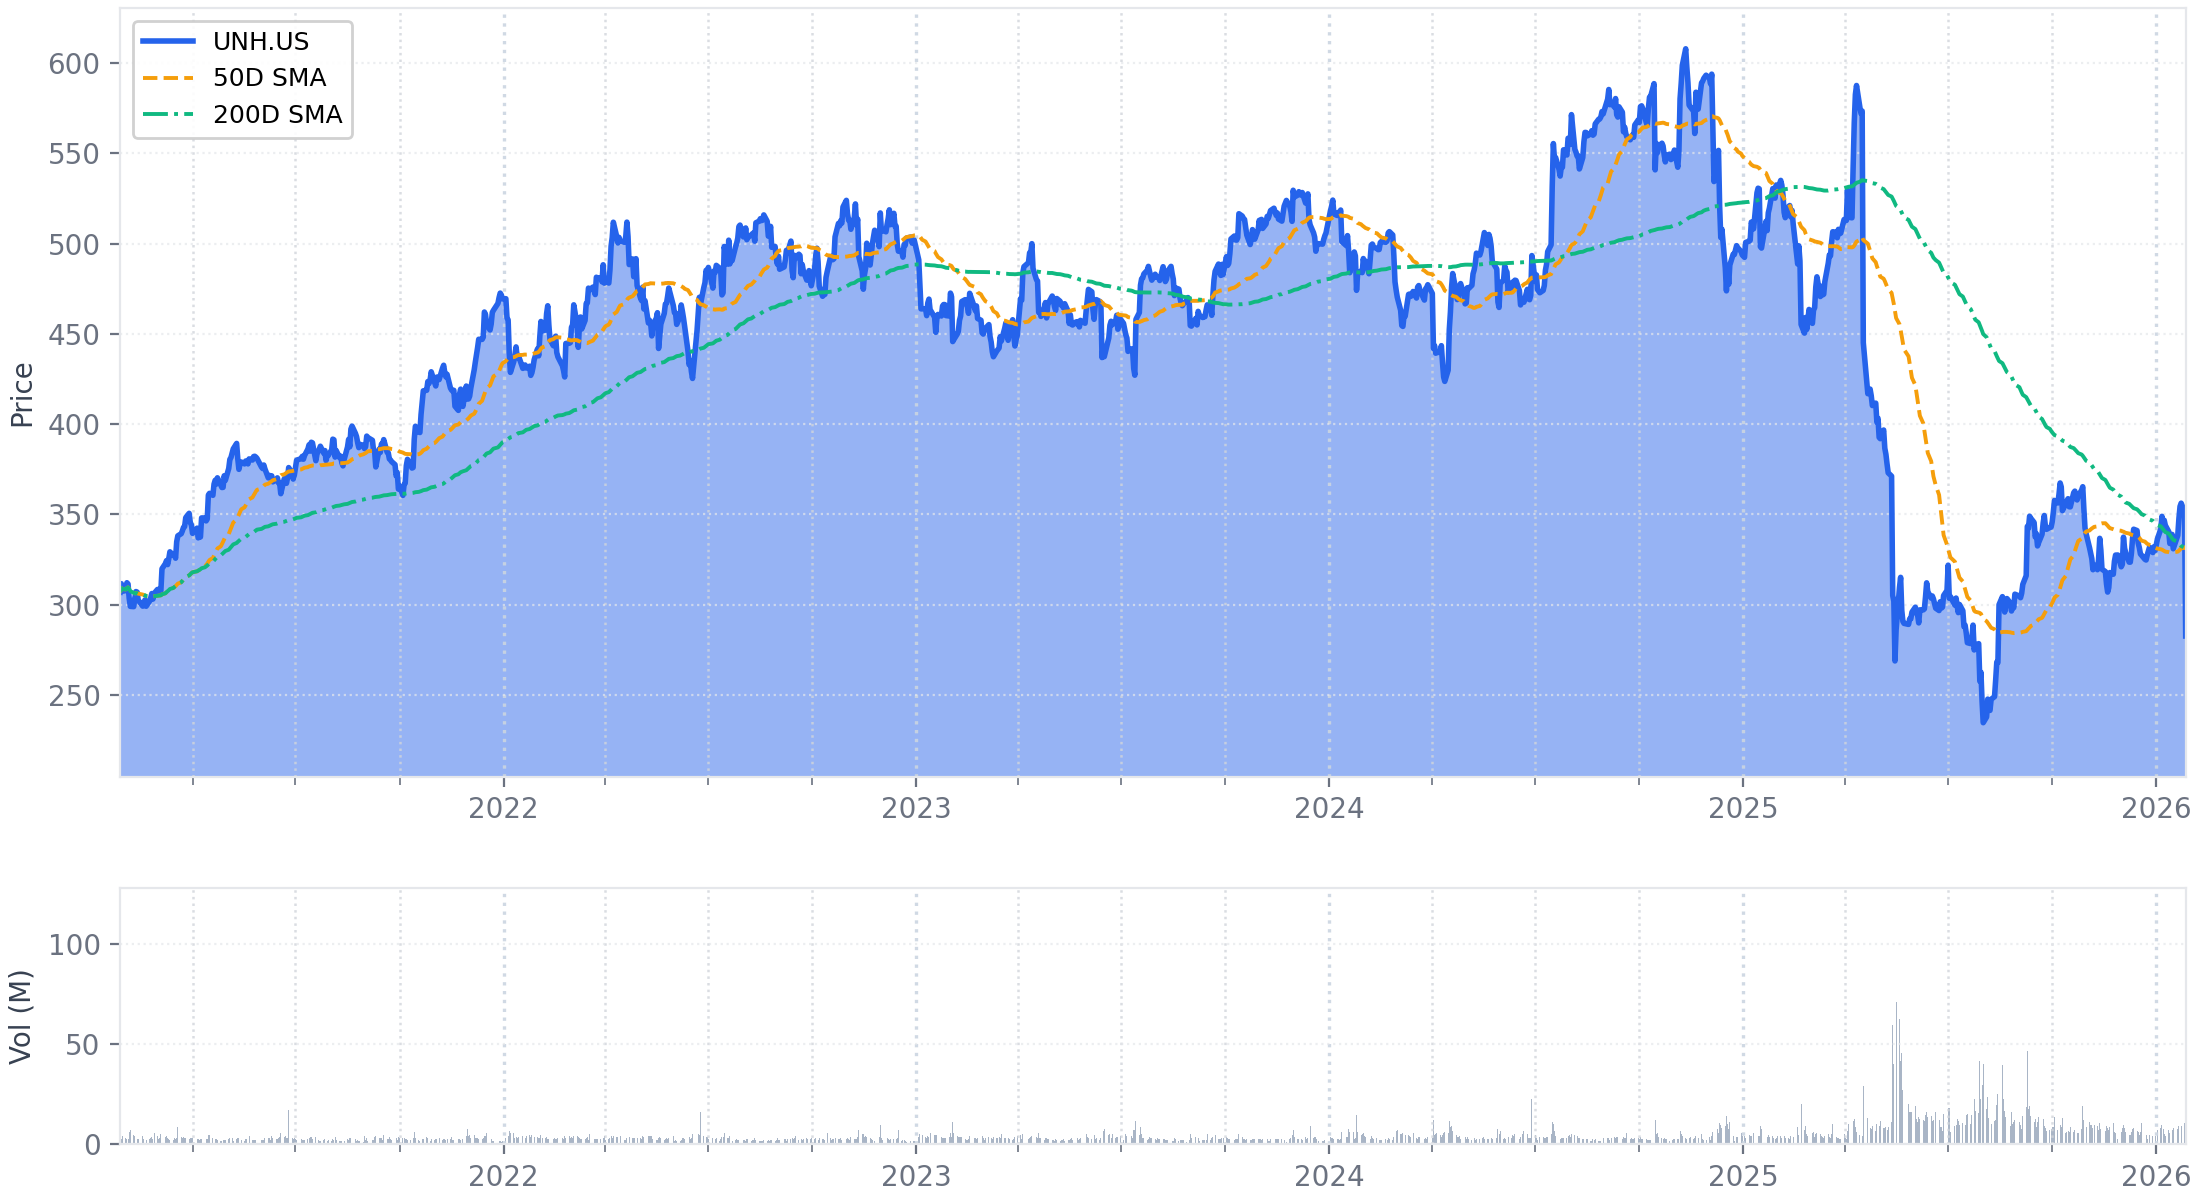
Executive Summary
UnitedHealth Group formalized its strategic reset, introducing a FY 2026 outlook that prioritizes profitability over volume. The company projects > $17.75 in adjusted EPS, representing at least 8.6% year-over-year growth, driven by margin recovery across all segments. This earnings growth is predicated on a significant and planned contraction of 2.3 million to 2.8 million medical members, leading to an expected revenue decline to > $439.0 billion.
The guidance follows a challenging 2025, where the company delivered FY 2025 adjusted EPS of $16.35, slightly ahead of its revised outlook. The year's performance was pressured by an adjusted Medical Care Ratio of 88.9% (+340 bps YoY) and culminated in a $1.6 billion after-tax charge in Q4 related to restructuring, cyberattack costs, and portfolio optimization, effectively resetting the operational base for 2026.
The planned Medicare Advantage contraction for 2026 is now larger than previously guided, at 1.3 million to 1.4 million members, reflecting intense competition. While management expressed confidence in the OptumHealth turnaround despite a Q4 operating income miss, a significant new headwind emerged with the “disappointing” 2027 Medicare Advantage advance notice, which now casts uncertainty on the margin recovery trajectory beyond the 2026 reset year. The company's ability to execute this controlled contraction while navigating intensifying reimbursement pressure is the central focus for investors.
1. Financial Performance Summary
A. Income Statement Metrics (Q4 & Full Year)
UnitedHealth Group's full-year 2025 revenues grew 12% to $447.6 billion, with adjusted EPS of $16.35, slightly exceeding the company's prior guidance of at least $16.25. The fourth quarter was heavily impacted by a $1.6 billion net-of-tax charge ($1.78 per share) related to restructuring, portfolio optimization, and final cyberattack costs. This charge drove a significant divergence between GAAP and adjusted results. On an adjusted basis, operating margin for the full year contracted by 380 basis points to 4.8%, reflecting elevated medical cost trends and Medicare funding pressures that were highlighted throughout the year.
| Metric | Q4 2025 | Q4 2024 | FY 2025 | FY 2024 | Notes |
|---|---|---|---|---|---|
| Total Revenues | $113.2B | $100.8B | $447.6B | $400.3B | Q4 +12.3%, FY +11.8%. Full-year growth driven by a 16% increase at UnitedHealthcare and 7% at Optum. |
| UnitedHealthcare | $87.1B | $74.1B | $344.9B | $298.2B | Q4 +17.5%, FY +15.7%. FY growth led by Medicare & Retirement (+23%) from membership growth and IRA Part D impacts. |
| Optum | $70.3B | $65.1B | $270.6B | $253.0B | Q4 +8.0%, FY +7.0%. FY growth driven by a 16% increase in Optum Rx revenues from new clients and volume. |
| GAAP Earnings from Operations | $0.4B | $7.8B | $19.0B | $32.3B | Q4 -95.1%, FY -41.3%. Results include a $2.8B pre-tax charge in Q4. Q4 margin 0.3%, FY margin 4.2%. |
| Adjusted Earnings from Operations[1] | $3.1B | $8.3B | $21.7B | $34.4B | Q4 -62.4%, FY -36.9%. Adjusted to exclude the Q4 charge. Q4 margin 2.8%, FY margin 4.8%. |
| UnitedHealthcare | $0.5B | $3.0B | $9.6B | $16.2B | FY -40.6%. Margin contracted to 2.8% from 5.4% due to Medicare funding cuts and elevated medical trends. |
| Optum | $2.7B | $5.2B | $12.1B | $18.2B | FY -33.5%. Margin contracted to 4.5% from 7.2%, driven by reimbursement pressure at Optum Health. |
| GAAP Net Earnings[2] | $10M | $5.5B | $12.1B | $14.4B | Q4 -99.8%, FY -16.3%. Q4 margin near-zero, FY margin 2.7%. |
| Adjusted Net Earnings[3] | $1.9B | $6.3B | $14.9B | $25.7B | Q4 -69.5%, FY -42.0%. Q4 margin 1.7%, FY margin 3.3%. |
| GAAP EPS (Diluted) | $0.01 | $5.98 | $13.23 | $15.51 | Q4 -99.8%, FY -14.7%. |
| Adjusted EPS[3] | $2.11 | $6.81 | $16.35 | $27.66 | Q4 -69.0%, FY -40.9%. Beat prior full-year guidance of "at least $16.25" (Q3-25 transcript). |
Footnotes
- Adjusted Earnings from Operations excludes a pre-tax charge of $2.8 billion in Q4 and FY 2025. The charge consists of: Final Cyberattack Costs ($799M), a gain on Net Portfolio Divestitures ($442M), and Restructuring & Other ($2.5B).
- Net earnings attributable to UnitedHealth Group common shareholders.
- Adjusted Net Earnings and EPS exclude the after-tax impact of the Q4 charge ($1.6 billion or $1.78 per share) and intangible amortization. FY 2025 GAAP EPS of $13.23 is adjusted by +$1.77 for intangible amortization and +$1.35 for the net impact of the charge and other items to arrive at Adjusted EPS of $16.35.
B. Balance Sheet Highlights
The company's debt-to-capital ratio remained stable at 43.9% year-over-year. Management reiterated its target to reach approximately 40% during 2026, supported by strong cash generation.
| Metric | Dec 31, 2025 | Dec 31, 2024 | Change | Notes |
|---|---|---|---|---|
| Cash and Short-term Investments | $28.1B | $29.1B | -3.4% ↓ | — |
| Total Debt[1] | $78.4B | $76.9B | +1.9% ↑ | Modest increase in total borrowings year-over-year. |
| Net Debt[2] | $50.3B | $47.8B | +5.2% ↑ | Net debt increased due to a lower cash balance. |
| Medical Costs Payable | $39.3B | $34.2B | +14.9% ↑ | Increase reflects business growth and higher medical cost trends. |
| Shareholders' Equity | $100.1B | $98.3B | +1.8% ↑ | Growth driven by net earnings, partially offset by returns to shareholders. |
Footnotes
- Total Debt is a calculated metric: Short-term borrowings and current maturities of long-term debt ($6.1B) + Long-term debt, less current maturities ($72.3B) = $78.4B.
- Net Debt is a calculated metric: Total Debt ($78.4B) - Cash and short-term investments ($28.1B) = $50.3B.
C. Cash Flow Analysis
Cash flows from operations for the full year were $19.7 billion, or 1.5 times net income. Management noted this was higher than anticipated due to the timing of certain payments received in 2025 that were expected in 2026. The company returned $13.5 billion to shareholders via dividends and share repurchases.
| Metric (Full Year) | FY 2025 | FY 2024 | Change | Notes |
|---|---|---|---|---|
| Cash Flow from Operations | $19.7B | $24.2B | -18.6% ↓ | Higher than expected due to timing of cash flows. |
| Capital Expenditures | ($3.6B) | ($3.5B) | +3.5% ↑ | — |
| Free Cash Flow[1] | $16.1B | $20.7B | -22.3% ↓ | — |
| Dividends Paid | ($7.9B) | ($7.5B) | +5.1% ↑ | — |
| Share Repurchases | ($5.5B) | ($9.0B) | -38.3% ↓ | — |
| Net Debt Issuance / (Repayment) | +$0.7B | +$14.7B | -95.1% ↓ | Significant reduction in net borrowings compared to the prior year. |
Footnotes
- Free Cash Flow is a calculated metric: Cash Flow from Operations ($19.7B) - Purchases of property, equipment and capitalized software ($3.6B) = $16.1B.
D. Key Financial Ratios
Key profitability and efficiency ratios reflect the significant operational and funding pressures faced in 2025. The adjusted Medical Care Ratio increased by 340 basis points to 88.9%, while the adjusted Operating Cost Ratio remained flat at 12.9%, demonstrating cost discipline amidst top-line challenges.
| Metric | FY 2025 | FY 2024 | Change | Notes |
|---|---|---|---|---|
| Medical Care Ratio (Reported) | 89.1% | 85.5%[1] | +360 bps ↑ | Includes a 20 bps negative impact from lost contract reserves. |
| Medical Care Ratio (Adjusted) | 88.9% | 85.5%[1] | +340 bps ↑ | Increase driven by Medicare funding cuts, IRA changes, and elevated medical cost trends. |
| Operating Cost Ratio (Reported) | 13.3% | 13.2% | +10 bps ↑ | Includes a 40 bps negative impact from the Q4 charge. |
| Operating Cost Ratio (Adjusted) | 12.9% | 12.9% | Flat | Reflects operating efficiencies offsetting investments for growth. |
| Debt-to-Capital Ratio | 43.9% | 43.9% | Flat | Management targets ~40% in 2026. |
| Days Claims Payable (DCP) | 44.1 days | 47.0 days | -2.9 days ↓ | Decline reflects IRA impacts on the Part D program and claims payment timing. |
| Return on Equity (ROE)[2] | 12.2% | 15.0% | -280 bps ↓ | Decline driven by lower net income. |
Footnotes
- FY 2024 MCR sourced from the Q4 2025 filing's comparative data.
- Return on Equity is a calculated metric: FY 2025 Net Earnings ($12.1B) / Average Shareholders' Equity for 2024-2025 ($99.2B) = 12.2%.
E. Industry-Specific Operational Metrics
UnitedHealthcare grew its total medical membership by 415,000 people year-over-year, driven by a 755,000 increase in Medicare Advantage, which includes complex care members also counted in Medicaid. This growth was partially offset by contractions in Commercial Risk and Medicaid. Optum Health saw a 5% decline in consumers served, reflecting portfolio optimization efforts.
| Metric | Dec 31, 2025 | Sep 30, 2025 | Dec 31, 2024 | Notes |
|---|---|---|---|---|
| Total Medical Members (in thousands) | 49,760 | 50,125 | 49,345 | +415k YoY ↑; -365k sequentially ↓. |
| Commercial - Risk-based | 8,165 | 8,440 | 8,845 | -680k YoY ↓, reflecting pricing discipline. |
| Commercial - Fee-based | 21,485 | 21,490 | 20,885 | +600k YoY ↑, showing momentum in self-funded offerings. |
| Medicare Advantage | 8,445 | 8,435 | 7,845 | +600k YoY ↑. Total MA growth including DSNP was 755k. |
| Medicaid | 7,380 | 7,460 | 7,435 | -55k YoY ↓, due to state eligibility redeterminations. |
| Optum Health Consumers Served (millions) | 95 | 96 | 100 | -5% YoY ↓. Reflects strategic refocusing and portfolio changes. |
| Optum Insight Contract Backlog (billions) | $31.1 | $32.1 | $32.8 | -5.2% YoY ↓. |
| Optum Rx Quarterly Adjusted Scripts (millions) | 424 | 414 | 422 | +0.5% YoY ↑. |
2. Forward-Looking Guidance
Management introduced its formal outlook for FY 2026, projecting a year of margin recovery and operational reset. The guidance reflects a planned, strategic contraction in membership to right-size the business for profitability. The company expects adjusted EPS growth of at least 8.6% year-over-year, driven by margin expansion across all segments, particularly at UnitedHealthcare. The long-term growth target of 13-16% was also reaffirmed.
A. Guidance Summary
| Metric | Period | Current Guidance (Introduced Q4 2025) | Prior Guidance (from Q3 2025) | Change | Management Commentary |
|---|---|---|---|---|---|
| Revenue | FY 2026 | > $439.0B | Comfortable with analyst consensus | Formalized | Reflects a planned ~2% YoY decline due to intentional rightsizing across the enterprise. |
| Adjusted EPS | FY 2026 | > $17.75 | Comfortable with analyst consensus | Formalized | Represents at least 8.6% YoY growth, driven by operational improvements and margin stabilization. |
| GAAP EPS | FY 2026 | > $17.10 | — | Introduced | — |
| Cash Flow from Operations | FY 2026 | > $18.0B | — | Introduced | Expected to be approximately 1.1x net income. |
| Medical Care Ratio | FY 2026 | 88.8% ± 50 bps | — | Introduced | Reflects repricing efforts and an assumption that medical care activity will remain at current trend levels. |
| Operating Cost Ratio | FY 2026 | 12.8% ± 50 bps | — | Introduced | Reflects cost management, productivity initiatives, and early benefits from AI investments. |
| Long-Term EPS Growth | Post-2026 | 13% - 16% | "Higher and sustainable double-digit growth beginning in 2027" | Reaffirmed & Refined | Management stated confidence in returning to its historical long-term growth rate, citing the potential of AI, value-based care, and thoughtful capital deployment. |
B. Additional Notes & Commentary
-
Business Segment Outlook for 2026:
- UnitedHealthcare: Expected to achieve ~13% adjusted operating earnings growth, driven by margin expansion of approximately 40 basis points. This improvement is led by repositioning and repricing in the Commercial and Medicare segments.
- Optum: All three segments are expected to deliver adjusted earnings growth ranging from low to high single digits, with margin expansion of 20 to 90 basis points across the portfolio. Growth is expected to be tempered in the first half with momentum building into the second half of the year.
- OptumHealth: Operating earnings growth of ~9% with margin expansion of ~30 bps.
- OptumInsight: Operating earnings growth of >4% with margin expansion of ~90 bps.
- OptumRx: Operating earnings growth from margin expansion of ~20 bps.
-
Membership Contraction for 2026:
- The guidance is built on a significant, planned reduction in membership to restore margins.
- Total Medical Membership: Expected contraction of 2.3 million to 2.8 million people.
- Medicare Advantage: Contraction is now expected to be 1.3 million to 1.4 million members, larger than previously anticipated due to competitive market dynamics during the Annual Enrollment Period.
- Medicaid: Contraction of 565,000 to 715,000 people, including DSNP members, due to reduced eligibility and a state contract exit.
- Commercial: The largest share of the risk-based decline is from the exchange business (over 500,000), with the remainder from group risk plans. This is partly offset by growth in self-funded offerings.
-
Earnings Seasonality: Management expects slightly under two-thirds of full-year earnings to be generated in the first half of 2026, a progression largely consistent with 2025.
-
Capital Allocation:
- The company expects its debt-to-capital ratio to reach its long-term target of approximately 40% before year-end 2026.
- As leverage improves, management anticipates a return to historical capital deployment practices in the second half of the year.
- The 2026 outlook includes ~$8.0 billion in dividends and ~$2.5 billion in share repurchases.
-
Strategic & Organizational Changes:
- The 2026 outlook reflects the realignment of Optum Financial Services from OptumHealth into OptumInsight to better integrate financial technology capabilities with AI-driven revenue cycle solutions.
- Management plans to invest nearly $1.5 billion in technology and AI in 2026 to drive productivity and enhance consumer experiences.
3. Operational & Strategic Developments
Management's commentary centered on a year of decisive action to reset the company's operational and financial trajectory. The second half of 2025 was characterized by a pivot to a "profitability over volume" strategy, involving significant repricing, portfolio rationalization, and a renewed focus on execution discipline. This sets the stage for a planned strategic contraction in 2026, which management frames as a necessary step to restore historical margin profiles and build a stronger foundation for a return to double-digit growth in 2027.
A. Business Performance & Operations
The company is executing a broad strategic repricing across its insurance portfolio to align with persistently elevated medical cost trends, leading to a significant planned reduction in membership for 2026.
- Medicare Advantage (MA): The planned membership contraction for 2026 is now expected to be larger than previously guided. Management attributed the increased attrition to "intensely competitive" market dynamics during the Annual Enrollment Period, which drove higher-than-expected plan shopping by seniors. The company's pricing strategy prioritized margin recovery over membership retention.
- Commercial: A significant decline in risk-based membership is planned, with the largest component coming from the exchange (ACA) business following aggressive repricing actions to ensure a sustainable foundation in those plans. The contraction in fully insured group plans is expected to be partially offset by continued growth in self-funded offerings.
- Medicaid: Membership is projected to contract due to state eligibility redeterminations and the company's exit from one state contract.
- OptumRx: The business had a strong external selling season, securing 800 new customer relationships for 2026 and 2027. However, the resulting membership growth was offset by the planned membership contraction at its largest client, UnitedHealthcare.
- OptumHealth: As part of its strategic reset, the business has streamlined its risk membership by approximately 15% by exiting unaligned PPO contracts and repositioning in certain markets.
- OptumRx Rebate Transparency: The company continues to advance its commitment to pass through 100% of drug rebates, with 95% of customers having elected full pass-through in 2026. Management now expects all remaining customers to transition by 2027, accelerating the timeline from the previously stated 2028 target.
- Clinical Process Simplification: OptumRx has removed prior reauthorization requirements for 180 drugs to reduce friction for members and providers.
B. Strategic Initiatives
The company is focused on three overarching themes: a renewed focus on its mission and culture, the urgent application of modern technology like AI, and advancing greater trust and transparency.
- Technology & Innovation Investment: Management announced a significant commitment to technology and innovation, with plans for substantial multi-year investments starting in 2026 to drive productivity, enhance consumer experiences, and develop new AI-driven service offerings.
- Operational Improvements:
- UHC Cost Reduction: UnitedHealthcare anticipates nearly $1 billion in operating cost reductions in 2026, with many of these efficiencies enabled by AI and automation.
- Optum Health Turnaround: Continuing the "back to basics" plan, management reported concrete progress. Nearly 100% of its employed provider groups are now on one of three strategic Electronic Medical Record (EMR) systems, a consolidation from 18 different EMRs. The affiliated provider network has also been narrowed by nearly 20% over the past year to improve alignment with the value-based care model.
- AI Integration: Artificial intelligence is being broadly leveraged across the enterprise. At UnitedHealthcare, over 80% of member calls now utilize AI tools to improve speed and accuracy. At Optum, AI-enabled automation is a key driver supporting margin expansion outlooks.
C. Risk Factors & Headwinds
1. Financial Health Indicators
- Q4 Restructuring Charge: The company recorded a $1.6 billion after-tax charge ($1.78 per share) in Q4. This was consistent with the "low single-digit billion-dollar" non-cash charge previewed in Q3 and was comprised of three main components: a final true-up for cyberattack-related costs, a net gain on portfolio divestitures, and a charge for broad restructuring activities including workforce reductions and unprofitable contract reserves.
- Balance Sheet & Capital: The debt-to-capital ratio remains stable at 43.9%. Management reaffirmed its plan to reach its long-term target of ~40% before the end of 2026, at which point it expects to resume its historical capital deployment practices in the second half of the year.
- Cash Flow Outlook: While FY 2025 operating cash flow was strong, the outlook for FY 2026 of >$18.0 billion represents a notable sequential decline.
2. Operational Challenges
- Persistent Medicare Funding Pressure: This remains a primary headwind. Management described the 2027 Advance Notice from CMS as "disappointing" because it "simply doesn't reflect the reality of medical utilization and cost trends."
- Ongoing Medicaid Rate Mismatch: State funding shortfalls continue to pressure the Medicaid business. While the company has received some rate relief for 2026 (projecting 6-7% aggregate increases), it anticipates this will remain below its medical trend, leading to continued margin pressure.
- Elevated Medical Cost Trends: The company expects the elevated care activity levels observed in 2025 to persist through 2026. Its guidance incorporates a Medicare cost trend of 10% for 2026, up from approximately 7.5% in 2025.
3. Reporting and Transparency Issues
- New Transparency Initiatives: In a notable strategic shift, management announced it is taking steps to advance trust and transparency. This includes:
- Publishing independent reviews of its business practices, with the first reports on pharmacy services and care management released in December.
- A commitment to begin publishing performance data in 2026, including metrics on prior authorizations, claim approval rates, and rebate practices.
4. Q&A Session Key Themes
The Q&A session was dominated by intense scrutiny of two core areas: the persistent volatility and turnaround progress at OptumHealth, and the long-term sustainability of the Medicare Advantage (MA) business in the face of a challenging reimbursement environment.
A. Analyst Focus Areas
- OptumHealth Performance: Analysts pressed management on a significant Q4 operating income miss relative to prior commentary, seeking tangible reasons for confidence in 2026 stability. Management attributed the underperformance to planned restructuring actions and one-time items, establishing a new adjusted baseline for the business and expressing confidence in its "back to basics" focus.
- Medicare Advantage Outlook: The focus shifted from the 2026 membership reset to the newly released 2027 Advance Notice. Management labeled the notice as "disappointing" and warned it could lead to "profoundly negative" impacts on senior benefits and access to care if finalized as proposed.
- Long-Term Growth: The CEO reaffirmed the company's ability to operate within its historical 13-16% growth rate but notably pivoted away from the specific 2027/2028 recovery timeline discussed in the prior quarter, instead highlighting broader drivers like AI and value-based care.
- Margin Pressure Trajectory:
- OptumHealth: Management maintained that long-term margin targets (6-8%) are intact, arguing that improved execution in high-performing markets would be the primary driver.
- Medicare Advantage: Management confirmed its goal for 50 basis points of margin recovery in 2026 but was non-committal on 2027, citing the uncertainty of the final rate notice.
- Medicaid: Management confirmed that while they expect aggregate rate increases of 6-7% in 2026, this remains below medical trend, and thus they still anticipate margin contraction.
- Commercial: Management expects to recover more than half of the margin gap relative to its historical range in 2026, targeting a full return in 2027.
B. Key Challenges & Concerns
Analysts posed several direct challenges to management's narrative, focusing on the credibility of the OptumHealth stabilization story and the viability of the long-term growth algorithm amid new headwinds.
- Challenge 1: OptumHealth's Credibility and Volatility: The most direct challenge came from Justin Lake (Wolfe Research), who questioned how the company could be confident in a more stable 2026 after a "fairly surprising" and significant operating income miss in Q4 2025. Management responded by re-baselining expectations and attributing the miss to deliberate, one-time restructuring actions.
- Challenge 2: Long-Term Growth Targets vs. MA Headwinds: A.J. Rice (UBS) challenged whether the company could still achieve its previously communicated recovery timeline in light of the negative 2027 MA rate proposal. The CEO’s response was optimistic about long-term potential but notably avoided recommitting to that specific timeline.
- Challenge 3: The Structural Viability of Medicare Advantage: Questions surrounding the 2027 Advance Notice reflected a broader concern about the sustainability of the MA program's funding model. Analysts are probing whether the business can generate adequate returns if government reimbursement fails to keep pace with medical cost trends.
5. Strategic Themes & Inflection Points
The fourth quarter call solidified the company's strategic pivot from a narrative of diagnosis and planning to one of formal execution and disciplined contraction. Having absorbed the operational and financial shocks of 2025, management presented a clear, albeit challenging, path for 2026 centered on margin restoration, with the explicit trade-off of significant membership volume.
A. Current Period Themes
- Dominant Narrative: Execution of the Reset. The central theme has evolved from Q3's "Profitability Over Volume" plan to the formal codification of that strategy in the 2026 guidance. The planned contraction of 2.3 to 2.8 million medical members is now the explicit, foundational assumption for the company's financial plan.
- Operational Focus: AI-Enabled Efficiency. Artificial intelligence has been elevated from a strategic priority to a core operational enabler, cited as a key driver for the nearly $1 billion in planned operating cost reductions at UnitedHealthcare and margin expansion at Optum.
- New Initiative: Proactive Transparency. In a significant strategic shift, management introduced a new commitment to enhancing trust and transparency. This includes publishing independent reviews of business practices and a plan to begin publicly reporting performance metrics in 2026, such as prior authorization and claim approval rates.
- Shift in Recovery Timeline Specificity. While management reaffirmed its long-term 13-16% EPS growth target, the CEO was less committal about the specific 2027-2028 recovery timeline that was discussed in the Q3 call, suggesting the path may be more dependent on external factors.
B. Future Considerations
- Emerging Opportunities: The AI-Powered Health Services Platform. The formal realignment of Optum Financial into OptumInsight, coupled with substantial multi-year investments in technology and AI, signals a major strategic push to build an integrated, AI-driven platform addressing friction across the broader U.S. health system.
- External Environment: Intensifying Government Payor Headwinds. The external reimbursement landscape remains the most significant risk, with the "disappointing" 2027 Medicare Advantage Advance Notice creating material uncertainty for the post-2026 margin recovery trajectory.
- Transformation Initiatives: A Leaner, More Focused Enterprise. The actions taken in late 2025, including the $1.6 billion restructuring charge and planned membership contraction, aim to create a smaller but more profitable and operationally sound business from which to resume growth.
6. Key Items to Monitor Next Quarter
A. Prior Quarter Monitoring Review
The company made progress on all key items identified in the previous quarter, largely executing its planned strategic reset while providing updated, more specific targets for 2026.
| Prior Item | Current Status | Management Commentary |
|---|---|---|
| Execution of Portfolio Rationalization | Achieved | The company completed its strategic review and recorded a $1.6 billion after-tax charge in Q4, consistent with the "low single-digit billion-dollar" charge previewed. Key actions included business exits, restructuring, and the formal realignment of Optum Financial into Optum Insight. |
| Medicare Advantage Membership Attrition | On Track | Management updated its 2026 MA contraction forecast to 1.3 million to 1.4 million members, a larger figure than the prior ~1 million estimate. This was attributed to higher-than-expected "plan shopping" during a competitive enrollment period. |
| Risk: Medicaid Rate Adequacy | On Track | Management confirmed that 2026 will be a "trough" year for Medicaid margins. They expect aggregate rate increases of 6-7%, but noted this is still below the medical cost trend, leading to the anticipated margin contraction. |
| Opportunity: Market Adoption of Optum’s AI-First Products | On Track | The company announced plans for substantial multi-year investments in technology and AI. AI-enabled efficiencies were cited as a key driver of the ~$1 billion in planned UHC operating cost savings. |
| Operational: Capital Deployment Resumption | On Track | Management reaffirmed its plan to reach its ~40% debt-to-capital target before year-end 2026 and expects to resume historical capital deployment practices in the second half of the year. |
B. Current Quarter Focus Items
The following non-guidance items are critical for assessing the company's trajectory and strategic execution in the upcoming quarters.
| Category | Item | Timeline | What to Monitor | Why It Matters |
|---|---|---|---|---|
| Risk | 2027 Medicare Advantage Final Rate Notice | Q2 2026 | - Any improvement in the final rate notice versus the "disappointing" advance notice. - Management's commentary on the need for further benefit reductions or market exits for 2027. |
The final rate will determine the profitability outlook for the MA business post-2026 and directly impacts the credibility of the company's plan to return to its long-term 13-16% growth algorithm. |
| Operational | OptumHealth Turnaround Credibility | Q1-Q2 2026 | - Stabilization of OptumHealth's adjusted operating income, demonstrating that the significant Q4 2025 miss was due to one-time reset actions. - Evidence of consistent execution in the value-based care cohorts. |
Restoring predictability at OptumHealth is crucial for investor confidence. Another quarter of significant negative surprises would undermine the entire turnaround narrative. |
| Strategic | Execution of New Transparency Initiatives | Throughout 2026 | - The timing, format, and content of the initial public data releases on metrics like prior authorization and claim approval rates. - Policy or public reaction to the published data. |
This initiative is a direct response to intense regulatory scrutiny. Successful execution could help rebuild trust and mitigate regulatory risk, but it also opens the company to new criticism. |
| Opportunity | AI-Driven Cost Savings & Platform Commercialization | Ongoing | - Tangible progress toward the ~$1 billion UHC operating cost reduction target. - Early commentary on client adoption of new AI-driven products from Optum Insight. |
Demonstrating a clear ROI on its substantial AI investment is key to proving the company can create a structural cost advantage and develop new, high-margin revenue streams. |
| Risk | Competitive Rationality in Medicare Advantage | Ongoing | - Commentary on the rationality of competitor pricing and benefit design in the MA market following the challenging 2027 rate environment. - Early signals regarding the competitive posture for the 2027 selling season. |
The success of the "margin over volume" strategy depends on a rational market. Continued aggressive pricing by competitors could force UNH to either accept lower margins or cede more market share than planned. |
Appendix: Quotes by Theme
-
A Shift from Planning to Execution on the Strategic Reset: After outlining a strategic pivot in Q3, management's Q4 narrative focused on the tangible actions taken and the return to core principles, framing 2025 as a year of foundational repair.
"I hope everyone is getting the sense from today's comments that we're returning to the operating and executional focus and the quality financial disciplines that have served us well. Details matter in these businesses." — Stephen Hemsley, CEO
- vs Q3-FY25:
"As we look ahead to the next few years, we will consistently emphasize the fundamental execution discipline that has long been a key trade of this company, and I'm gratified to see the quick and enthusiastic response to this enterprise -- to this emphasis from our leadership team." — Stephen Hemsley, CEO
-
Acknowledging Ongoing Volatility and Re-baselining OptumHealth: In response to a direct analyst challenge about a significant Q4 operating income miss, management acknowledged the disappointing result but framed it as a consequence of deliberate, one-time restructuring actions needed to clean the slate for 2026.
"Your results in the fourth quarter and for the full year were, you know, slightly disappointing to our expectations. But really reflective of the restructuring actions that we took in the fourth quarter as well as some onetime items that are now right behind us... excluding restructuring and the move of Optum Financial, our adjusted earnings are now approximately $1.5 billion which is our new baseline that we will continue to build off of in the future." — Krista Nelson, COO of Optum Health (in Q&A)
- Analyst Challenge Prompting the Response:
"You guided to just under $3 billion of OI. With the third quarter results. And if I'm doing the adjusted math correctly, came in closer to $2.3 billion. So underperformed by $607.1 billion [sic, likely $0.7B] dollars of OI in the fourth quarter. It's fairly surprising to still see this kind of volatility in the business..." — Justin Lake, Analyst, Wolfe Research
-
Navigating a More Challenging Medicare Advantage Environment: Management signaled that external pressures are intensifying, with the planned 2026 membership contraction now larger than previously expected and the initial 2027 rate notice posing a significant new headwind.
"The news that we received last night in the advance notice was disappointing. And it was because it's a further for a program that is experienced $130 billion in funding reductions over the last three years... as this all sits today... it will mean very meaningful benefit reductions and will once again need to take a hard look at our geographic footprint, our product footprint." — Timothy Noel, CEO of UnitedHealthcare
- On the larger 2026 membership decline:
"We now expect UHC Medicare Advantage contraction will be in the range of 1.3 million to 1.4 million members for the full year... These are greater losses than originally anticipated as competitive market dynamics drove higher than expected planned shopping during the intensely competitive annual enrollment period." — Timothy Noel, CEO of UnitedHealthcare
- vs Q3-FY25:
"we expect membership contraction of approximately 1 million members in total Medicare Advantage, including individual and group markets." — Timothy Noel, CEO of UnitedHealthcare
-
Subtle Shift in the Long-Term Growth Recovery Timeline: When pressed on whether the company could still achieve the 2027-2028 recovery timeline outlined in Q3, the CEO pivoted away from specific years, instead reaffirming the long-term 13-16% growth algorithm and highlighting the drivers that make it achievable over time.
"So we're not gonna really talk to '27. Obviously, it's January '26... I will speak, let's say, to a longer term and that is you know, very much feel that we can be operate within our long term growth rate margins, that 13% to 16%... the long term growth for this enterprise is kind of more compelling than ever. But we have to play to full potential. And we have to execute." — Stephen Hemsley, CEO (in Q&A)
- vs Q3-FY25:
"We intend to balance our earnings growth ambitions in 2026 with investments and actions that will drive higher and sustainable double-digit growth beginning in 2027 and advancing from there." — Stephen Hemsley, CEO
-
New Strategic Pillar: A Proactive Push for Transparency: In a notable strategic development, management announced a new initiative to publicly report performance data, a direct response to increasing public and regulatory scrutiny of the industry.
"in 2026, we will begin to publish our results in areas of interest such as prior authorizations, and claim approval rates, certain performance statistics, data and trends, rebate practices and prices for products and services... we will become even more publicly accountable for our performance and strive every day to improve it." — Stephen Hemsley, CEO
-
AI Evolves from Aspiration to a Quantified Operational Driver: The narrative around Artificial Intelligence has matured from a high-level strategic priority to a core enabler of the 2026 financial plan, with management now attaching specific cost-saving targets to its implementation.
"Our UHC recovery effort is being supported by steady efficiency gains as we advance AI and machine learning capabilities across our businesses. We anticipate operating cost reductions of nearly $1 billion in 2026 many AI enabled..." — Timothy Noel, CEO of UnitedHealthcare
- vs Q3-FY25:
"We are also accelerating our pace of AI applications to fundamentally advance a vast spectrum of processes and capabilities we expect will structurally improve our enterprise performance." — Wayne DeVeydt, CFO
-
Accelerating OptumRx Rebate Transparency Timeline: Management pulled forward its commitment to 100% rebate pass-through, now expecting full adoption by 2027, a year earlier than previously communicated.
"Over 95% of our customers have elected to receive full rebate pass through in 2026. With all remaining customers expected to transition by the 2027." — Patrick Conway, CEO of Optum
- vs Q3-FY25:
"we expect 95% of our customers will be in these arrangements in 2027 with the remainder in full rebate pass-through by 2028." — Patrick Conway, CEO of Optum
-
Confidence in OptumHealth Turnaround Despite Headwinds: Management maintained that its internal execution, rather than external rate pressures, is the primary determinant for achieving its long-term margin targets at OptumHealth.
"We have opportunities to improve performance in the business, you know, just outside of MA rates... we've got about 30% of our mature value based care patients that are already again inside that target margin range or above... So really more about execution really than any other single factor, really is focused on execution." — Krista Nelson, COO of Optum Health (in Q&A)
Historical Performance