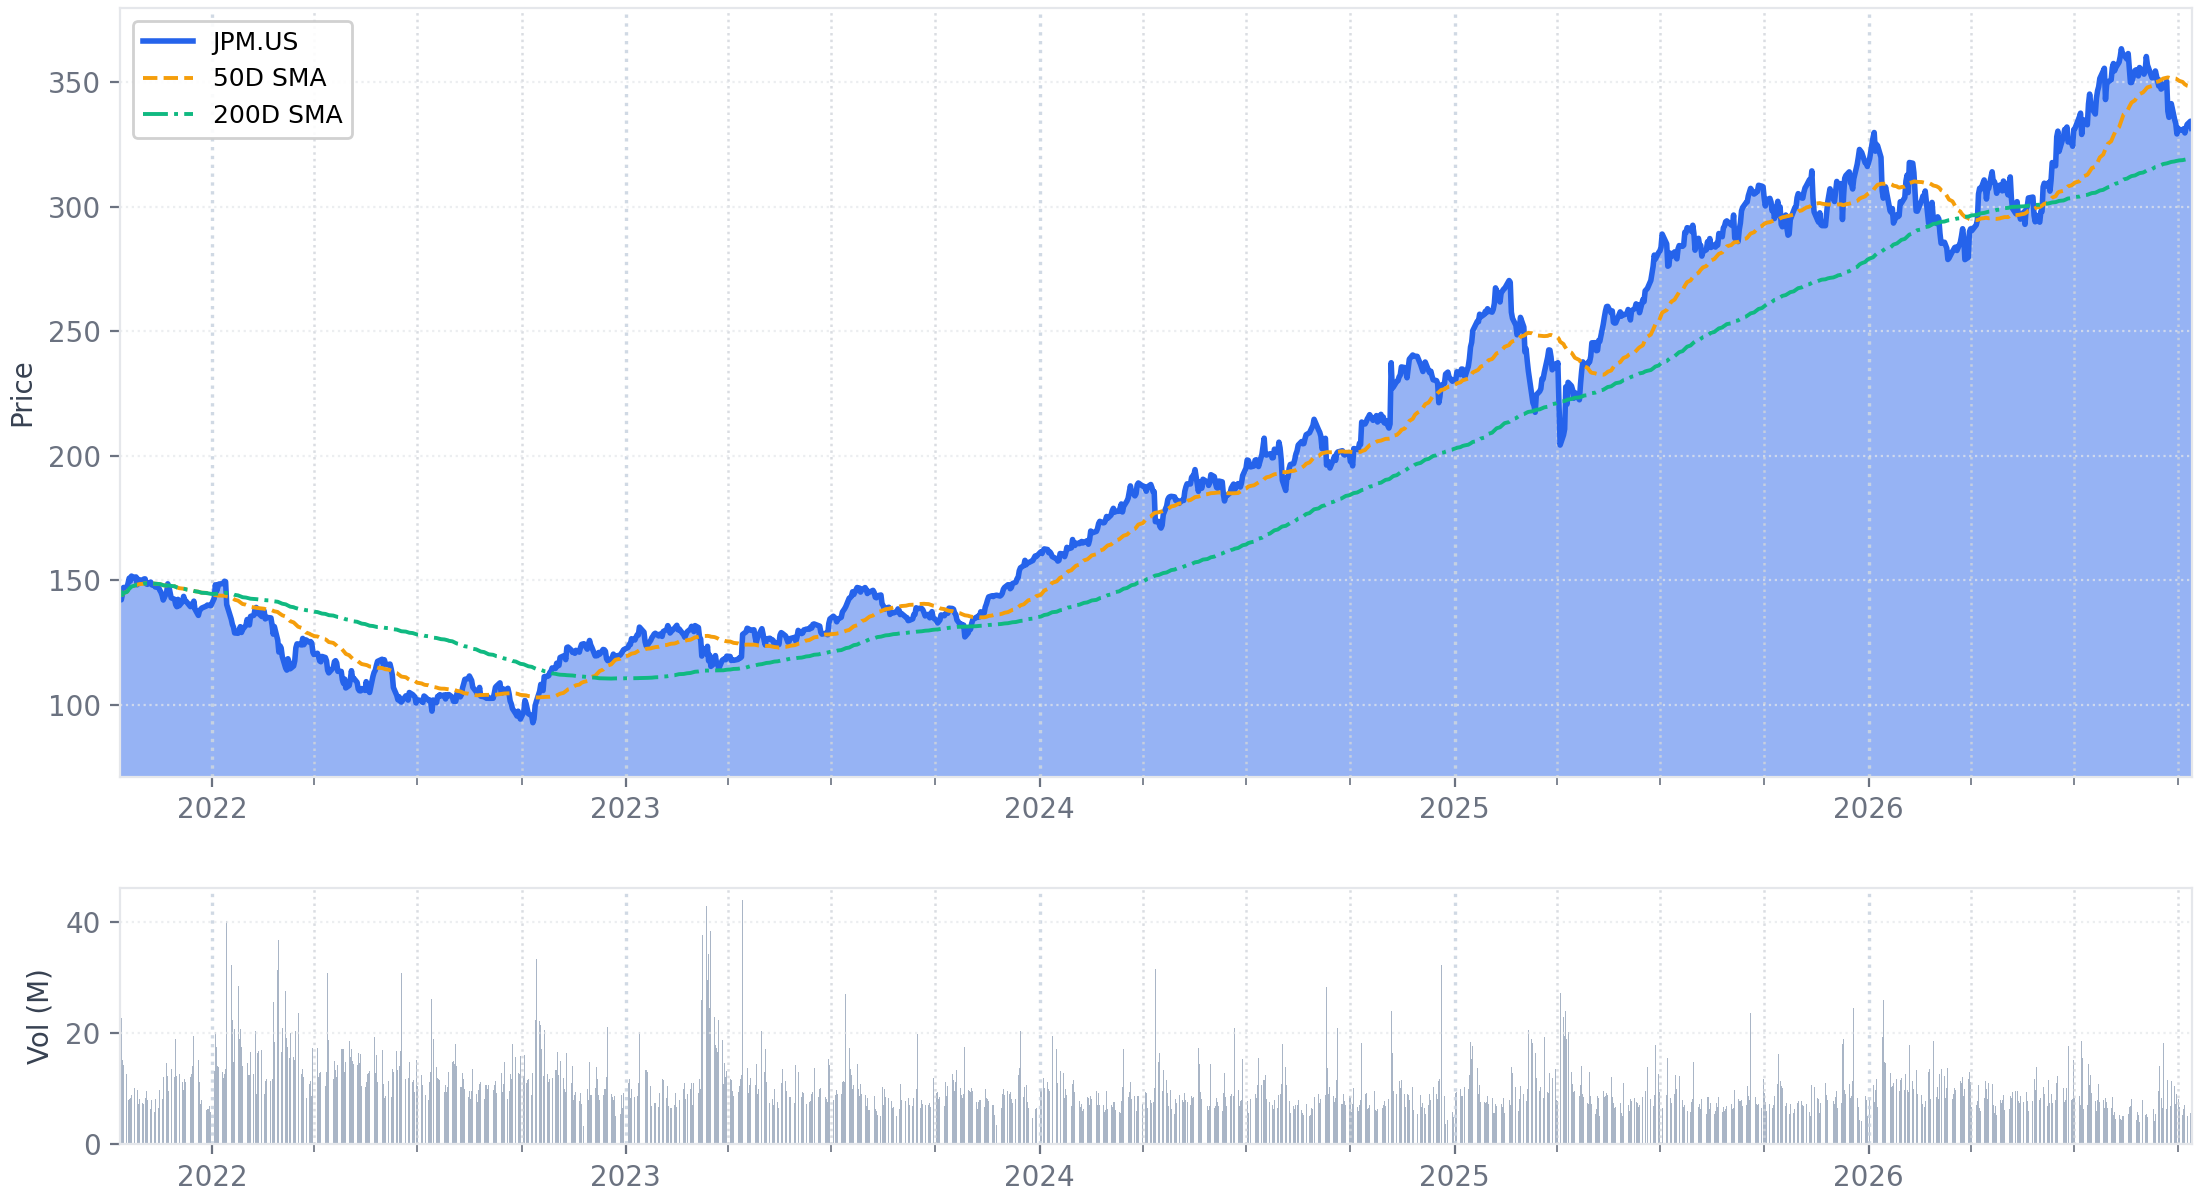
Executive Summary
JPMorgan Chase reported Q3 2026 net income of $15.3 billion ($5.57 per share), or $15.8 billion ($5.75 per share) excluding $658 million in pre-tax net securities losses. Managed net revenue grew 8.0% to $50.9 billion, supported by an Equity Markets revenue increase of 49% and broad-based deposit expansion across consumer and wholesale franchises.
Management raised full-year 2026 guidance, lifting implied total NII to ~$106.2 billion and adjusted expenses to ~$108.6 billion due to volume-related costs. A preliminary 2027 NII ex-Markets central case of ~$107 billion was introduced, reflecting ~$5 billion in growth over the annualized fourth-quarter run rate. Meanwhile, net share repurchases were curtailed to $664 million as capital shifted toward organic opportunities, including the $1.5 trillion Security Resiliency Initiative, which exceeded $200 billion in year-one deployment.
Management signaled selective credit tightening across wholesale lending amid competitor covenant loosening, while noting late-quarter investment banking moderation from rate volatility. For investors, redirecting capital from repurchases into higher-yielding organic assets supports return targets, but increases balance sheet sensitivity to terminal rate paths and AI infrastructure concentration limits.
1. Financial Performance Summary
JPMorgan Chase delivered net income of $15.3 billion ($5.57 per diluted share) in Q3 2026, or $15.8 billion ($5.75 per share) excluding a $658 million pre-tax net investment securities loss ($498 million after-tax; -$0.18 EPS impact) in Corporate. Managed net revenue grew 8.0% year-over-year to $50.9 billion (reported revenue rose 8.1% to $50.2 billion), supported by a 49% surge in Equity Markets revenue, higher asset management fees across Asset & Wealth Management and Consumer & Community Banking, and broad-based deposit growth.
The firm achieved a return on tangible common equity (ROTCE) of 20% (21% excluding the securities loss) and a return on common equity (ROE) of 17%. Credit costs stood at $2.7 billion, reflecting $2.2 billion of net charge-offs (down 15.0% YoY) and a net reserve build of $539 million, driven primarily by wholesale lending activity. Standardized common equity Tier 1 (CET1) capital ended at $304 billion (13.9% ratio), down 30 basis points sequentially due to risk-weighted asset expansion, AOCI marks, and capital distributions.
A. Income Statement Metrics
Managed net revenue expanded 8.0% year-over-year to $50.9 billion, led by double-digit expansion across the Commercial & Investment Bank (+14.4%) and Asset & Wealth Management (+13.9%), while Consumer & Community Banking advanced 8.7%. Pre-provision profit on a managed basis rose 3.4% to $23.6 billion, as top-line gains were partially offset by a 12.4% increase in noninterest expense to $27.3 billion, driven by higher volume- and revenue-related compensation, front-office headcount additions, marketing, and technology investments.
| Metric | Q3 2026 | Q3 2025 | Change (%) | Notes |
|---|---|---|---|---|
| Total Net Revenue (Reported GAAP) | $50,172M | $46,427M | +8.1% | Driven by markets, higher fees, and deposit growth; offset by securities losses |
| Total Net Revenue (Managed Basis)[1] | $50,907M | $47,120M | +8.0% | Fully taxable-equivalent adjustment of $735M in Q3 2026 vs. $693M in Q3 2025 |
| - Consumer & Community Banking (CCB) | $21,171M | $19,473M | +8.7% | Higher Card Services NII, asset management fees, and auto lease income |
| - Commercial & Investment Bank (CIB) | $22,734M | $19,878M | +14.4% | Outperformance in Equity Markets (+49%) and Payments (+14%) |
| - Asset & Wealth Management (AWM) | $6,909M | $6,066M | +13.9% | Driven by higher average market levels, strong net inflows, and loan growth |
| - Corporate | $93M | $1,703M | -94.5% | Impacted by $658M net securities losses and lower NII from lower rates |
| GAAP Pre-Provision Profit[2] | $22,877M | $22,146M | +3.3% | Reported pre-provision margin of 45.6% vs. 47.7% in Q3 2025 |
| Managed Pre-Provision Profit[2] | $23,612M | $22,839M | +3.4% | Managed pre-provision margin of 46.4% vs. 48.5% in Q3 2025 |
| - Consumer & Community Banking (CCB) | $9,591M | $9,177M | +4.5% | Operating margin of 45.3% vs. 47.1% in Q3 2025 |
| - Commercial & Investment Bank (CIB) | $11,963M | $10,156M | +17.8% | Operating margin of 52.6% vs. 51.1% in Q3 2025 |
| - Asset & Wealth Management (AWM) | $2,551M | $2,248M | +13.5% | Operating margin of 36.9% vs. 37.1% in Q3 2025 |
| - Corporate | $(493)M | $1,258M | NM | Swung to pre-provision loss on investment losses and rate compression |
| GAAP Income Before Income Tax Expense | $20,134M | $18,743M | +7.4% | GAAP pre-tax operating margin of 40.1% vs. 40.4% in Q3 2025 |
| Managed Income Before Income Tax Expense[1] | $20,869M | $19,436M | +7.4% | Managed pre-tax operating margin of 41.0% vs. 41.2% in Q3 2025 |
| GAAP Net Income | $15,305M | $14,393M | +6.3% | Net income margin of 30.5% (reported) vs. 31.0% in Q3 2025 |
| Adjusted Net Income[3] | $15,803M | $14,393M | +9.8% | Excludes $498M after-tax net investment securities losses in Corporate |
| GAAP EPS (Diluted) | $5.57 | $5.07 | +9.9% | Based on 2,683.0M diluted shares vs. 2,767.6M in Q3 2025 (-3.1%) |
| Adjusted EPS (Diluted)[3] | $5.75 | $5.07 | +13.4% | Excludes $0.18 per share after-tax net investment securities losses |
Footnotes
- Managed basis is a non-GAAP financial measure that presents total net revenue on a fully taxable-equivalent (FTE) basis by adding tax-equivalent adjustments ($735M in Q3 2026 and $693M in Q3 2025) to reported revenue. Income tax expense is increased by an identical amount, resulting in zero impact on net income.
- Pre-Provision Profit is a non-GAAP financial measure calculated as Total Net Revenue less Noninterest Expense. GAAP Pre-Provision Profit: Reported Revenue ($50,172M) - Noninterest Expense ($27,295M) = $22,877M for Q3 2026 vs. $46,427M - $24,281M = $22,146M for Q3 2025. Managed Pre-Provision Profit: Managed Revenue ($50,907M) - Noninterest Expense ($27,295M) = $23,612M for Q3 2026 vs. $47,120M - $24,281M = $22,839M for Q3 2025.
- Adjusted Net Income and Adjusted EPS are non-GAAP financial measures. Q3 2026 reported GAAP net income of $15,305M excludes $658M of pre-tax net investment securities losses in Corporate ($498M after tax), resulting in Adjusted Net Income of $15,803M (difference of $498M or 3.3% of GAAP net income). Q3 2026 reported diluted EPS of $5.57 excludes the -$0.18 per share impact of these securities losses, resulting in Adjusted Diluted EPS of $5.75 (difference of 3.2% of GAAP EPS). Q3 2025 had no corresponding adjustments.
B. Balance Sheet Highlights
Total assets expanded 11.7% year-over-year to $5.09 trillion, supported by a 10.4% increase in gross loans to $1.58 trillion and a 14.8% increase in trading assets to $1.09 trillion. Total deposits grew 9.1% year-over-year to $2.78 trillion, driven by broad-based inflows across wholesale and retail banking. Tangible book value per share rose 6.6% year-over-year to $112.64, while book value per share increased 5.9% to $132.30.
| Metric | Sep 30, 2026 | Sep 30, 2025 | Change (%) | Notes |
|---|---|---|---|---|
| Cash, Equivalents & Short-Term Investments[1] | $788.1B | $729.3B | +8.1% | Excludes borrowing capacity at FHLB and Fed discount window |
| Trading Assets (Debt, Equity & Derivatives)[2] | $1,093.4B | $952.8B | +14.8% | Debt & equity instruments of $1,014.5B and derivative receivables of $78.8B |
| Investment Securities (Net of Allowance)[3] | $821.8B | $783.9B | +4.8% | AFS securities of $547.2B (+11.6%) and HTM securities of $274.6B (-6.4%) |
| Total Loans (Gross) | $1,584.6B | $1,435.2B | +10.4% | Wholesale loans up 16.4% YoY to $938.8B; credit card loans up 7.3% to $252.7B |
| Allowance for Loan Losses | $26.3B | $25.7B | +2.1% | Covers 1.66% of total gross loans and 1.75% of retained loans |
| Total Loans (Net of Allowance) | $1,558.4B | $1,409.5B | +10.6% | Material asset representing 30.6% of total firm assets |
| Accrued Interest & Accounts Receivable | $165.0B | $141.9B | +16.3% | Includes $76.9B in customer margin receivables in CIB, CCB, and AWM |
| Total Assets | $5,091.5B | $4,560.2B | +11.7% | Balance sheet expanded by $531.3B YoY; up 1.5% QoQ |
| Total Deposits | $2,780.8B | $2,548.5B | +9.1% | Noninterest-bearing deposits up 8.4% YoY to $676.0B; interest-bearing up 9.4% to $2,104.8B |
| Fed Funds Purchased & Repos | $703.4B | $567.6B | +23.9% | Material liability representing 13.8% of total balance sheet assets |
| Total Debt[4] | $531.5B | $496.6B | +7.0% | Long-term debt of $460.2B (+7.7%) and short-term borrowings of $71.3B (+2.9%) |
| Net Debt / (Net Cash Position)[5] | $(256.6)B | $(232.7)B | +10.3% | Net cash surplus widened by 10.3% ($23.9B); conservative liquidity profile |
| Accounts Payable & Other Liabilities | $377.4B | $316.9B | +19.1% | Reflects elevated business volumes across markets and transaction services |
| Total Stockholders' Equity | $372.4B | $360.2B | +3.4% | Common equity of $351.3B and preferred stock of $21.0B |
| Tangible Common Equity (TCE)[6] | $299.1B | $287.7B | +4.0% | Non-GAAP measure; excludes $52.7B goodwill and $2.4B intangibles (net of DTL) |
Footnotes
- Cash, Equivalents & Short-Term Investments combines Cash and due from banks ($21,259M vs. $21,821M), Deposits with banks ($305,012M vs. $281,615M), and Federal funds sold and securities purchased under resale agreements ($461,851M vs. $425,815M). Q3 2026: $21,259M + $305,012M + $461,851M = $788,122M ($788.1B). Q3 2025: $21,821M + $281,615M + $425,815M = $729,251M ($729.3B).
- Trading assets include Debt and equity instruments ($1,014,541M in Q3 2026 vs. $892,928M in Q3 2025) and Derivative receivables ($78,811M in Q3 2026 vs. $59,849M in Q3 2025), representing 21.5% of total assets.
- Investment securities net of allowance consists of Available-for-sale (AFS) securities ($547,191M vs. $490,499M) and Held-to-maturity (HTM) securities ($274,564M vs. $293,446M), less credit allowance ($47M vs. $105M), representing 16.1% of total assets.
- Total Debt is calculated as Short-term borrowings ($71,339M vs. $69,355M) plus Long-term debt ($460,160M vs. $427,203M). Q3 2026: $71,339M + $460,160M = $531,499M ($531.5B). Q3 2025: $69,355M + $427,203M = $496,558M ($496.6B). Excludes beneficial interests issued by consolidated VIEs ($28,228M vs. $28,227M).
- Net Debt / (Net Cash Position) is calculated as Total Debt less Cash, Equivalents & Short-Term Investments. Q3 2026: $531,499M - $788,122M = -$256,623M (-$256.6B). Q3 2025: $496,558M - $729,251M = -$232,693M (-$232.7B). The net cash surplus expanded by $23,930M or 10.3%. Under a narrower definition deducting only Cash and due from banks plus Deposits with banks ($326,271M in Q3 2026 vs. $303,436M in Q3 2025), Net Debt would be $205,228M ($205.2B) vs. $193,122M ($193.1B).
- Tangible Common Equity (TCE) is a non-GAAP financial measure calculated as Common stockholders' equity ($351,328M) less Goodwill ($52,717M) and Other intangible assets ($2,378M) plus deferred tax liabilities related to tax-deductible goodwill and identifiable intangibles ($2,897M). Q3 2026: $351,328M - $52,717M - $2,378M + $2,897M = $299,130M ($299.1B). Q3 2025: $340,167M - $52,717M - $2,615M + $2,906M = $287,741M ($287.7B).
C. Cash Flow Analysis
Full GAAP Statements of Cash Flows are reported semi-annually and annually in Form 10-Q and 10-K filings and were omitted from the quarterly 8-K earnings release materials. However, disclosed financing cash distributions and capital transactions for the nine months ended September 30, 2026 show that JPMorgan Chase returned $27.4 billion of net capital to common shareholders (compared to $34.3 billion in the prior-year period), consisting of $12.5 billion in common dividends and $14.8 billion in net share repurchases, while maintaining a last-twelve-months payout ratio of 61%.
| Metric (Nine Months Ended Sep 30) | 9M 2026 | 9M 2025 | Change (%) | Notes |
|---|---|---|---|---|
| Common Dividends Paid / Declared | $(12,533)M | $(11,969)M | +4.7% | Cash dividend of $1.65/share in Q3 2026 (increased from $1.50/share in Q2 2026) |
| Net Share Repurchases (Treasury Stock)[1] | $(14,846)M | $(22,308)M | -33.4% | Outflow slowed as firm prioritized organic capital deployment over buybacks |
| Employee Stock Issuances (Cash & Equity Impact)[2] | $1,132M | $1,234M | -8.3% | Net impact of employee stock-based awards and purchase plans on equity |
| Net Share Repurchases After SBC[3] | $(13,714)M | $(21,074)M | -34.9% | Notional calculation combining net treasury stock repurchases and stock awards |
| Total Capital Returned to Common Shareholders[4] | $(27,379)M | $(34,277)M | -20.1% | Total common dividends declared plus net treasury stock repurchases |
Footnotes
- Net Share Repurchases reflects the net cash purchase of treasury stock from the CET1 capital rollforward (Page 9 of Exhibit 99.2). On a gross program basis (Page 11 of Exhibit 99.2), the firm repurchased 52.3M common shares for $16,088M at an average price of $307.36 in 9M 2026, compared to 87.7M common shares for $23,378M at an average price of $266.44 in 9M 2025. In Q3 2026, gross repurchases were 3.1M shares for $1,057M (net repurchases of $664M after employee issuances, or $1,004M net cash purchase of treasury stock).
- Represents the net impact of employee stock issuances on stockholders' equity from treasury stock related to employee stock-based compensation awards and employee purchase plans (Exhibit 99.2, Page 11).
- Net Share Repurchases After SBC is a notional calculation mixing cash repurchases and non-cash equity issuances: Net Share Repurchases (-$14,846M) plus Net Employee Issuance Equity Impact (+$1,132M) = -$13,714M in 9M 2026 vs. -$22,308M + $1,234M = -$21,074M in 9M 2025.
- Total Capital Returned to Common Shareholders is calculated as Common Dividends Declared ($12,533M in 9M 2026 vs. $11,969M in 9M 2025) plus Net Purchase of Treasury Stock ($14,846M in 9M 2026 vs. $22,308M in 9M 2025). Q3 2026 quarterly capital returned was $5,437M ($4,433M common dividend + $1,004M net treasury purchase).
D. Key Financial Ratios
The firm maintained strong capital and return metrics during the quarter, generating an ROE of 17% (20% for 9M 2026) and an ROTCE of 20% (21% adjusted for securities losses; 24% for 9M 2026). Standardized CET1 ended at 13.9%, down 30 basis points from 14.2% in Q2 2026 and down 90 basis points from 14.8% in Q3 2025, driven by lending growth, CIB markets activity, and OCI adjustments. The firm's liquidity profile strengthened, with the Liquidity Coverage Ratio (LCR) improving to 113% and total excess high-quality liquid assets (HQLA) rising to $288 billion.
| Metric | Q3 2026 | Q3 2025 | Change | Notes |
|---|---|---|---|---|
| Return on Common Equity (ROE) | 17% | 17% | Flat | Annualized; 9M 2026 ROE stood at 20% vs. 17% in 9M 2025 |
| Return on Tangible Common Equity (ROTCE)[1] | 20% | 20% | Flat | Non-GAAP; adjusted ROTCE was 21% excluding Corporate securities losses |
| Return on Assets (ROA) | 1.21% | 1.26% | -5 bps | Annualized; 9M 2026 ROA was 1.44% vs. 1.34% in 9M 2025 |
| Overhead Ratio (Reported) | 54% | 52% | +200 bps | Noninterest expense as a percentage of reported net revenue |
| Overhead Ratio (Managed)[2] | 54% | 52% | +200 bps | Noninterest expense as a percentage of managed net revenue; 53% adjusted |
| Effective Income Tax Rate (Reported) | 24.0% | 23.2% | +80 bps | Managed tax rate was 26.7% vs. 25.9% in Q3 2025 |
| Standardized CET1 Capital Ratio | 13.9% | 14.8% | -90 bps | Down 30 bps QoQ from 14.2%; Standardized RWA grew 12.8% YoY to $2,184B |
| Advanced CET1 Capital Ratio | 14.1% | 14.9% | -80 bps | Advanced total capital ratio remained more binding than Standardized |
| Standardized Tier 1 Capital Ratio | 14.8% | 15.8% | -100 bps | Tier 1 capital grew 5.8% YoY to $324.2B |
| Standardized Total Capital Ratio | 16.8% | 17.7% | -90 bps | Total regulatory capital reached $367.1B |
| Supplementary Leverage Ratio (SLR) | 5.5% | 5.8% | -30 bps | Flat QoQ; total leverage exposure of $5.93T |
| Firm Liquidity Coverage Ratio (LCR) | 113% | 110% | +300 bps | Up from 110% in Q2 2026; total excess HQLA rose to $288B |
| Bank Liquidity Coverage Ratio | 119% | 117% | +200 bps | Up from 118% in Q2 2026 |
| Loans-to-Deposits Ratio | 57% | 56% | +100 bps | Period-end; flat QoQ at 57% |
Footnotes
- ROTCE is a non-GAAP financial measure measuring net income applicable to common equity ($15,000M in Q3 2026 vs. $14,111M in Q3 2025) as a percentage of average tangible common equity ($299,116M in Q3 2026 vs. $283,843M in Q3 2025). Excluding the $498M after-tax net investment securities losses, Q3 2026 adjusted ROTCE was 21% (Exhibit 99.1, page 6).
- Managed Overhead Ratio is a non-GAAP financial measure calculated as total noninterest expense divided by managed net revenue. Q3 2026: $27,295M / $50,907M = 53.6% (rounded to 54%). Adjusted overhead ratio of 53% excludes $63M of legal expense ($27,232M / $50,907M = 53.5%).
E. Operational Metrics
Across core franchises, JPMorgan Chase demonstrated continued expansion in client volume and asset balances. Consumer & Community Banking average deposits rose 3.7% YoY to $1.10 trillion, supported by 650,000 net new checking account additions in the quarter. CIB Markets revenue advanced 15.4% YoY to $10.3 billion, powered by prime brokerage and equity derivatives, while Investment Banking fees grew 14.4% to $3.0 billion, retaining the #1 global wallet share ranking at 9.2% YTD. In Asset & Wealth Management, client assets reached $7.90 trillion (+15.5% YoY) and AUM reached $5.21 trillion (+13.3% YoY), propelled by $51 billion in long-term net inflows and positive market performance.
| Metric | Q3 2026 | Q3 2025 | YTD 2026 | YTD 2025 | Notes |
|---|---|---|---|---|---|
| Firmwide Net Interest Income & Margin | |||||
| Net Interest Income (Managed Basis) | $27,145M | $24,071M | $78,246M | $70,760M | Up 12.8% YoY; beats annualized pace of prior guidance |
| Net Interest Income (Excluding Markets)[1] | $24,726M | $23,391M | $71,683M | $68,734M | Up 5.7% YoY on higher deposits and card balances; offset by lower rates |
| Net Yield on Interest-Earning Assets (Managed) | 2.48% | 2.45% | 2.46% | 2.49% | Up 3 bps YoY and up 8 bps QoQ from 2.40% in Q2 2026 |
| Net Yield on Assets (Excluding Markets)[1] | 3.70% | 3.73% | 3.69% | 3.74% | Down 3 bps YoY, up 5 bps QoQ from 3.65% in Q2 2026 |
| Interest Rate Spread | 1.98% | 1.92% | 1.98% | 1.94% | Average earning asset yield of 4.86% vs. bearing liability rate of 2.88% |
| Firmwide Credit & Asset Quality | |||||
| Provision for Credit Losses | $2,743M | $3,403M | $7,765M | $9,557M | Provision declined 19.4% YoY; Wholesale provision was $663M |
| Total Net Charge-Offs (NCOs) | $2,204M | $2,593M | $6,886M | $7,335M | Down 15.0% YoY, driven by wholesale recovery/normalization |
| Net Charge-Off Rate (Total Retained Loans) | 0.59% | 0.76% | 0.64% | 0.74% | Down 17 bps YoY; wholesale retained NCO rate at 0.11% vs. 0.33% |
| Total Credit Allowance (Period-End)[2] | $31,929M | $28,804M | $31,929M | $28,804M | Includes $26.3B loan loss, $5.6B commitments, and $47M securities |
| Nonaccrual Loans (Period-End) | $9,366M | $10,106M | $9,366M | $10,106M | Down 7.3% YoY; nonaccrual loans to total loans ratio of 0.59% vs. 0.70% |
| Consumer & Community Banking (CCB) | |||||
| Average Deposits | $1,097.1B | $1,058.0B | $1,089.6B | $1,057.4B | Up 3.7% YoY; maintained #1 retail deposit market share ranking |
| Deposit Margin | 2.78% | 2.79% | 2.70% | 2.75% | Relatively stable; up 8 bps QoQ from 2.70% in Q2 2026 |
| Card Services Net Charge-Off Rate | 2.91% | 3.15% | 3.23% | 3.37% | Beat FY26 guidance (~3.2%); down 43 bps QoQ from 3.34% in Q2 2026 |
| Card Services 30+ Day Delinquency Rate | 1.97% | 2.14% | 1.97% | 2.14% | Improved 17 bps YoY; 90+ day delinquency rate at 0.96% vs. 1.07% |
| Debit & Credit Card Sales Volume | $539.5B | $492.3B | $1,562.9B | $1,428.2B | Up 9.6% YoY, reflecting solid consumer demand across gas and travel |
| Card Services Net Revenue Rate | 10.76% | 10.03% | 10.64% | 10.15% | Up 73 bps YoY and up 39 bps QoQ from 10.37% in Q2 2026 |
| Client Investment Assets (Period-End) | $1,419.8B | $1,232.4B | $1,419.8B | $1,232.4B | Up 15.2% YoY, driven by strong market performance and client inflows |
| Active Mobile Customers | 64.9M | 60.9M | 64.9M | 60.9M | Up 6.6% YoY; active digital customers reached 78.0M (+5.3%) |
| Firmwide Mortgage Origination Volume | $20.4B | $16.9B | $58.2B | $44.4B | Up 20.7% YoY; CCB originations rose 15.1% YoY to $16.0B |
| Commercial & Investment Bank (CIB) | |||||
| Total Investment Banking Fees | $3,005M | $2,627M | $9,165M | $7,388M | Up 14.4% YoY; maintained #1 global wallet share at 9.2% YTD |
| - Advisory Fees | $1,222M | $926M | $3,500M | $2,464M | Up 32.0% YoY, reflecting strong M&A completion activity |
| - Equity Underwriting Fees | $564M | $527M | $1,865M | $1,316M | Up 7.0% YoY; down 32.0% QoQ from strong Q2 ECM volume |
| - Debt Underwriting Fees | $1,219M | $1,174M | $3,800M | $3,608M | Up 3.8% YoY; down 15.1% QoQ due to late-quarter market pause |
| Total Markets Net Revenue | $10,320M | $8,944M | $33,957M | $27,543M | Up 15.4% YoY; Equities surge offset modest fixed income softness |
| - Fixed Income Markets Revenue | $5,366M | $5,613M | $18,497M | $17,152M | Down 4.4% YoY on rates and commodities; offset by currencies and EM |
| - Equity Markets Revenue | $4,954M | $3,331M | $15,460M | $10,391M | Up 48.7% YoY, driven by robust client activity in Prime and Derivatives |
| Payments Revenue | $5,620M | $4,917M | $16,039M | $14,217M | Up 14.3% YoY on deposit balances, deposit margins, and fee growth |
| Securities Services Revenue | $1,626M | $1,423M | $4,782M | $4,110M | Up 14.3% YoY on asset values and client activity |
| Assets Under Custody (Period-End) | $44,107B | $40,128B | $44,107B | $40,128B | Up 9.9% YoY; down 1.7% QoQ from $44,869B in Q2 2026 |
| Average Client Deposits (Payments & Sec. Serv.) | $1,219.0B | $1,111.1B | $1,197.3B | $1,078.7B | Up 9.7% YoY and up 1.1% QoQ; sustained institutional liquidity |
| Asset & Wealth Management (AWM) | |||||
| Assets Under Management (AUM, Period-End) | $5,210B | $4,599B | $5,210B | $4,599B | Up 13.3% YoY; crossed $5.2T milestone on positive flows and markets |
| Total Client Assets (Period-End) | $7,895B | $6,838B | $7,895B | $6,838B | Up 15.5% YoY; includes $3.94T in Private Bank and $2.45T Institutional |
| Long-Term AUM Net Inflows | $51B | $72B | $155B | $157B | Led by fixed income ($27B), multi-asset ($9B), and alternatives ($8B) |
| Total Client Asset Net Inflows | $263B | $147B | $522B | $347B | Up 78.9% YoY; includes $42B liquidity flows and institutional deposits |
| Average Loans | $301.6B | $250.7B | $284.8B | $241.8B | Up 20.3% YoY and up 6.1% QoQ, driven by private bank lending demand |
| Average Deposits | $253.5B | $241.5B | $255.8B | $244.6B | Up 5.0% YoY; down 2.5% QoQ from $260.1B in Q2 2026 |
| Pretax Margin Ratio | 36% | 36% | 36% | 35% | Asset Management margin at 35%; Global Private Bank margin at 36% |
Footnotes
- Net interest income excluding Markets and Net yield on average interest-earning assets excluding Markets are non-GAAP financial measures. Q3 2026 Managed NII of $27,145M less Markets NII of $2,419M equals NII ex-Markets of $24,726M. Average interest-earning assets ex-Markets was $2,648,046M in Q3 2026 vs. $2,491,131M in Q3 2025, yielding 3.70% annualized vs. 3.73%.
- Total credit allowance excludes an allowance for credit losses associated with certain accounts receivable in CIB of $119M at September 30, 2026, and $285M at September 30, 2025. Total allowance of $31,929M includes $26,272M for loan losses, $5,610M for lending-related commitments, and $47M for investment securities.
2. Forward-Looking Guidance
A. Guidance Summary
JPMorgan Chase updated its full-year 2026 guidance by providing fourth-quarter targets, resulting in higher implied full-year net interest income and expense projections driven by elevated franchise activity. For FY 2026, implied managed total net interest income (NII) was raised to ~$106.2 billion (from ~$105.5 billion) and NII ex-Markets was lifted to ~$97.2 billion (from ~$96.5 billion), supported by deposit growth and forward interest rate curves. Implied FY 2026 adjusted expense guidance was increased to ~$108.6 billion (up from ~$107.5 billion), reflecting higher volume- and revenue-related expenses from ongoing business outperformance and front-office investments.
Additionally, management introduced a preliminary 2027 central case for NII ex-Markets of approximately $107 billion, representing ~$5 billion in growth over the annualized fourth-quarter run rate, while reaffirming the FY 2026 Card Services net charge-off rate of ~3.2%.
| Metric | Period | Current Guidance | Prior Guidance | Change | Management Commentary |
|---|---|---|---|---|---|
| NII excluding Markets[1] | Q4 2026 | ~$25.5B | — | Introduced | Reflects continued balance sheet expansion across deposits and card loans, partially offset by rate environment impacts. |
| Total Net Interest Income (Managed)[1] | Q4 2026 | ~$28.0B | — | Introduced | Market-dependent; includes ~$2.5B implied Markets NII based on balance sheet composition and funding mix. |
| Adjusted Noninterest Expense[2] | Q4 2026 | ~$27.5B | — | Introduced | Reflects continued elevated activity levels, front-office hiring, wage inflation, and revenue-related compensation; excludes legal expense. |
| NII excluding Markets[1] | FY 2026 | ~$97.2B (implied) | ~$96.5B | Raised | Raised by ~$0.7B from Q2 2026 guidance; driven by deposit balance momentum across wholesale and consumer, card revolve growth, and forward curves. |
| Total Net Interest Income (Managed)[1] | FY 2026 | ~$106.2B (implied) | ~$105.5B | Raised | Raised by ~$0.7B from Q2 2026 guidance; reflects ~$9.0B of full-year Markets NII. |
| Adjusted Noninterest Expense[2] | FY 2026 | ~$108.6B (implied) | ~$107.5B | Raised | Raised by $1.1B from Q2 2026 guidance; reflects higher volume- and revenue-related expenses from sustained business outperformance. |
| Card Services Net Charge-Off Rate | FY 2026 | ~3.2% | ~3.2% | Maintained | Reaffirmed based on stable consumer delinquency trends and resilient labor market conditions; Q3 2026 actual was 2.91%. |
| NII excluding Markets (Central Case)[1] | FY 2027 | ~$107B | — | Introduced | Preliminary analysis indicating ~$5B expansion over annualized Q4 2026 run rate (~$102B)[3]; ~25% from forward curve rate hikes and ~75% from balance sheet growth. |
| Adjusted Noninterest Expense (Consensus Context) | FY 2027 | ~$114B (Street consensus)[4] | — | Introduced | Management noted preliminary internal expectations are "not too far" from current Street consensus of ~$114B, pending budget completion. |
| Through-the-Cycle ROTCE Target | Multi-Year | 17% | 17% | Maintained | Affirmed as the long-term through-the-cycle target versus 20% delivered in Q3 2026 (21% adjusted); current operating environment framed as exceptionally favorable. |
Footnotes
- Net interest income excluding Markets and managed net interest income are non-GAAP financial measures. Q4 2026 and FY 2026 guidance numbers are presented on a managed, fully taxable-equivalent basis.
- Adjusted expense is a non-GAAP financial measure that excludes Firmwide legal expense. YTD 2026 adjusted expense through Q3 was $81.1B, excluding $402M in legal expense.
- In Q&A, the CFO stated that annualizing the Q4 2026 NII ex-Markets guidance of ~$25.5B produces ~$102B, with the ~$107B 2027 central case reflecting approximately $5B of incremental growth.
- Not formal company guidance. The CFO cited current consensus of ~$114B during Q&A to indicate that Street models are reasonably aligned with preliminary internal planning.
B. Additional Notes & Commentary
- Markets Revenue Seasonality: Management noted that Markets revenue typically displays a normal seasonal sequential decline from Q3 to Q4, though ongoing macro and geopolitical crosscurrents may create atypical quarterly volatility.
- 2027 Rate Assumptions: The preliminary 2027 NII ex-Markets central case incorporates three policy rate hikes in the forward yield curve (one in December 2026 and two in the first half of 2027), representing approximately one-quarter of the projected $5 billion expansion over the annualized Q4 2026 run rate. Balance sheet growth and mix across deposits and credit cards account for the remaining three-quarters.
- Capital Allocation Priorities: Net share repurchases slowed to $664 million in Q3 2026 ($1.06 billion gross) as the firm prioritized organic deployment of its ~$30 billion in excess capital. Management highlighted initial capital deployment under the $1.5 trillion 10-year Security Resiliency Initiative (SRI), which surpassed $200 billion in its first year.
- Deposit Margins and Migration: Management expects consumer deposit growth to remain modest, anchored by primary account acquisition (+650,000 net new checking accounts in Q3 2026). However, the CFO cautioned that a higher interest rate trajectory could prompt incremental internal sorting into higher-beta certificates of deposit and premium liquid accounts.
- Investment Banking Pipeline Conversion: While client engagement across advisory and underwriting remains constructive globally, management reported that deal activity slowed late in the third quarter due to rate volatility. The timing of fourth-quarter realization remains dependent on market conditions and valuation alignment between buyers and sellers.
3. Operational & Strategic Developments
A. Business Performance & Operations
- Account Acquisition and Retail Deposit Share: CCB added over 650,000 net new checking accounts, accelerating from >500,000 in Q2 2026 and >400,000 in Q3 2025. This franchise growth allowed JPMorgan to retain its #1 retail deposit market share ranking for the sixth consecutive year based on FDIC data.
- Consumer Spending and Credit Outperformance: Debit and credit card sales volume climbed 10% YoY to $539.5 billion, driven by persistent demand across gas and travel categories. The Card Services net charge-off rate declined to 2.91% (down 43 bps QoQ), outperforming management's full-year expectation of ~3.2% due to labor market resilience.
- Capital Markets Momentum and Late-Quarter Moderation: CIB Markets revenue rose 15% YoY to $10.3 billion, propelled by a 49% surge in Equities across prime brokerage and derivatives that offset a 4% decline in Fixed Income. While Investment Banking fees grew 14% YoY to $3.0 billion (led by advisory up 32%), deal conversion moderated late in the quarter as bond market volatility prompted clients to pause activity.
- Asset and Wealth Management Inflows: AWM client assets expanded 15% YoY to $7.90 trillion and AUM grew 13% YoY to $5.21 trillion, bolstered by $51 billion in long-term net inflows concentrated in fixed income. Pretax margin remained stable at 36%, supported by higher average market levels and private banking loan growth.
- Commercial Lending Demand Dynamics: Core Middle Market clients maintained solid balance sheets with stable credit metrics, though management observed borrowing caution due to cumulative inflation and elevated interest rates. Conversely, corporate lending across CIB and AWM expanded rapidly, reflecting sustained institutional demand for specialized capital.
B. Strategic Initiatives
- Security Resiliency Initiative (SRI) Execution: Management deployed over $200 billion in the first year of its 10-year, $1.5 trillion commitment toward domestic and international infrastructure, energy, and semiconductor capacity. The firm mobilized specialized investment banking teams to support cross-border mandates exceeding $10 billion to $20 billion per transaction.
- Targeted Pilot of Smart Cash Solution: Following internal testing discussed in prior quarters, the firm formally launched a targeted pilot of its "smart cash" liquidity management tool in recent weeks. The initiative assesses client behavior and automated money movement to defend primary deposit relationships against emerging fintech yield-seeking tools.
- AI Model-Routing Architecture: JPMorgan advanced its internal technology framework toward an "all-of-the-above" model-agnostic architecture, deploying model routing to assign workloads across commercial, open-weight, and internally hosted models. This structure is designed to optimize development speed while actively managing escalating token expenses.
- Physical Branch and Advisor Expansion: The firm expanded its physical footprint to 5,164 branches (+146 locations YoY) and added private bank advisors, supporting its long-term objective of expanding retail market share toward 15%. Management credited this continuous investment in physical distribution for capturing primary checking relationships and driving deposit growth.
- Pivoting Capital Toward Organic Deployment: Net share repurchases slowed to $664 million (down 90% sequentially from $6.7 billion in Q2 2026; down 84% on a gross basis to $1.06 billion), reflecting a deliberate strategic pivot toward organic balance sheet deployment. Management indicated that lending and advisory opportunities generate returns well above the implied earnings yield of repurchasing shares at current valuations.
C. Risk Factors & Headwinds
- Capital Compression from RWA and OCI Marks: The Standardized CET1 ratio fell 30 bps QoQ to 13.9%, as net income generation was offset by a $52 billion RWA increase and $7.9 billion in unrealized AOCI losses on securities. RWA expansion was driven by loan growth across banking and markets alongside energy price swings and market volatility.
- Investment Securities Losses in Corporate: Corporate results included $658 million in pre-tax net investment securities losses ($498 million after-tax), resulting in a segment net loss of $455 million as portfolio repositioning absorbed higher long-term yields.
- Underwriting Deterioration Across the Industry: Management noted persistent credit loosening across competitor underwriting, citing excessive earnings add-backs, Payment-In-Kind (PIK) structures, weak covenants, and collateral priming. Consequently, JPMorgan is selectively tightening its own credit criteria to avoid chasing mispriced assets.
- AI Infrastructure Concentration Risk: The unprecedented scale of capital expenditures required for hyperscaler data center buildouts introduces prospective single-issuer concentration risks across syndicated facilities and credit revolvers. Management emphasized that it is stress testing its portfolio against potential sentiment reversals across the broader AI ecosystem.
- Disintermediation and Security Risks from External AI Agents: The emergence of consumer personal AI agents creates risks of deposit disintermediation and unauthorized credential sharing via screen scraping. The firm is actively blocking non-secure third-party access methods to protect client account security and mitigate liability transfer risks.
- Reporting and Metric Clarifications: Management updated categories within the Standardized RWA walk to improve transparency between CIB Markets activities and broader lending. Additionally, the CFO noted that reported noninterest-bearing wholesale deposit metrics remain distorted by regulatory accounting for Earnings Credit Rates (ECR), which obscures underlying corporate deposit pricing dynamics.
4. Q&A Session Key Themes
The third-quarter 2026 earnings call focused heavily on capital deployment priorities following a sharp curtailment in share repurchases, the mechanics underlying the newly introduced 2027 net interest income outlook, operational and disintermediation risks surrounding agentic artificial intelligence, and credit standards across hyperscaler financing and broader commercial lending.
-
Capital Allocation Pivot and Buyback Deceleration: Multiple analysts questioned the abrupt decline in net share repurchases to $664 million (down from ~$7 billion in prior quarters), inquiring whether this signaled caution regarding Basel III endgame finalization or macroeconomic volatility. Management dismissed capital constraints, affirming the firm retains approximately $30 billion in excess capital. The reduction was framed as an intentional decision to redeploy capital organically into higher-returning opportunities—such as the 10-year, $1.5 trillion Security Resiliency Initiative (SRI), which surpassed $200 billion in year-one deployment—rather than repurchasing equity at an earnings yield of ~6%.
-
Deconstruction of the 2027 NII Central Case and Expenses: Analysts sought clarity on the bridge from the annualized Q4 2026 run rate of ~$102 billion to the newly introduced 2027 NII ex-Markets central case of ~$107 billion, as well as cost trajectory expectations. The CFO explained that approximately 25% of the projected $5 billion expansion reflects forward yield curve expectations (incorporating three policy rate hikes through 1H 2027), while the remaining 75% stems from ongoing balance sheet expansion across deposits and card revolvers. On costs, management indicated that the current 2027 Street expense consensus of ~$114 billion aligns reasonably well with preliminary internal budget planning.
-
Technological Disruption and Agentic AI Architecture: Analysts probed the threat of personal agentic AI systems disintermediating deposits, along with the internal challenges of managing "rogue agents" and controlling token expenses. Management noted that personal agents represent the intersection of historical yield-seeking flows and fintech user-experience competition. To counter unauthorized credential access, the firm is blocking insecure screen scraping to mitigate liability transfer risks. Internally, JPMorgan is implementing a model-agnostic, model-routing architecture across commercial and open-weight models to optimize processing efficiency and constrain escalating token costs.
-
Credit Discipline and Hyperscaler Concentration Risk: Analysts queried whether the aggressive capital expenditure demands of the AI buildout could breach institutional concentration limits, alongside questions on corporate credit quality and hedge fund leverage. The CFO stated that single-issuer exposures are actively syndicated across broader capital markets. However, the firm runs stress scenarios against broad sentiment reversals across the AI theme. While corporate credit remains stable—with the wholesale reserve build driven by new lending activity rather than downgrades—management confirmed it is actively tightening underwriting criteria to avoid mispriced risk, weak covenants, and collateral priming prevalent among competitors.
-
Deposit Beta Trajectory in a Rate-Hike Regime: Analysts challenged management on whether deposit betas would accelerate if interest rates push higher. The CFO acknowledged that launching rate hikes from current levels is historically unprecedented. While franchise deposits remain barbelled between high-beta wholesale funds and low-beta consumer balances, management conceded that higher terminal rates could drive internal migration out of checking accounts into higher-yielding certificates of deposit.
-
Quantification of AI Productivity Benefits: Analysts pressed management to demonstrate where AI efficiency dividends appear in quarterly financial results. The CFO declined to provide formal savings figures, stating that ring-fencing artificial intelligence savings produces internal inefficiencies. Management affirmed that operational productivity will instead be enforced through baseline headcount constraints and software rewrite efficiencies.
-
Leadership Succession Concerns Receded: In stark contrast to Q2 2026—where questions regarding executive promotions and CEO retirement timelines dominated the Q&A—succession was entirely absent from analyst inquiries this quarter, indicating market absorption of the co-president leadership structure.
-
Shift from Wholesale Credit Incidents to Systematic Allocation: Unlike Q3 2025, which centered on idiosyncratic wholesale charge-offs and lending fraud disclosures (e.g., Tricolor), the Q3 2026 credit discussion centered on broad underwriting discipline, the underwriting of data center capacity, and hedge fund counterparty leverage.
-
Evolution of AI Discourse: The AI dialogue progressed from general use cases and preliminary tool announcements (such as the testing of the "smart cash" tool in Q2 2026) to practical operational governance, external security risks, and the newly launched live targeted pilot.
5. Strategic Themes & Inflection Points
A. Current Period Themes
- Decisive Capital Pivot from Buybacks to Organic Deployment: Management executed an intentional strategic shift away from equity repurchases toward organic balance sheet deployment, asserting that reinvesting at a through-the-cycle 17% return creates superior long-term value relative to buying stock at an earnings yield of ~6%. This marks a clear departure from the multi-billion-dollar quarterly repurchase run rate seen in prior periods, redirecting capital into major economic initiatives.
- Proactive Credit Tightening Amid Peer Loosening: In contrast to the benign loss environment and prior quarters' monitoring stance, leadership signaled an active tightening of underwriting criteria across wholesale lending facilities. Management cited a deliberate refusal to match competitor concessions regarding weak covenants, Payment-In-Kind structures, and collateral priming.
- AI Narrative Shifts to Defensive Governance and Cost Containment: The technology discussion evolved from broad productivity promises into an active defense against disintermediation and unauthorized credential access by third-party personal agents. Concurrently, internal technological deployment transitioned toward a model-agnostic routing framework specifically engineered to curb accelerating token expenses.
- Tempering Market Optimism with Conversion Sensitivity: While affirming that every line of business continues to perform exceptionally well, leadership tempered the prior quarter’s "as good as it gets" tone by highlighting a late-September deal pause caused by bond market volatility. Management framed transaction pipelines as an "accordion" that can rapidly expand or contract based on valuation alignment.
- Normalization of Leadership Governance: The total absence of analyst inquiries regarding executive succession signals that the market has absorbed the co-president structure established in Q2 2026. This stability has successfully redirected market focus back to operational execution and capital deployment.
B. Future Considerations
- Hyperscaler Financing vs. Concentration Risk Limits: The capital expenditure requirements of global artificial intelligence and data center infrastructure present significant lending opportunities alongside prospective single-issuer concentration hurdles. The firm's future risk profile will depend on its capacity to syndicate these exposures into broader capital markets without retaining outsized credit risk.
- Deposit Beta Convexity in an Extended Rate Cycle: With forward curves pricing policy rate hikes into 2027 from an already elevated baseline, historical deposit modeling faces an unprecedented test. A persistent higher-rate regime could challenge franchise margins by triggering internal migration from noninterest-bearing deposits into higher-beta savings and certificate products.
- Regulatory Finalization and Balance Sheet Optimization: With Basel III endgame and liquidity rule revisions approaching conclusion, management's advocacy shifted toward establishing operational clarity and securing intermediate discount-window recognition. Favorable regulatory recalibration could free up balance sheet capacity to support lower risk-density economic lending.
- Defending the Primary Banking Bundle Against Disintermediation: The newly launched pilot of the smart cash solution represents a crucial test of automated liquidity management designed to neutralize yield-seeking fintech tools. Future profitability will depend on defending core checking relationships without eroding deposit margins or altering retail pricing structures.
- Long-Term Compounding via the Security Resiliency Initiative: Initial momentum under the 10-year SRI framework positions the firm as a primary financier for global infrastructure, energy transition, and supply chain security. This multi-decade commitment is intended to serve as a durable, counter-cyclical growth engine across commercial and investment banking.
6. Key Items to Monitor Next Quarter
A. Prior Quarter Monitoring Review
| Prior Item | Current Status | Management Commentary |
|---|---|---|
| CEO Succession & Leadership Integration | On Track | Leadership operations proceeded without disruption following the elevation of Doug Petno and Troy Rohrbaugh to co-Presidents in Q2 2026. The topic was not raised by analysts during the Q3 2026 call, and the CEO's previously stated retirement timetable of "several years" remains unchanged. |
| Sustainability of Capital Markets Performance | Mixed Progress | Equities Markets delivered continued outperformance (revenue up 49% YoY to $5.0B) driven by prime brokerage and derivatives, while advisory fees expanded 32% YoY. However, management noted that deal conversion moderated late in September due to bond market volatility, characterizing pipeline realization as an "accordion" that can expand or contract quickly. |
| European Digital Bank Expansion | No Update | Management provided no operational or strategic updates regarding Chase UK customer growth, German expansion in Berlin, or the introduction of European credit card and investment products during the Q3 2026 call. |
| Credit Underwriting Discipline in a Competitive Market | Achieved | Management confirmed it is actively tightening credit criteria in response to competitor loosening, specifically declining facilities characterized by weak covenants, Payment-In-Kind (PIK) structures, and collateral priming. Wholesale credit quality remained sound, with credit costs driven by new volume rather than downgrades. |
| AI-Related "Token Expense" Management | On Track | Management detailed an "all-of-the-above" model-routing architecture that directs computational workloads across proprietary, open-weight, and internally hosted models to optimize cost and performance, actively controlling token expenses while maintaining software engineering velocity. |
B. Current Quarter Focus Items
| Category | Item | Timeline | What to Monitor | Why It Matters |
|---|---|---|---|---|
| Strategic | Capital Allocation and Security Resiliency Initiative (SRI) Deployment | Ongoing / Medium term | The pace of capital deployment under the 10-year, $1.5 trillion SRI commitment (which exceeded $200 billion in year one) relative to the run rate of share repurchases ($664 million net in Q3 2026 vs. ~$7 billion quarterly in 1H 2026) from the firm's ~$30 billion in excess capital. | Validates management's strategic thesis that redeploying capital organically into domestic and cross-border infrastructure, energy, and technology mandates at a through-the-cycle 17% ROTCE generates superior value compared to buying back equity at an implied earnings yield of ~6%. |
| Operational | Live Smart Cash Pilot and AI Disintermediation Defense | Q4 2026 / Ongoing | Client adoption, usage metrics, and feedback from the targeted pilot of the smart cash tool launched in early October 2026, alongside the firm's progress in blocking unauthorized credential sharing and screen scraping by third-party personal agents. | Demonstrates JPMorgan's operational capability to neutralize fintech and personal agent deposit disintermediation, defending primary consumer and business banking relationships while eliminating potential liability transfer risks. |
| Opportunity | Investment Banking Pipeline Conversion Post-Rate Volatility | Next Quarter | The re-acceleration of M&A advisory completions and debt underwriting originations in Q4 2026 following the late-September market pause, particularly the conversion pace of European IPO pipelines and cross-border corporate financing mandates. | With JPMorgan retaining the #1 global investment banking fee wallet share at 9.2% YTD, a swift resumption of deal closures would drive significant fee revenue outperformance, whereas prolonged rate uncertainty could postpone realization into 2027. |
| Risk | Wholesale Credit Discipline and AI Hyperscaler Concentration Limits | Ongoing | Track syndicated loan underwriting discipline, single-issuer exposure limits on data center construction, and the distribution of large-scale AI infrastructure revolvers into broader capital markets amid competitor covenant loosening. | Maintaining stringent underwriting criteria prevents balance sheet vulnerability to sentiment shifts across the AI ecosystem, ensuring that institutional exposures remain protected against structural weakness, excessive leverage, or collateral priming. |
| Risk | Retail Deposit Beta Trajectory and Internal Product Migration | Next Quarter / 1H 2027 | The magnitude of internal balance migration from noninterest-bearing checking accounts into high-beta CDs and premium products, stability of the CCB deposit margin (2.78% in Q3 2026), and sustained net new checking account acquisition (benchmarked against the >650,000 quarterly pace) under higher forward yield curves. | Determines the convexity of funding costs and the stability of the preliminary ~$107 billion 2027 NII ex-Markets central case, testing whether primary franchise expansion can mitigate margin compression in an extended rate-hike environment. |
Appendix: Quotes by Theme
Management Sentiment & Macroeconomic Outlook
- Cautious Preparation Over Macro Prediction: The CEO underscored that managing for potential higher rate environments is driven by disciplined risk readiness rather than economic forecasting.
"I think you have to-- we always prepare for all different events. You know? And that is not the same as predicting them because we wanna be a strong company, helping our clients, our communities, countries around the world through thick or thin. So, of course, things like that could happen. I would never take it off the table... I still kind of think that, but that is not a prediction. that is just-- think of that as cautious preparation." — James Dimon, Chairman and CEO
- Through-the-Cycle Return Target Stability: Management reaffirmed its commitment to a 17% ROTCE baseline across cycles despite operating at elevated return levels.
"I always talked about the 17% being through the cycle. Things are pretty good now with high volume, high asset prices, and fairly low credit losses and all that. So if you could earn 70% [suspected typo in transcript for 17%] consistently for a long period of time, that is a really good return for shareholders. that is our goal. I do not want to change every time, you know, something happens in the marketplace..." — James Dimon, Chairman and CEO
- Exceptional Operating Environment: Leadership noted the atypical nature of simultaneous outperformance across all divisions.
"The conditions have just been exceptionally favorable... Historically, you have tended to see a bit more internal diversification in high rate environments on business do better than others and vice versa. So the conditions that we have had recently were essentially every part of the franchise is, you know, beating records or not typical by historical standards." — Jeremy Barnum, CFO
Capital Deployment & Organic Growth Priorities
- Capital Allocation Hierarchy Favors Organic Reinvestment Over Buybacks: The CEO framed share repurchases as an investment decision subordinate to organic balance sheet deployment when valuations are high.
"The capital hierarchy has always been the same. I mean, after you pay your dividend, which hopefully will be steady, we would like-- we really like investing in organic growth. That is the highest and best use of capital for a shareholder. And obviously, buyback comes after that. Particularly when stock prices are up... We believe now, which is different than we told you in the past, that we can redeploy that capital at very good returns over time. And redeploying that capital at very good terms over time is far better than buying stock at a 6% or whatever the earnings yield would be if you bought it today." — James Dimon, Chairman and CEO
- Internal RWA Deployment Consuming Capital: The CFO linked the reduction in buybacks directly to rapid organic balance sheet deployment and capital preservation.
"During a period during which we have done a ton of internal deployment. So there is been a lot of organic growth in the RWA and some of the investments that James alludes to. And during that period, we have also done a bunch of buybacks So. But at this point, you know, we are-- as Jamie says, it, the speed with which we have been able to deploy organically relative to the amount of access we have and the environment, seems pretty clear that it makes sense to keep dry powder." — Jeremy Barnum, CFO
- Execution of the Security Resiliency Initiative: Management highlighted the global scope and rapid deployment under the SRI program.
"We have had a bunch of people who retired who raised their hand. They are coming back, you know, more for patriotism than anything else. And so it is just a great effort for the company. And as we pointed out, it is global, and the global response has also been exceptional. We have something across my desk, which is alone over $10 billion or $20 billion of financing in 1 country." — James Dimon, Chairman and CEO
Credit Underwriting & Risk Discipline
- Selective Tightening Amid Loose Market Standards: Leadership confirmed an active pushback against eroding underwriting discipline across competitor books.
"I am not gonna give you very specific stuff, but we are tightening up a little bit credit. I think some of the credit terms have got a little bit loose. And you have heard us talk about that before and other people. Know, a little too much vehicle, too weak covenants, a little too much priming good assets, all too much. Pushing on it, You know, we just feel you have to chase that kind of stuff anymore." — James Dimon, Chairman and CEO
- Managing AI Hyperscaler Financing and Portfolio Resilience: The CFO outlined the multi-layered credit analysis necessary to finance large-scale compute infrastructure without exceeding concentration limits.
"Clearly, given the nature of these structures, you have to be sophisticated about assessing both your indirect exposure or your direct exposure, you know, you sit on the capital structure, the value of the collateral... And so you really need to be running stresses that test your resilience to a meaningful change in overall thinking across the entire enterprise. And that is something that we spend a lot of time thinking about." — Jeremy Barnum, CFO
AI Architecture, Governance & Disintermediation
- Defending Primary Franchises Against Disintermediation and Rogue Agents: The CEO detailed the defensive posture required to protect customer accounts from external AI agents and non-secure access.
"Internally, we use agents to do things here, and we are going to continue to do that. And we do. We will use it for customers, but our focus would always be do a great job for customers... There is a defensive side, which is you gotta make sure our customers are not hurt by it. And so that is a-- of concern, but that is-- think of that as an AI agenda concern, which is heightened because you do not want rogue agents, and there could be thousands of them... In the meantime, we are not gonna allow just any agent to come, outside agent to come inside the company because it is just too risky for clients and for JPMorgan." — James Dimon, Chairman and CEO
- Personal Agents as an Extension of Yield-Seeking Competition: The CFO framed personal AI agents within the historical context of deposit competition.
"The bigger picture here is around. You know, there have been a couple of releases of personal agents this quarter, which have really gotten a bunch of attention in the market and saw a little bit of a response... If you think about what is the nature of the competition that comes from these agents, it is really the intersection of 2 things that we have been talking about for a long time. 1 is yield seeking flows... And our strategy remains focusing on primary bank share, not chasing every dollar of yield seeking money... The other piece is, you know, competition from fintechs for innovating and providing great customer experiences... And in that sense, the kind of agentic personal agents, whatever stuff, it is just the intersection of those 2 things, and it is not new." — Jeremy Barnum, CFO
- Model Routing and Token Cost Management: Management explained the technical and financial strategy implemented to manage AI computational costs.
"Part of the strategy is model agnosticism, harness agnosticism, and ability to run both proprietary models, but also open weight and open source models, some of which we have run on our own. So it is very much an all of the above strategy designed to get the best of what is available at the best price and control our own investment." — Jeremy Barnum, CFO
"And there are tools coming that model routing, which send it to the best, quickest, cheapest We do not need the most expensive thing for every query you have, and very often people just use the 1 they are comfortable with. So that is all coming, you know, to have that, of course, under control." — James Dimon, Chairman and CEO
Appendix: Quotes by Theme
- Capital Allocation Pivot: Organic Reinvestment vs. Share Repurchases: Management framed the sharp reduction in quarterly share repurchases to $664 million as a strategic decision to redeploy capital into higher-yielding organic growth rather than repurchasing equity at an earnings yield of ~6%.
"We believe now, which is different than we told you in the past, that we can redeploy that capital at very good returns over time. And redeploying that capital at very good terms over time is far better than buying stock at a 6% or whatever the earnings yield would be if you bought it today. And that is simple... The world needs capital. The world needs advice. The world is becoming more complex... We hope to deploy it very well for our shareholders." — Jamie Dimon, CEO
vs Q2-FY26:
"I've also never thought that I actually want to get rid of that number, money returned to shareholders. I just don't even like seeing it because buying back stock is not returning money to shareholders. You're making an investment decision... If we think we can deploy, it's very different than buying back stock... The goal is to deploy our capital at a 17% return. That is the goal." — Jamie Dimon, CEO
vs Q3-FY25:
"So as we all know, we do not love buying back the stock at these levels, but we want to keep the [capital] reasonable. And in the meantime, we are using our financial resources to lend into the real economy very broadly across the entire franchise." — Jeremy Barnum, CFO
- Macroeconomic Assessment: Transitioning from Market Exuberance to Cautious Preparation: Management shifted its qualitative framing from the peak market conditions emphasized in the prior quarter to disciplined contingency preparation for persistent inflation and higher terminal interest rates.
"I think you have to-- we always prepare for all different events. You know? And that is not the same as predicting them because we wanna be a strong company, helping our clients, our communities, countries around the world through thick or thin. So, of course, things like that could happen. I would never take it off the table... I have always thought there is a higher chance than other people. I still kind of think that, but that is not a prediction. That is just-- think of that as cautious preparation." — Jamie Dimon, CEO
vs Q2-FY26:
"It's getting close to as good as it gets. We just don't know how long it's going to last... I just think we're in a very healthy, active, exuberant market with very high prices and very high volumes, and we benefit from that. We just don't know how long it will continue." — Jamie Dimon, CEO
vs Q3-FY25:
"While not predicting a slump, we are noting as we always do that there are risks, and the fact that things are fine now does not mean they are guaranteed to be great forever." — Jeremy Barnum, CFO
- Credit Discipline: Selective Tightening Amid Industry Underwriting Deterioration: In response to loose terms across competitor syndicated facilities, leadership confirmed active tightening of internal credit standards to avoid subordinated structures and covenant erosion.
"I am not gonna give you very specific stuff, but we are tightening up a little bit credit. I think some of the credit terms have got a little bit loose. And you have heard us talk about that before and other people. Know, a little too much vehicle, too weak covenants, a little too much priming good assets, all too much pushing on it. You know, we just feel you [don't] have to chase that kind of stuff anymore [suspected omission of 'don't' in source transcript]." — Jamie Dimon, CEO
vs Q2-FY26:
"We didn't talk about a huge deterioration in credit underwriting standards. I think we talked about it as a very mild one, but it's across several spectrum, which is people assumptions on revenue growth or add back of expenses, more PIK... some weaker covenants, some people taking more rollover risk." — Jamie Dimon, CEO
vs Q3-FY25:
"I probably should not say this, but when you see one cockroach, there are probably more. And so we should everyone should be forewarned on this one... It clearly was, in my opinion, fraud involved in a bunch of these things. But that does not mean we cannot improve our procedures." — Jamie Dimon, CEO
- Technological Disruption & AI Disintermediation: Account Security and Pilot Cash Deployment: Management addressed personal AI agents as an evolution of yield-seeking and fintech competition, emphasizing strict defense against unauthorized credential sharing while highlighting the live pilot of its proprietary smart cash tool.
"Defensively, you gotta make sure our customers are not hurt by it. And so that is a concern... heightened because you do not want rogue agents, and there could be thousands of them. And so we have always been literally on the side of the client... In the meantime, we are not gonna allow just any outside agent to come inside the company because it is just too risky for clients and for JPMorgan." — Jamie Dimon, CEO
"There is obviously been a lot of focus on smart cash solution, which I think is a small piece of the overall story. But that is live now, actually, as of the last couple weeks. Very, very early days, and it remains a kind of targeted pilot type thing. But it was interesting to learn some things about what clients care about and sort of see how it works to sell a product like this in the field." — Jeremy Barnum, CFO
vs Q2-FY26:
"What you're going to see is certain tests coming out, and then you'll find out about what we can do, what we can't do, and we're going to learn a lot by doing some of that. We think it could be good for customers and good for us... You'll see something this year." — Jamie Dimon, CEO
- Technology Efficiency & AI Architecture: Model Routing to Constrain Token Costs: The firm outlined an infrastructure strategy centered on model-agnostic routing to prevent vendor lock-in, balance performance across commercial and open-weight models, and manage computational expenses.
"Our strategy is quite focused on minimizing lock in and maximizing optionality and the ability to manage costs. So part of the strategy is model agnosticism, harness agnosticism, and ability to run both proprietary models, but also open weight and open source models, some of which we have run on our own." — Jeremy Barnum, CFO
"And there are tools coming that model routing, which send it to the best, quickest, cheapest. We do not need the most expensive thing for every query you have, and very often people just use the 1 they are comfortable with. So that is all coming... to have that, of course, under control." — Jamie Dimon, CEO
vs Q2-FY26:
"One topic which is not financially meaningful this year, but which I think is interesting and may become in the future, is the question of token expense... We are forecasting some meaningful acceleration in that number for the second half of the year... The idea is use the right model for the right purpose, be smart about open source where appropriate, and ensure that you're getting value out of it ultimately." — Jeremy Barnum, CFO
- Investment Banking Pipeline: Volatility Sensitivity and the "Accordion" Effect: Management characterized deal flow realization as flexible and sensitive to valuation pauses, noting that rate volatility late in the third quarter deferred transaction closures.
"The pipeline is fine. But I pointed out many times before the pipeline is like an accordion. It can open and close pretty quick. You have seen in the United States, it is been built-- as Jeremy says, it was delayed... And I was in Europe recently, and you know, the pipeline there is actually quite healthy and even more so in IPOs than we would have thought." — Jamie Dimon, CEO
"Not surprisingly, given the rate sell off, you are going to have the market take a little bit of a breath and a pause to make sure buyers and sellers can meet on valuation terms. And so we did see a little bit of that slowdown in, you know, the second half of September, basically." — Jeremy Barnum, CFO
vs Q2-FY26:
"While this quarter's performance was supported by both some large ECM deals and the acceleration of the closure of some M&A transactions, the pipeline remains quite robust, and the current activity levels seem to be encouraging more activity. As a result, while conversion will obviously be dependent on market conditions, we expect activity levels to remain healthy." — Jeremy Barnum, CFO
- Hyperscaler Infrastructure Financing: Managing AI Concentration Risk: Management evaluated the massive capital requirements of the artificial intelligence infrastructure expansion, noting that institutional risk controls require syndication and stress testing against broad sentiment shifts.
"Clearly, single issuer concentration is the thing that is gonna get managed. And clearly, given the nature of these structures, you have to be sophisticated about assessing both your indirect exposure or your direct exposure... You really need to be running stresses that test your resilience to a meaningful change in overall thinking across the entire enterprise... Currently, our exposures are still quite modest in the context of our overall wholesale exposure, but that is not the same as saying that we would be immune to a major change in sentiment in the AI space." — Jeremy Barnum, CFO
- Deposit Betas & Balance Migration: Unprecedented Rate Trajectory Dynamics: The CFO cautioned that modeling deposit behavior in an extended rate cycle launched from current levels lacks historical precedent, warning that higher terminal rates may accelerate product migration.
"This latest rate cycle is arguably even more unprecedented than the last 1. Like, we just do not have a lot of historical data about how people behave when you see rate hikes from the launch point that we have seen this cycle... You can almost think about the franchise as pretty barbelled between a bunch of very high beta deposits, like most of wholesale, as well as CDs and premium deposit in consumer, and then a stack of very low beta deposits. And the question is probably less the pricing of any given product... and more a sort of migration behaviors across products in this cycle." — Jeremy Barnum, CFO
vs Q2-FY26:
"If you'd asked me that at the beginning of this rate cycle, I would have said that we would be experiencing that effect right now, and we're not. Just from a common sense perspective, you have to believe that at some point that kicks in... When we do our stress testing... one of the things that we look at in stress is like, okay, at what point do you have that kind of acceleration and rate paid as a result of that type of environment? That's one of the reasons why it's important not to be naïve about higher rates." — Jeremy Barnum, CFO
- Through-the-Cycle Profitability: Anchoring to the 17% ROTCE Target: Management maintained its long-term return framework, asserting that current returns of 20%+ reflect exceptionally favorable market conditions rather than a permanently altered baseline.
"I always talked about the 17% being through the cycle. Things are pretty good now with high volume, high asset prices, and fairly low credit losses and all that. So if you could earn 70% [suspected typo for 17% in source transcript] consistently for a long period of time, that is a really good return for shareholders. That is our goal. I do not want to change every time, you know, something happens in the marketplace." — Jamie Dimon, CEO
"Historically, you have tended to see a bit more internal diversification in high rate environments on business do better than others and vice versa. So the conditions that we have had recently were essentially every part of the franchise is, you know, beating records or not typical by historical standards." — Jeremy Barnum, CFO
vs Q2-FY26:
"The power of this franchise is such that we are able to aggressively invest for the future for the sake of generating future returns and to solidify the competitive position of the franchise while still delivering exceptional current returns. I think that would be true if we were delivering 15%, 16%, 17% returns. Obviously, when we're delivering these types of returns, it really is firing on all cylinders." — Jeremy Barnum, CFO
Historical Performance