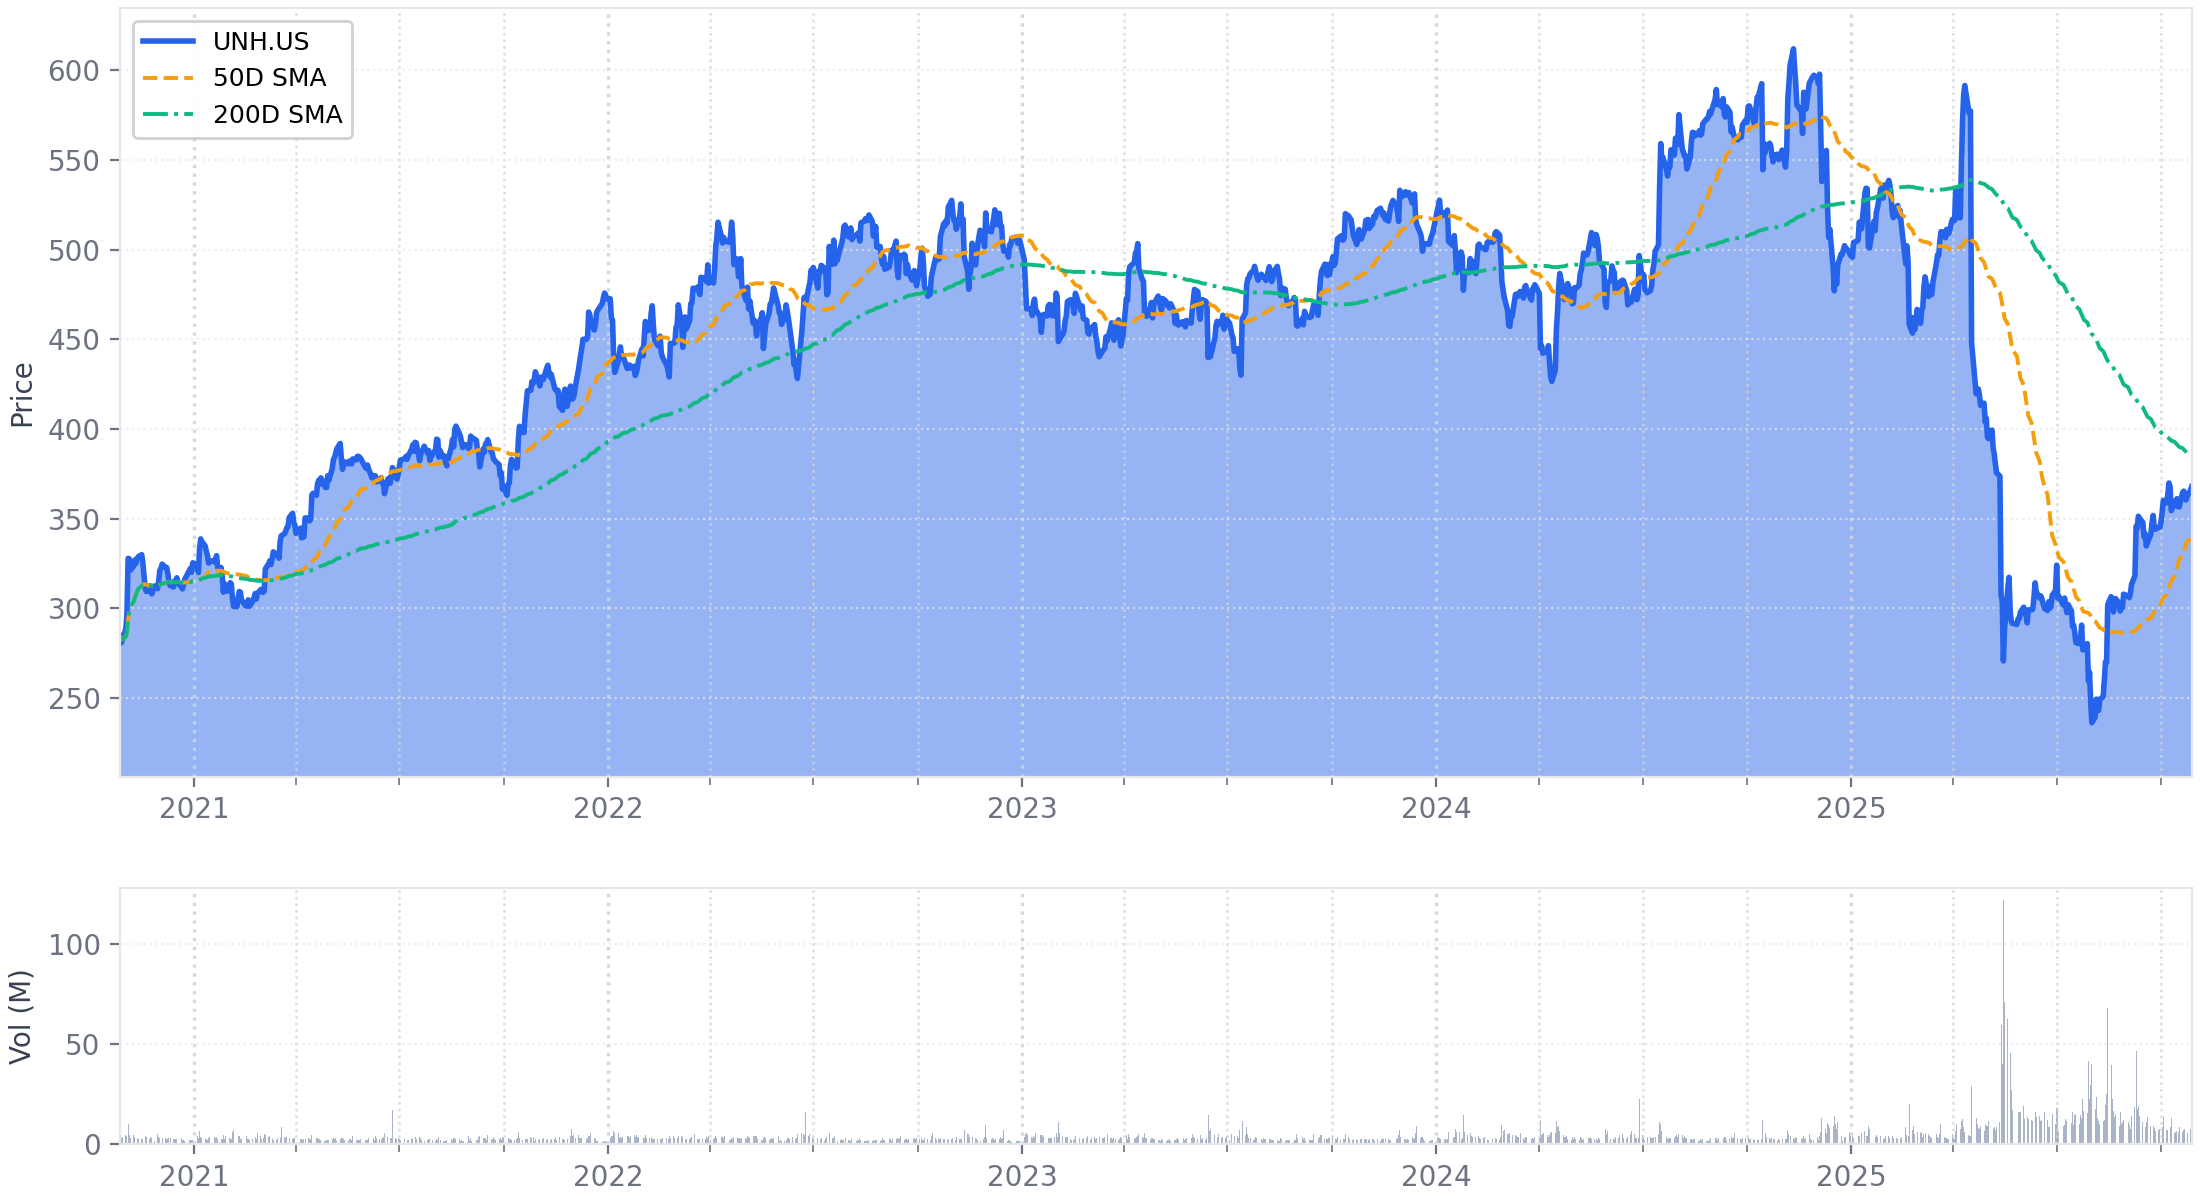
Executive Summary
UnitedHealth Group signaled early stabilization in its operational turnaround, raising its full-year 2025 adjusted EPS outlook to at least $16.25 from a previous floor of $16.00. This comes despite continued severe year-over-year earnings pressure, with Q3 adjusted EPS declining 59% driven by a consolidated Medical Care Ratio of 89.9% (+470 bps YoY) and a near-total collapse in Optum Health's operating margin to 1.0%.
Management is now executing a decisive "profitability over volume" strategy ahead of 2026. This involves a planned, strategic contraction across key business lines, headlined by an expected ~1 million member decline in Medicare Advantage. The company is also engineering a ~2/3 reduction in its ACA exchange membership through rate increases exceeding 25% and a ~10% shrinkage in Optum Health's value-based care membership to exit underperforming contracts.
The company confirmed it is comfortable with analyst consensus for 2026 as a "stepping off point," but will temper growth with investments to drive a return to double-digit growth in 2027. With a new CFO in place and share buybacks paused to prioritize deleveraging, the focus has shifted entirely to execution. The modest guidance increase suggests the initial phase of this painful but necessary reset is on track, but the execution risk of such a large, planned contraction in 2026 remains the central issue for investors.
1. Financial Performance Summary
UnitedHealth Group reported third quarter revenues of $113.2 billion, an increase of 12.3% year-over-year, driven by broad-based growth across both UnitedHealthcare and Optum. However, earnings from operations declined significantly to $4.3 billion from $8.7 billion in the prior-year period, with the operating margin contracting by 480 basis points to 3.8%. The decline was attributed to persistent, elevated medical cost trends, the ongoing impact of Medicare funding reductions, and changes to the Part D program from the Inflation Reduction Act. Adjusted EPS for the quarter was $2.92, down from $7.15 in Q3 2024.
A. Income Statement Metrics
| Metric | Q3 2025 | Q3 2024 | Change | Notes |
|---|---|---|---|---|
| Total Revenues | $113.2B | $100.8B | +12.3% ↑ | Growth driven by membership expansion and strong performance at Optum Rx. |
| UnitedHealthcare Revenues | $87.1B | $74.9B | +16.3% ↑ | Growth led by Medicare & Retirement (+24%) and Community & State (+18%). |
| Optum Revenues | $69.2B | $63.9B | +8.2% ↑ | Driven by 16% revenue growth at Optum Rx. |
| Optum Health | $25.9B | $25.9B | 0.0% | Revenues were flat year-over-year. |
| Optum Insight | $4.9B | $4.9B | -0.3% ↓ | Revenues were flat year-over-year. |
| Optum Rx | $39.7B | $34.2B | +16.0% ↑ | Growth from new clients, expansion with existing clients, and pharmacy services. |
| Earnings from Operations | $4.3B | $8.7B | -50.5% ↓ | Margin compression due to elevated medical costs and Medicare funding pressures. |
| UnitedHealthcare Op. Earnings | $1.8B | $4.2B | -57.1% ↓ | Operating margin fell to 2.1% from 5.6% in the prior year. |
| Optum Op. Earnings | $2.5B | $4.5B | -44.2% ↓ | Operating margin fell to 3.6% from 7.0% in the prior year. |
| Optum Health | $0.3B | $2.2B | -88.2% ↓ | Margin compressed to 1.0% from 8.3% due to reimbursement pressure and costs. |
| Optum Insight | $0.7B | $0.8B | -10.7% ↓ | Margin of 14.4% reflects investments to support future growth. |
| Optum Rx | $1.5B | $1.5B | +0.3% ↑ | Margin declined to 3.9% from 4.5% due to the mix-effects of higher cost drugs. |
| Net Earnings (attributable to UNH) | $2.3B | $6.1B | -61.2% ↓ | |
| Diluted EPS (GAAP) | $2.59 | $6.51 | -60.2% ↓ | |
| Adjusted EPS | $2.92 | $7.15 | -59.2% ↓ |
B. Balance Sheet Highlights
The company's debt-to-capital ratio remained stable sequentially at 44.1%, inclusive of the Amedisys acquisition which closed in the quarter. Medical costs payable increased by $5.9 billion since year-end 2024, reflecting business growth and medical cost trends.
| Metric | Sep 30, 2025 | Dec 31, 2024 | Change |
|---|---|---|---|
| Cash and Short-term Investments | $30.6B | $29.1B | +$1.5B |
| Medical Costs Payable | $40.2B | $34.2B | +$5.9B |
| Total Debt[1] | $80.1B | $76.9B | +$3.2B |
| Net Debt[2] | $49.5B | $47.8B | +$1.7B |
| Shareholders' Equity | $101.6B | $98.3B | +$3.3B |
Footnotes
- Total Debt is a calculated metric = Short-term borrowings and current maturities of long-term debt ($7.7B) + Long-term debt, less current maturities ($72.4B).
- Net Debt is a calculated metric = Total Debt ($80.1B) - Cash and Short-term Investments ($30.6B).
C. Cash Flow Analysis
For the nine months ended September 30, 2025, cash flow from operations was $18.6 billion, or 1.5 times net earnings. The company returned $11.5 billion to shareholders through dividends and share repurchases year-to-date.
| Metric (Nine Months Ended) | Sep 30, 2025 | Sep 30, 2024 | Change |
|---|---|---|---|
| Cash Flow from Operations | $18.6B | $21.8B | -14.9% ↓ |
| Capital Expenditures | ($2.7B) | ($2.6B) | +3.4% ↑ |
| Free Cash Flow[1] | $15.9B | $19.2B | -17.4% ↓ |
| Dividends Paid | ($5.9B) | ($5.6B) | +5.6% ↑ |
| Share Repurchases | ($5.5B) | ($4.0B) | +37.5% ↑ |
Footnotes
- Free Cash Flow is a calculated metric = Cash Flow from Operations - Purchases of property, equipment and capitalized software.
D. Key Financial Ratios
| Metric | Q3 2025 | Q2 2025 | Notes |
|---|---|---|---|
| Debt-to-Capital Ratio | 44.1% | 44.1% | Remained stable sequentially, absorbing the impact of the Amedisys acquisition. Management targets a ratio of ~40% by the second half of 2026. |
E. Operational Metrics
The consolidated Medical Care Ratio (MCR) was 89.9%, a 470 basis point increase year-over-year, reflecting high medical cost trends. Total domestic medical membership grew by 795,000 year-over-year to 50.1 million, led by growth in Medicare Advantage.
| Metric | Q3 2025 | Q2 2025 | Q3 2024 | Notes |
|---|---|---|---|---|
| Medical Care Ratio (MCR) | 89.9% | 89.4% | 85.2%[1] | 470 bps YoY increase driven by elevated cost trends, Medicare funding reductions, and IRA Part D impacts. In line with Q2 guidance. |
| Operating Cost Ratio | 13.5% | 12.3% | 13.2% | Increase reflects investments in technology and people, including over $450M in employee incentives and foundation contributions. |
| Days Claims Payable (DCP) | 46.2 days | 44.5 days | 47.4 days | Increased 1.7 days sequentially. |
| Optum Insight Contract Backlog | $32.1B | $32.1B | $32.8B | Stable sequentially. |
| People Served - Total Medical (thousands) | 50,125 | 50,115 | 49,330 | Grew by 795,000 year-over-year. |
| Commercial | 29,930 | 29,970 | 29,730 | Grew by 200,000 YoY, driven by self-funded offerings. |
| Medicare Advantage | 8,435 | 8,350 | 7,810 | Grew by 625,000 year-over-year. |
| Medicaid | 7,460 | 7,490 | 7,450 | Grew by 10,000 year-over-year. |
| Optum Rx Quarterly Adj. Scripts | 414M | 414M | 407M | Grew 1.7% year-over-year. |
Footnotes
- Q3 2024 MCR of 85.2% sourced from the Q3 2025 transcript. The Q3 2025 filing indicates a 470 basis point YoY increase from an unstated base.
2. Forward-Looking Guidance
Management raised its full-year 2025 guidance and provided a preliminary outlook for 2026, signaling a return to "solid growth" following a transitional 2025. The company is comfortable with analyst consensus for 2026 as a "stepping off point" but noted that investments in Optum Health and Optum Insight may temper 2026 growth to position the company for "higher and sustainable double-digit growth beginning in 2027."
A. Guidance Summary
| Metric | Period | Current Guidance | Prior Guidance (Q2 2025) | Change | Management Commentary |
|---|---|---|---|---|---|
| Adjusted EPS | FY 2025 | At least $16.25 | At least $16.00 | Raised | The outlook was raised to reflect steady execution on the company's improvement plans. |
| Net Earnings per Share (GAAP) | FY 2025 | At least $14.90 | At least $14.65 | Raised | Follows the revision in adjusted earnings guidance. |
| Cash Flow from Operations | FY 2025 | ~$16.0B | ~$16.0B | Maintained | Expected to be approximately 1.1x net income. |
| 2026 Earnings Outlook | FY 2026 | Comfortable with current analyst consensus | "Solid but moderate earnings growth" | Refined | Management views consensus as a "likely stepping off point." Formal guidance will be issued in January 2026. |
| Long-Term EPS Growth | 2027+ | "Higher and sustainable double-digit growth" | "Pacing back to low double-digit ranges" | Reiterated | Investments in 2026 are intended to accelerate growth in 2027 and beyond. |
| Capital Deployment | 2H 2026 | Potential reinstatement of buybacks & M&A | Assessment of capital priorities | Timeline Clarified | Resumption is dependent on the debt-to-capital ratio trending closer to the 40% target in the second half of 2026. |
B. Additional Notes & Commentary
-
2026 Headwinds:
- V28 Impact: The final year of the V28 risk model transition represents a more than $6 billion headwind to the enterprise.
- Investments: Continued investment is required in Optum Health and Optum Insight to accelerate future returns.
- Tax Rate: The effective tax rate is expected to return to a more normalized level.
- Investment Income: Expected to move lower as interest rates decline.
-
2026 Tailwinds:
- Repricing: Repricing efforts are expected to be a catalyst for earnings growth, particularly in the Commercial and Medicare businesses.
- Optum Stability: A measured return to growth is expected in Optum entities.
- Debt Reduction: The company will be paying down debt and reducing interest expense.
-
Business Segment Outlook for 2026:
- Medicare Advantage: Expects a membership contraction of approximately 1 million due to benefit adjustments, plan exits, and network reductions aimed at improving margins. The goal is to reach the upper half of the 2%-4% target margin range in 2027.
- Commercial: Margin recovery is expected in 2026, though still projected to be ~150 basis points below the low end of the 7%-9% target range. A return to the target range is anticipated in 2027.
- ACA Exchanges: Expects an enrollment reduction of approximately two-thirds due to average rate increases of over 25% and service area reductions.
- Medicaid: The path to recovery is challenging due to a mismatch between state funding and cost trends. Margins are expected to decline further in 2026, which is viewed as the trough period, before returning to a ~2% margin over an 18-24 month period.
- Optum Health: Expects margin improvement in 2026, with acceleration in 2027 towards the long-term target of 6%-8%. Total value-based care membership is expected to shrink by approximately 10% in 2026 before returning to growth in 2027.
-
Portfolio Rationalization:
- Management is evaluating the company's businesses and expects to complete the assessment in Q4 2025.
- Preliminary work suggests a potential non-GAAP, substantially non-cash, low single-digit billion-dollar charge.
3. Operational & Strategic Developments
Following the significant operational reset in Q2, management's focus in Q3 shifted to executing its turnaround plan. The narrative centered on stabilizing performance, implementing aggressive repricing and network actions for 2026, and refocusing the enterprise on core operational discipline. While medical cost trends remain elevated, they are now tracking in line with the revised expectations set in the prior quarter.
A. Business Performance & Operations
Management is taking decisive actions across its insurance products to restore profitability, based on its diagnosis of current market and performance issues.
-
Medicare Advantage (MA):
- Current Trends: The full-year 2025 MA trend is forecast at ~7.5%, consistent with Q2 guidance. Medicare Supplement trends remain higher, at over 11%.
- 2026 Pricing Actions: Pricing for 2026 assumes a 10% medical cost trend, reflecting continued elevated care activity, fee schedule changes, and aggressive provider coding. Actions include benefit adjustments, targeted plan exits, and network reductions.
-
Commercial & ACA:
- Commercial Pricing: Approximately 60% of the group commercial insured book has been priced for 2026, reflecting the elevated cost levels seen in 2025.
- ACA Repositioning: The company has filed for average rate increases of over 25% in its ACA exchange business and is enacting service area reductions where sustainable rates cannot be achieved.
-
Medicaid:
- Performance Diagnosis: Management noted that states have not funded in line with actual cost trends, creating a mismatch between rate adequacy and member acuity that will likely extend through 2026.
-
Optum Health:
- Performance Diagnosis: Management identified three critical issues that caused the value-based care (VBC) model to stray from its original intent: the provider network grew too large, rapid expansion led to operating inconsistencies, and the business accepted risk in products (like PPOs) less suited for the VBC model.
- Current Margins: Optum Health is expected to end 2025 with margins just under 3%, with the VBC-specific margin at under 1%.
- Corrective Actions: The company is exiting lower-performing PPO contracts (200,000 lives finalized for 2026) and is ~90% complete with 2026 VBC payer contract negotiations, which are on track to offset approximately half of the 2026 V28 headwind.
B. Strategic Initiatives
The company is executing a broad strategic realignment focused on returning to core principles, rationalizing its portfolio, and investing in technology.
- Enterprise-Wide "Back to Basics" Mandate: The core theme is a return to "fundamental execution discipline" and a renewed focus on the company’s mission and culture.
- Optum Health VBC Turnaround: The strategy is centered on three pillars: returning to the original clinical framework, moving to a narrower and more integrated network, and focusing on appropriate managed benefit products.
- Portfolio Rationalization: A comprehensive review of the company’s businesses is underway, to be completed in Q4 2025. Key actions underway include:
- Reducing the international footprint to focus on U.S. healthcare needs.
- Consolidating Optum Health locations and refining its geographic market footprint.
- Realigning Optum Financial Services within the Optum Insight platform.
- Technology and Innovation: The company is aggressively scaling AI and machine learning capabilities. At Optum Insight, investments are being made to evolve traditional services into an "AI-first" model, highlighted by recent launches like Optum Real (real-time claims platform) and Optum Integrity One (AI auto-coding tool).
C. Risk Factors & Headwinds
- Financial Health Indicators:
- Capital Deployment Pause: The company has paused share buybacks and strategic acquisitions to prioritize deleveraging. The debt-to-capital ratio held stable at 44.1%, and management aims to bring it closer to 40% in the second half of 2026.
- Pending Restructuring Charge: The upcoming non-cash charge related to portfolio rationalization introduces a notable accounting event.
- Operational Challenges:
- Persistent Headwinds for 2026: Management reiterated significant headwinds for 2026, including the final year of the V28 risk model transition (>$6B impact), ongoing Medicare cuts, and Medicaid funding pressures.
- Aggressive Provider Behavior: The company continues to see "aggressive provider coding and billing practices" and is taking network and payment integrity actions to counter this trend.
4. Q&A Session Key Themes
The Q&A session shifted from the crisis-management tone of the prior quarter to a detailed examination of the company's execution plan for 2026. Analysts focused on understanding the specific mechanics of the strategic retrenchment, the drivers of the multi-year margin recovery, and the credibility of the turnaround narrative at Optum Health.
A. Analyst Focus Areas
- Optum Health Turnaround: This remained the central theme, evolving from "what went wrong?" in Q2 to "how, specifically, are you fixing it?" in Q3. Analysts sought to quantify revenue streams, understand the scope of portfolio rationalization, and clarify the drivers of V28 headwind mitigation.
- Medicare Advantage Contraction: New questions focused on the precise drivers of the planned 1 million member decline.
- Optum Insight's AI Strategy: Analysts probed the investment case and competitive positioning for Optum Insight’s new AI-driven platforms.
- Provider Behavior: The impact of aggressive provider coding on medical trends was a key area of inquiry.
- Management's Tone: Management provided a high level of detail on its strategic actions, framing its planned membership contractions as a necessary and disciplined pivot to prioritize profitability over volume.
B. Key Challenges & Concerns
The primary challenge from analysts was a persistent push for quantification and greater precision, reflecting a healthy skepticism following the major Q2 guidance miss.
- Demand for Granularity: Analysts repeatedly asked management to provide specific data points, such as a detailed revenue breakdown of Optum Health’s sub-businesses and a quantified split of the turnaround drivers.
- Validating the Turnaround: By demanding this data, analysts implicitly challenged management to prove that the new operational rigor is in place and that the recovery plan is based on credible, measurable actions.
- Execution Risks: The significant, planned membership contractions across multiple business lines represent a major execution risk. Trading market share for higher margins requires careful execution to avoid permanent damage to the franchise.
5. Strategic Themes & Inflection Points
The third quarter marks a transition from the crisis-driven "reform" agenda of Q2 to a phase of disciplined execution. The narrative has shifted from diagnosing widespread failures to detailing the specific, often painful, actions being taken to stabilize the business and rebuild profitability.
A. Current Period Themes
- Dominant Narrative: Profitability Over Volume: The central theme is a decisive strategic pivot to prioritize margin recovery over membership growth. This is being executed through aggressive repricing, network narrowing, and planned market/product exits across Medicare Advantage, ACA, and Optum’s value-based care segments.
- Operational Focus: A Return to "Fundamental Discipline": The company is implementing a "back to basics" approach, refocusing on core execution. The pause on M&A and share buybacks to focus on deleveraging underscores this disciplined capital allocation strategy.
- Changes in Messaging: The discussion has moved from broad statements about a "cultural shift" to concrete, quantified actions. The vague "portfolio actions" mentioned in Q2 have now been clarified with the announcement of a pending restructuring charge and specific rationalization plans.
B. Future Considerations
- Emerging Opportunities: A Refocused Optum & AI-Driven Insight: While the near-term involves retrenchment, management is positioning a leaner, more focused Optum Health as the foundation for more sustainable long-term growth. Concurrently, significant investment is being directed toward Optum Insight to transform it into an "AI-first" platform.
- External Environment: Navigating Persistent Headwinds: The external landscape remains challenging, with significant headwinds for 2026 including the final year of the V28 risk model transition (>$6B impact), ongoing Medicare funding cuts, and inadequate Medicaid state funding.
- Transformation Initiatives: Enterprise Simplification: The planned portfolio rationalization represents a significant strategic transformation, simplifying the company's structure to concentrate resources on the core U.S. healthcare market.
6. Key Items to Monitor Next Quarter
A. Prior Quarter Monitoring Review
| Prior Item | Current Status | Management Commentary |
|---|---|---|
| MA Membership Impact of 2026 Repricing & Exits | On Track | The company provided a more specific forecast, now expecting a total MA membership contraction of approximately 1 million in 2026, up from the "over 600,000" guided in Q2. |
| Execution of the Optum Health Turnaround | On Track | Management detailed its three-pillar turnaround plan and is on track to offset about half of the 2026 V28 headwind via payer contracting. |
| VBC Patient Cohort Margin Progression | No Update | Management did not provide a specific update on the margin trajectory of the 2024-2025 patient cohorts. |
| Traction in "Underinvested" Growth Areas (Optum Insight & AI) | On Track | Management highlighted significant progress, citing the launch and early traction of new AI-first products with stated productivity gains and ROI. |
| Independent Reviews & Regulatory Engagement | No Update | The topic was not discussed on the call. |
B. Current Quarter Focus Items
| Category | Item | Timeline | What to Monitor | Why It Matters |
|---|---|---|---|---|
| Strategic | Execution of Portfolio Rationalization | Q4 2025 / Q1 2026 | - Details and confirmation of the low single-digit billion-dollar, non-cash charge. - Specifics on which international markets are being exited and the scope of Optum Health location consolidation. |
The size and nature of the charge will quantify the financial impact of the new leadership’s strategic reset and define the company’s refined focus on the core U.S. market. |
| Operational | Medicare Advantage Membership Attrition | Q1 2026 | - Actual MA membership results post-AEP versus the company’s projection of a ~1 million member decline. - The mix of attrition between planned exits, group MA pricing pressure, and individual MA dislocation. |
This is the first major test of the company’s "margin over volume" strategy. Executing a controlled, strategic contraction is critical to setting a stable earnings baseline for 2026. |
| Risk | Medicaid Rate Adequacy | Ongoing | - Commentary on progress in rate negotiations with states. - Any signs that the rate-acuity mismatch is stabilizing or worsening. - Confirmation from management that 2026 is indeed the "trough" year for Medicaid margins. |
Medicaid is a significant headwind with negative margins expected in 2026. A slower-than-expected recovery in state funding could prolong the earnings drag and impact the 2027+ growth plan. |
| Opportunity | Market Adoption of Optum’s AI-First Products | Ongoing | - Evidence of new customer wins and revenue contribution from platforms like Optum Real and Optum Integrity One. - Any quantification of the financial impact or market share gains. |
Demonstrating commercial traction beyond early pilots is crucial to validating the investment in high-margin technology and its ability to drive future, diversified earnings growth. |
| Operational | Capital Deployment Resumption | 2H 2026 | - Progress on lowering the debt-to-capital ratio from 44.1% towards the ~40% target. - Any commentary firming up the timeline for reinstating share buybacks and strategic M&A. |
The resumption of share buybacks is a key component of the company’s historical EPS growth algorithm and would signal that the financial stabilization plan is working. |
Appendix: Quotes by Theme
-
A Shift in Tone from Crisis Management to Confident Execution: Management's narrative evolved from acknowledging widespread "mistakes" in Q2 to confidently articulating a clear, multi-faceted execution plan in Q3, signaling a transition from diagnosis to implementation.
"Our enterprise continues to advance on the improvement paths first discussed with you in July. We've been introducing new leaders, strengthening underperforming businesses... We're getting at the core of the underperformance issues with fresh perspectives, intent on positioning our organization as a positive and innovative leader..." — Stephen Hemsley, CEO
vs Q2-FY25:
"Beyond the environmental factors that are affecting the entire sector, and more specifically to us, we've made pricing and operational mistakes as well as others. They are getting the needed attention... As we continue to assess the state of our businesses, it is very apparent that some require fundamental reorientation." — Stephen Hensley, CEO
-
Optum Health's "Back to Basics" Mandate: A More Precise Diagnosis: After identifying "self-inflicted" issues in Q2, management in Q3 provided a specific diagnosis for Optum Health's underperformance, framing the turnaround as a disciplined return to the original, more focused value-based care (VBC) model.
"Over the last few years, through a period of rapid expansion, Optum Health's strategy around value-based care strayed from the initial intent of the model. 3 critical issues emerged. First, the provider network grew too large; second, the rapid pace of expansion and slower pace of integration resulted in operating inconsistencies... And lastly, Optum Health was accepting risk in products and services less suited for a clinically oriented value-based model." — Patrick Conway, CEO of Optum
vs Q2-FY25:
"We know we have real and self-inflicted executional challenges and we bear the responsibility to get this right... A large part of the mythic localized management approach, which we are addressing with urgency." — Patrick Conway, CEO of Optum
-
Strategic Contraction for Profitability: Quantifying the Pivot: The strategy of prioritizing margin over volume, introduced in Q2, was detailed with specific and significant membership reduction targets for 2026, confirming a major strategic pivot.
"As a result of our planned actions as well as competitive market dynamics, we expect membership contraction of approximately 1 million members in total Medicare Advantage... we are enacting targeted service area reductions. We believe these actions will establish a sustainable premium base while likely reducing our ACA enrollment by approximately 2/3." — Timothy Noel, CEO of UnitedHealthcare
vs Q2-FY25:
"we have made the difficult decision to exit plans that currently serve over six hundred thousand members, primarily in less managed products such as PPO offerings." — Tim Noel, CEO of UnitedHealthcare
-
2026 Outlook: Setting a Clearer Path to Recovery: Management provided more confident and specific framing for the 2026 outlook, moving from a general expectation of "moderate growth" in Q2 to endorsing analyst consensus as a credible starting point, while clearly signaling 2027 as the target for accelerated growth.
"While we are still finalizing 2026 plans... current analyst consensus captures a likely stepping off point for next year. We intend to balance our earnings growth ambitions in 2026 with investments and actions that will drive higher and sustainable double-digit growth beginning in 2027 and advancing from there." — Stephen Hemsley, CEO
vs Q2-FY25:
"Looking to 2026 at this distance, I would expect solid but moderate earnings growth. As we look further ahead we see our earnings growth outlook strengthening quickly in 2027 and pacing steadily upward..." — Stephen Hemsley, CEO
-
Portfolio Rationalization Takes Shape: The vague discussion of pausing divestitures in Q2 evolved into a concrete plan for strategic restructuring, including international exits and a quantifiable, albeit preliminary, financial impact.
"We are dedicating our energies to serving U.S. health care needs and we'll be reducing our footprint in international markets... For Optum Health, we are consolidating locations and completing plans addressing the geographic markets... At this stage, our preliminary work would imply a non-GAAP substantially noncash low single-digit billion-dollar charge." — Stephen Hemsley, CEO
vs Q2-FY25:
"The company pursued kind of a re-evaluation of the portfolio... And as I came in and looked at that, my orientation is to pursue more of the performance of the business portfolio that we have... we stopped that entire activity... and that has been withdrawn completely." — Stephen Hensley, CEO
-
Aggressive Provider Behavior Remains a Persistent Headwind: Management reiterated concerns about intense provider coding and billing practices, providing more specific examples and signaling that this remains a key driver of medical cost trends that the company is actively working to combat.
"I'm also seeing more services being attached to ER visits and hospital visits, an increase in the number of specialists that are rounding per inpatient stays and then a bias towards some higher DRG weighting than we've seen in the past... We will be taking some network actions where we need you to keep health care affordable." — Timothy Noel, CEO of UnitedHealthcare (in Q&A)
vs Q2-FY25:
"There has been a marked increase in health care cost due in part to increases in service intensity per encounter. For example, in Medicare Advantage, higher frequency of physician rounding, testing, and related services of specialist and in ER settings, are contributing to elevated outpatient spend." — Tim Noel, CEO of UnitedHealthcare
-
AI Investment Thesis: From Aspiration to Tangible Products: The strategic priority of investing in AI, mentioned in Q2, was substantiated in Q3 with the announcement of specific new products and claims of significant productivity gains and ROI, demonstrating tangible progress.
"it's clear that our traditional services in Optum Insight have to evolve to AI-first services, then to products and eventually to platforms... We launched Optum Real... the first real-time platform for claims... We recently launched Optum Integrity One... for ambulatory outpatient claims coding, this showed 73% productivity over prevailing solutions... the average return on investment for any provider system investing in Crimson AI has been 13:1." — Sandeep Dadlani, CEO of Optum Insight (in Q&A)
vs Q2-FY25:
"I think our AI agenda, Sandeep, has gotten real traction on that agenda, and I intend to accelerate it. To really infuse this entire enterprise with an AI-first orientation." — Stephen Hensley, CEO
Historical Performance