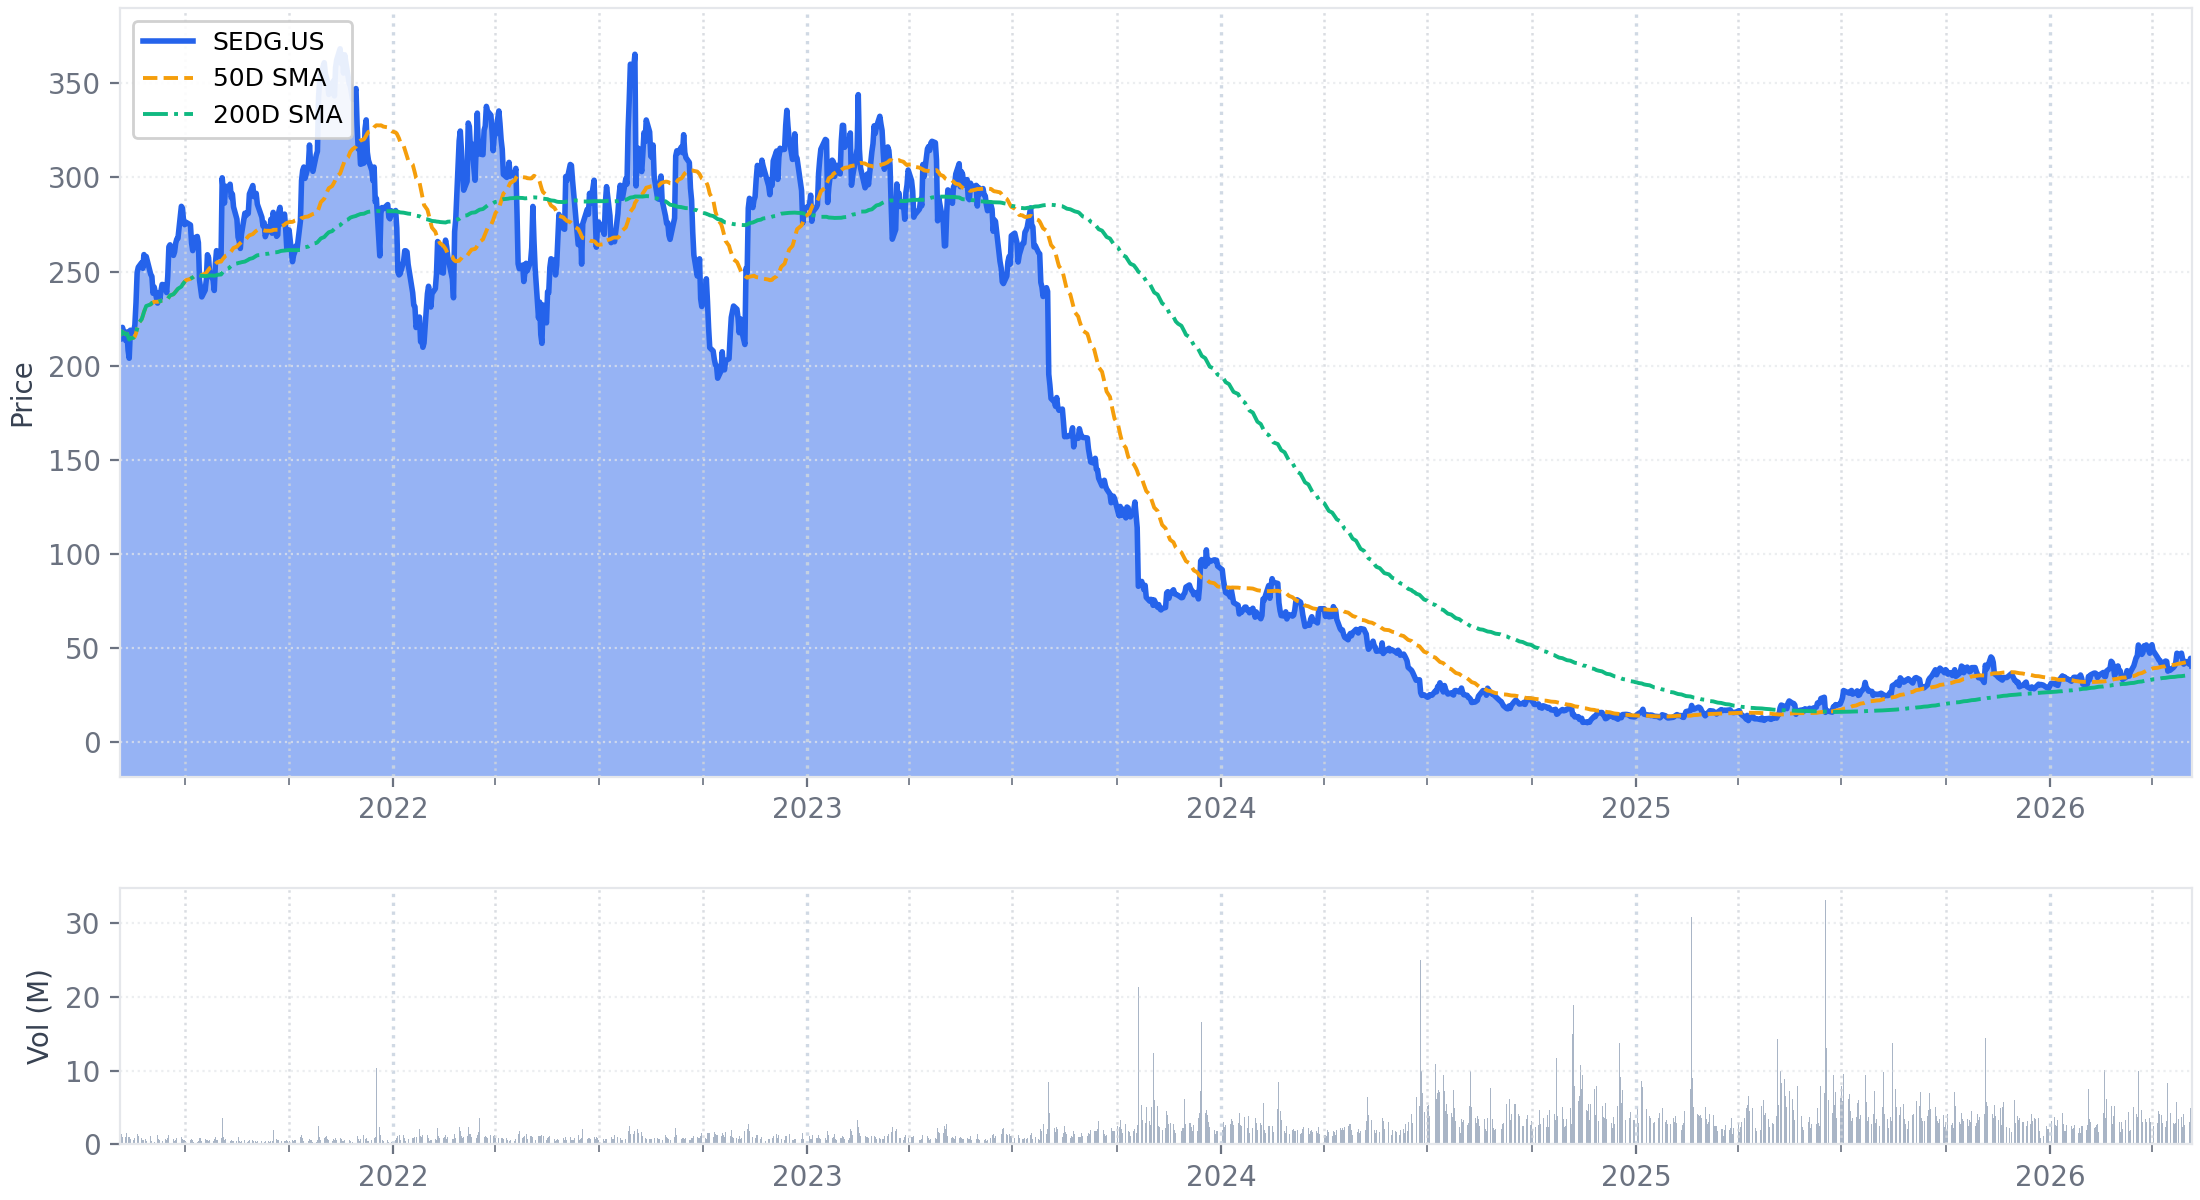
Executive Summary
SolarEdge reported Non-GAAP revenue of $310.0 million, up 46% year-over-year, and achieved its sixth consecutive quarter of non-GAAP gross margin expansion to 23.5%. The company guided for Q2 results that imply a near-breakeven Non-GAAP operating profit, a key milestone in its turnaround.
Performance was driven by a strong rebound in Europe, where revenue hit its highest point since late 2023, fueled by strong battery demand and the successful launch of the Nexis platform—with its entire Q2 production fully booked. This strength, along with continued momentum in U.S. C&I, helped offset significant headwinds in the U.S. residential market. The U.S. channel weakness materialized as the company recorded a one-time $14 million doubtful debt expense for a customer facing financial challenges. Separately, management detailed its net zero balance sheet exposure to the Freedom Forever bankruptcy, a result of a conservative accounting approach over the prior 18 months.
The results demonstrate the company's execution on its strategic plan, with the European recovery providing a critical offset to U.S. market instability. While the path to profitability is clear, the financial health of the U.S. installer base has emerged as the most significant near-term risk to monitor.
1. Financial Performance Summary
A. Income Statement Metrics
SolarEdge reported Non-GAAP revenue of $310.0 million, a 46.1% increase year-over-year, which landed within the company's prior guidance. The company achieved its sixth consecutive quarter of non-GAAP gross margin expansion, reporting 23.5%, which was at the high end of its guided range. A one-time doubtful debt expense of $14 million caused the company to miss its Non-GAAP operating expense guidance; however, excluding this item, operating expenses were below the guided range.
| Metric (USD, millions) | Q1 2026 | Q1 2025 | Change | Notes |
|---|---|---|---|---|
| GAAP Revenue | $310.5 | $219.5 | +41.5% ↑ | — |
| Non-GAAP Revenue | $310.0 | $212.1 | +46.1% ↑ | Within guidance of $290M - $320M. Growth of 46% YoY was highlighted by management. |
| - United States | $150.0 | N/A | N/A | Represents 48.4% of Non-GAAP revenue. |
| - Europe | $114.0 | N/A | N/A | Represents 36.8% of Non-GAAP revenue. |
| - International Markets | $38.0 | N/A | N/A | Represents 12.3% of Non-GAAP revenue. |
| GAAP Gross Profit (Loss) | $68.3 | $17.5 | +289.5% ↑ | GAAP Gross Margin: 22.0% vs. 8.0% in Q1 2025. |
| Non-GAAP Gross Profit (Loss) | $73.0 | $16.6 | +339.8% ↑ | Non-GAAP Gross Margin: 23.5% vs. 7.8% in Q1 2025. This was at the high end of guidance of 20% - 24%. |
| GAAP Operating Loss | ($55.0) | ($102.7) | -46.4% ↓ | GAAP Operating Margin: (17.7)% vs. (46.8)% in Q1 2025. |
| Non-GAAP Operating Loss[1] | ($24.8) | ($72.4) | -65.8% ↓ | Non-GAAP Operating Margin: (8.0)% vs. (34.2)% in Q1 2025. |
| GAAP Net Loss | ($57.4) | ($98.5) | -41.8% ↓ | GAAP Net Margin: (18.5)% vs. (44.9)% in Q1 2025. |
| Non-GAAP Net Loss[2] | ($26.3) | ($66.1) | -60.2% ↓ | Non-GAAP Net Margin: (8.5)% vs. (31.2)% in Q1 2025. |
| GAAP Diluted EPS (Loss) | ($0.95) | ($1.70) | -44.1% ↓ | — |
| Non-GAAP Diluted EPS (Loss)[3] | ($0.43) | ($1.14) | -62.3% ↓ | — |
Source: All data sourced from the company's Q1 2026 earnings filing (Exhibit 99.1). Revenue breakdown by geography from the Q1 2026 transcript. Prior year data is from the current period's filing for consistency. Note: The sum of geographic revenues reported in the transcript ($302M) does not reconcile with the total Non-GAAP revenue ($310M). The percentages shown are calculated based on the reported total Non-GAAP revenue.
Footnotes
- Non-GAAP Operating Loss reconciliation: GAAP Operating Loss of ($55.0M) excludes adjustments totaling $30.2M (55.0% of GAAP value). Key adjustments include stock-based compensation ($19.9M), loss from asset sales ($8.3M), amortization of acquired assets ($0.6M), and restructuring charges ($0.6M). Non-GAAP Operating Expenses of $97.7M missed guidance of $86M-$91M, but management noted this was due to a one-time $14M doubtful debt expense. Excluding this item, OpEx would have been ~$84M, below the guided range.
- Non-GAAP Net Loss reconciliation: GAAP Net Loss of ($57.4M) excludes adjustments totaling $31.1M (54.2% of GAAP value). In addition to the operating adjustments, this includes non-cash interest expense ($4.8M) and other financial adjustments.
- Non-GAAP Diluted EPS (Loss) reconciliation: GAAP Diluted EPS of ($0.95) excludes net adjustments of $0.52 per share (54.7% of GAAP value), primarily related to the items listed above.
B. Balance Sheet Highlights
The company maintained a strong liquidity position, ending the quarter with $582.6 million in cash and investments. The net cash position, as defined by management, increased slightly to $246.2 million. A notable increase in inventory was attributed to raw material procurement for the upcoming Nexis platform launch and higher battery demand, while a decrease in accounts receivable was driven by strong collections.
| Metric (USD, millions) | Mar 31, 2026 | Dec 31, 2025 | Change | Notes |
|---|---|---|---|---|
| Cash, Equivalents, Restricted Cash & Marketable Securities[1] | $582.6 | $577.9 | +0.8% ↑ | Includes $41.0M in restricted cash. |
| Total Debt[2] | $350.3 | $350.1 | +0.1% ↑ | Consists primarily of convertible senior notes. |
| Net Cash Position[3] | $246.2 | $244.2 | +0.8% ↑ | Management-provided figure, defined as cash and investments portfolio, net of debt. |
| Accounts Receivable, net | $222.7 | $267.4 | -16.7% ↓ | Decrease attributed to strong collections during the quarter. |
| Inventories, net | $596.8 | $552.6 | +8.0% ↑ | Increased by $44.2M, primarily for the Nexis launch and battery demand. |
| Property, Plant & Equipment, net | $265.0 | $269.4 | -1.6% ↓ | A material asset representing 11.7% of total assets. |
| Trade Payables | $404.5 | $272.0 | +48.7% ↑ | — |
| Warranty Obligations[4] | $321.8 | $357.9 | -10.1% ↓ | A material liability, representing 17.5% of total liabilities. |
| Deferred Revenues & Customer Advances[5] | $352.5 | $363.7 | -3.1% ↓ | A material liability, representing 19.1% of total liabilities. |
| Shareholders' Equity | $410.7 | $427.5 | -3.9% ↓ | Decrease driven by the net loss in the quarter. |
Source: Data sourced from the company's Q1 2026 earnings filing.
Footnotes
- Calculated from filing data (in thousands): Cash and cash equivalents ($512,381) + Restricted cash ($40,985) + Marketable securities ($29,269) = $582,635k.
- Total Debt is the sum of Convertible senior notes, net ($331,944k) and Finance lease liabilities ($18,323k).
- Management-provided figure from the press release.
- Warranty Obligations is the sum of current ($83,685k) and long-term ($238,129k) obligations.
- Deferred Revenues & Customer Advances is the sum of current ($38,540k) and long-term ($313,949k) balances.
C. Cash Flow Analysis
SolarEdge generated $20.7 million in free cash flow during the quarter, marking a positive start to the year. Management expects to generate positive cash flow for the full year 2026, despite planned investments in working capital and higher CapEx.
| Metric (USD, thousands) | 3M 2026 | 3M 2025 | Notes |
|---|---|---|---|
| Share-Based Compensation | $19,852 | $31,426 | A material non-cash expense, representing 81.3% of operating cash flow. |
| Operating Cash Flow (OCF) | $24,428 | $33,823 | — |
| Capital Expenditures | ($3,701) | ($10,109) | — |
| Free Cash Flow (Non-GAAP)[1] | $20,727 | $19,847 | Management expects to generate positive free cash flow for the full year 2026. |
| Share Issuances (Net)[2] | $2,363 | ($328) | Net issuance from stock-based awards. |
| Debt Repayments (Net) | $0 | ($5,093) | No net debt repayment or issuance activity in the quarter. |
Source: All data sourced from the company's Q1 2026 earnings filing.
Footnotes
- Free Cash Flow is a non-GAAP, management-defined metric sourced from the filing's reconciliation table, calculated as Operating Cash Flow minus Capital Expenditures and cash flow from discontinued operations. Q1 2026: $24,428k - $3,701k = $20,727k. Q1 2025: $33,823k - $10,109k - $3,867k = $19,847k.
- Net Share Issuances for Q1 2026 is calculated from cash flow from financing activities: Issuance of common stock ($3,850k) less tax withholding for stock awards (-$1,487k) = $2,363k.
D. Key Financial Ratios
Working capital metrics reflect a dynamic quarter with strong collections (lower DSO), increased raw material procurement ahead of a product launch (higher DIO), and extended payables.
| Metric | Q1 2026 | Q4 2025 | Change | Notes |
|---|---|---|---|---|
| Days Sales Outstanding (DSO)[1] | 64.6 days | 72.1 days | -7.5 days | Improvement driven by strong collections. |
| Days Inventory Outstanding (DIO)[1] | 221.6 days | 167.3 days | +54.3 days | Increase attributed to raw material purchases for Nexis launch. |
| Days Payable Outstanding (DPO)[1] | 150.3 days | 82.2 days | +68.1 days | Significant extension of payment terms. |
Footnotes
- All ratios are calculated using quarterly GAAP revenue and cost of revenues for the respective periods, multiplied by 90 days.
E. Operational Metrics
The company provided unit counts for key products where revenue was recognized during the quarter. Shipments of batteries increased sequentially, while inverters and optimizers saw a decrease from the prior quarter.
| Metric | Q1 2026 | Q4 2025 | Q1 2025 | Notes |
|---|---|---|---|---|
| Inverters Recognized as Revenue | 50.5 thousand | 98.8 thousand | — | New disclosure metric started in Q4 2025. |
| Optimizers Recognized as Revenue | 2.4 million | 2.87 million | — | New disclosure metric started in Q4 2025. |
| Batteries Recognized as Revenue | 331 MWh | 280 MWh | — | New disclosure metric started in Q4 2025. |
Source: All data sourced from the company's Q1 2026 and Q4 2025 earnings filings.
2. Forward-Looking Guidance
A. Guidance Summary
SolarEdge provided Q2 2026 guidance that projects sequential revenue growth and non-GAAP gross margin expansion. At the midpoint, the guidance implies a near-breakeven Non-GAAP operating result, a significant milestone in the company's turnaround plan. Management also provided full-year expectations for CapEx and reaffirmed its goal of achieving positive free cash flow for 2026.
| Metric | Period | Current Guidance | Prior Guidance | Change | Management Commentary |
|---|---|---|---|---|---|
| Revenue | Q2 2026 | $325M – $355M | N/A | Introduced | The range does not include any significant one-time pull-forward of revenue. |
| Non-GAAP Gross Margin | Q2 2026 | 23.0% – 27.0% | N/A | Introduced | The range does not include any potential impact from IEEPA tariff refunds, which could total approximately $55 million. |
| Non-GAAP Operating Expenses | Q2 2026 | $86M – $91M | N/A | Introduced | The midpoint reflects a modest sequential increase from Q1's ongoing OpEx of $84M, driven primarily by the strengthening of the New Israeli Shekel. |
| Non-GAAP Operating Profit (Loss) | Q2 2026 | ~$3.5M Loss (Implied) | N/A | Introduced | At the midpoint of revenue and expense guidance, the implied result brings the company "close to breakeven", a step towards profitable growth. |
| Free Cash Flow | FY 2026 | Positive | Positive (from Q4 call) | Reaffirmed | Expected to be positive for the full year despite higher CapEx and planned investments in working capital to support growth. |
| Capital Expenditures | FY 2026 | $60M – $80M | N/A | Introduced | Key investments include increased U.S. production capacity (PV and batteries), R&D facilities, and the AI data center offering. |
Source: Q2 2026 Guidance from the Q1 2026 earnings transcript and filing. Prior guidance status reflects that this is the first time specific Q2 2026 or FY 2026 CapEx guidance has been provided.
B. Additional Notes & Commentary
-
Long-Term & Strategic Timelines:
- AI Data Center Opportunity: The company's development timeline remains on track. Management plans to deliver a working system in 2026, conduct initial pilot installations in 2027, and execute a broader market rollout in 2028.
- Investor Day: Management announced plans to host an Investor Day after Labor Day, where a longer-term strategic view will be provided.
-
Qualitative Outlook & Market Trends:
- Management did not provide guidance beyond Q2 but noted that they see an opportunity for continued growth in Q3, supported by market share momentum and the rollouts of the Nexis platform and the new C&I battery solution.
- The company expects to secure additional "physical work test" safe harbor transactions in Q2, which are not reflected as pull-forward revenue but provide future revenue visibility for up to four years.
3. Operational & Strategic Developments
A. Business Performance & Operations
-
Geographic Performance & Market Conditions:
- United States (Slowing Resi, Strong C&I): The U.S. residential market experienced a slow start to the year, which management attributed to uncertainty around tax credit policies and FEOC regulations that have tightened tax equity funding for TPOs, creating "strain on installer businesses." In contrast, the U.S. C&I segment continues to show momentum, with management highlighting what they view as a "structural rather than cyclical" market share advantage due to their domestic content and FEOC-compliant products.
- Europe (Rebounding): After a slow January and February, the European market picked up significantly in March and April, a trend management links to rising regional electricity prices. This rebound drove European revenue to its highest point since Q4 2023, primarily fueled by strong demand for both residential and commercial batteries. This recovery occurred before the full rollout of the Nexis platform or the ramp-up of exports from the U.S.
-
Product & Innovation Updates:
- Nexis Platform Launch: The official launch event for the Nexis platform in Germany reportedly "exceeded expectations," with strong installer enthusiasm. Demand appears robust, as management stated that the entire planned Q2 production of Nexis is fully booked by European customers. The platform is also expected to open up new market segments, such as larger homes in Germany, which account for over 50% of the residential market there.
- New Commercial Battery: The company unveiled its second-generation commercial battery, the CSS outdoor 197 kilowatt-hour solution. This system is designed for medium-to-large scale installations and can be deployed as a standalone asset or paired with PV. Management emphasized its advanced software suite, which enables multiple energy optimization modes.
-
Pricing and Channel Inventory:
- Management stated that they have not implemented price cuts, believing the value proposition of their products, particularly Nexis, can support a premium over competitors.
- Channel inventory in Europe is considered to have resumed normal levels, with the recent pickup in sales further improving the days-of-inventory metric. Management expects the transition to the "single SKU" concept with Nexis will allow distributors to carry less inventory while fulfilling the same or greater level of sales.
B. Strategic Initiatives
Management reiterated the strategic pivot from "defense to offense" that was introduced last quarter, with 2026 framed as a "year of transformation and acceleration."
-
Market Share Expansion & Visibility:
- The company continues to secure "physical work test" safe harbor transactions with both residential and C&I customers. Management noted these deals increase future revenue visibility for up to four years, create entry points for incremental sales (e.g., batteries, EV chargers), and allow for more efficient operational planning. This strategy remains consistent with the prior quarter.
-
Growth Investment: AI Data Center Power Solutions:
- The company continues to advance its solid-state transformer platform, making progress toward a system capable of converting 34.5 kilovolts directly to 800-volt DC with over 99% efficiency.
- Management highlighted that NVIDIA featured a live 800-volt DC power rack from the company at its GTC26 conference, reinforcing the viability of the technology.
- The development timeline remains consistent with prior commentary: a working system is planned for 2026, initial pilot installations in 2027, and a broader rollout in 2028.
-
U.S. Manufacturing & Exports:
- The onshoring of manufacturing is largely complete, with facilities in Florida, Texas, and Utah fully ramped. Management stated that more than 90% of its inverter and optimizer production is now U.S.-based.
- The company has continued exporting U.S.-made products to Europe and Asia, a key strategic initiative from the prior quarter aimed at improving the cost structure and margin profile of international sales.
C. Risk Factors & Headwinds
-
Customer Financial Health (New & Materialized Risk):
- Doubtful Debt Expense: The company recorded a one-time doubtful debt expense of approximately $14 million related to a single U.S. customer described as experiencing "financial operational challenges." Management stated they took a conservative approach and have written down the entire amount owed.
- Freedom Forever Bankruptcy: Management disclosed its exposure to the bankruptcy of Freedom Forever, a long-standing partner.
- Crucially, the company stated it has net zero exposure on its balance sheet. Over the past 18 months, a cautious accounting approach was taken where payments received were first applied to reduce outstanding balances, and any remaining amount owed was fully offset by a deferred revenue liability.
- SolarEdge holds a UCC lien against Freedom's assets for approximately $100 million, but management expressed uncertainty about what amount, if any, will be recovered. Any recovery would be recognized as a benefit in the period received.
-
Operational Challenges:
- U.S. Residential Market Strain (Persistent & Worsening): The financial distress of two significant U.S. customers provides concrete evidence of the market headwinds management described. The slowdown in tax equity funding for TPOs appears to be a primary driver of this strain, representing a more acute challenge than discussed in the prior quarter.
- Potential Tariff Refunds (Uncertainty): Management noted a U.S. Supreme Court ruling that could lead to tariff refunds totaling approximately $55 million. However, these potential refunds are not included in Q2 guidance, and the timing and certainty of receipt remain unclear.
D. Management Changes
- CFO Transition: The company announced that CFO Asaf Alperovitz will continue in his role through June 9, 2026. A search for his successor is described as "well underway with strong candidates," and management expects no disruption to its 2026 plans or financial discipline.
4. Q&A Session Key Themes
A. Analyst Focus Areas
The Q&A session was dominated by concerns over the financial health of the U.S. installer base, a significant shift from the prior quarter's focus on long-term growth initiatives like AI data centers. Analysts persistently sought clarity on the company's exposure to specific customer bankruptcies and the broader market stress.
- U.S. Customer Financial Health (New, Dominant Focus): This was the most pressing topic, triggered by the Freedom Forever bankruptcy and the company's disclosure of a separate $14 million doubtful debt expense. Analysts repeatedly probed for details regarding the $100 million UCC lien against Freedom Forever and the identity of the customer related to the $14 million doubtful debt charge.
- European Market Dynamics (Recurring Theme): Following management's positive commentary, analysts sought real-time color on the European recovery, its sustainability, and its primary drivers. Management attributed the rebound to rising electricity prices, which increased demand for both PV and storage solutions across several countries.
- U.S. Competitive Landscape & Safe Harbor (Recurring Theme): This topic persisted from the prior quarter. Analysts questioned the durability of the company's U.S. C&I market share gains and sought to understand its differentiated "physical work test" safe harbor strategy compared to peers.
- Margin Implications of Geographic Mix: An analyst questioned the impact on margins as the European business strengthens. Management confirmed that the U.S. residential segment has the highest margin profile but identified two key tailwinds expected to improve European margins over time: the export of lower-cost U.S.-made products and the introduction of the cost-advantaged Nexis platform.
B. Key Challenges & Concerns
The primary concern evident throughout the Q&A was the stability of SolarEdge's U.S. customer base and the potential for further contagion from the slowdown in tax equity financing.
- Challenge on U.S. Customer Viability: Analysts directly challenged management on the breadth of financial stress in the U.S. market, connecting the Freedom Forever bankruptcy with the new $14 million doubtful debt charge to question if the situation was worsening. The tone of the questions suggested concern that these two events might be indicative of a broader, systemic issue.
- Management's Response: Management sought to reassure investors by highlighting their proactive credit management and conservative accounting. They acknowledged the market-wide "strain on installer businesses" but positioned SolarEdge as being well-managed from an exposure standpoint. They emphasized that underlying homeowner demand for solar and storage remains intact.
- Skepticism on Freedom Forever Lien Recovery: An analyst explicitly noted that the lien against Freedom Forever "may be in dispute," challenging the ultimate value of the $100 million claim.
- Management's Response: Management effectively de-risked the issue by repeatedly stating they have net zero exposure on their books and are "certainly not relying" on any recovery from the lien for their outlook. This was a direct attempt to frame the lien as a potential, but not expected, future gain.
5. Strategic Themes & Inflection Points
A. Current Period Themes
- Dominant Narrative: Executing the Transformation Amid Headwinds: The "defense to offense" narrative introduced last quarter continues, but its context has shifted. The focus is now on executing the transformation plan—driving toward profitability, gaining share, and launching new products—while simultaneously navigating a materialized risk in the U.S. residential channel. A secondary, more urgent narrative of proactive risk management has emerged, with management highlighting its successful insulation from the Freedom Forever bankruptcy as proof of its financial discipline.
- Operational Focus: Bifurcated Between Growth and Risk Mitigation: The company's operational priorities are split between two fronts:
- Offensive Execution: Driving the commercial launch of the Nexis platform in Europe, capitalizing on a "structural" advantage in the U.S. C&I market, and advancing the long-term AI data center initiative.
- Defensive Prudence: Actively managing credit exposure and navigating the financial instability within its U.S. residential installer base, a new and immediate challenge.
- Changes in Tone and Messaging: Compared to the prior quarter's confident, forward-looking pivot, the tone in Q1 was more balanced and cautious. While optimism remains for Europe, C&I, and new products, the Q&A session was dominated by discussions of risk, credit controls, and customer financial health.
B. Future Considerations
- Emerging Opportunities: Nexis as a Near-Term Catalyst: While the AI data center initiative remains the key long-term growth story, the successful launch of Nexis represents the most significant near-term opportunity. Management is positioning it not just as a product refresh but as a tool to gain share and enter new segments where it previously had a weaker offering.
- External Environment: U.S. Installer Strain is the Key Headwind: The most critical external factor is the tightening of tax equity financing for TPOs in the U.S., which is creating significant financial stress for installers and represents a major headwind for the residential segment. This contrasts with the tailwind of rising electricity prices in Europe, which is fueling a market rebound.
- Transformation Initiatives: Strategy Unchanged, Path More Complex: The four core pillars of the company’s transformation (profitable growth, share gains, scaling Nexis, investing in AI) remain consistent. However, the path to achieving these goals is now more complex. The onshoring initiative is now largely complete (>90% of inverter/optimizer production in the U.S.), shifting from a transformation-in-progress to a strategic asset.
6. Key Items to Monitor Next Quarter
A. Prior Quarter Monitoring Review
The company demonstrated tangible progress on all key items identified in the prior quarter, successfully launching its Nexis platform with strong initial demand and remaining on track with its strategic initiatives in AI data centers, U.S. manufacturing, and its goal of reaching operating profitability.
| Prior Item | Current Status | Management Commentary |
|---|---|---|
| AI Data Center Solid-State Transformer (SST) Initiative | On Track | Management reaffirmed the timeline for a working system in 2026, pilot installations in 2027, and a broader rollout in 2028. They noted progress on the platform's development and highlighted that NVIDIA featured their power rack at a recent conference, reinforcing the technology's viability. |
| Nexis Platform Commercial Launch & Adoption | Achieved | The launch event in Germany reportedly "exceeded expectations." Management stated that the entire planned Q2 production is fully booked by European customers, indicating strong initial demand and successful commercial execution. |
| U.S. Manufacturing for Export Impact | On Track | The company confirmed that over 90% of its inverter and optimizer production is now U.S.-based. It has continued exporting these products to Europe and Asia, a key strategy intended to generate better margins on international sales. |
| Execution on Path to EBIT Profitability | On Track | Management provided Q2 guidance that implies a Non-GAAP operating loss of approximately $3.5 million at the midpoint, which they described as being "close to breakeven" and a "meaningful step" towards achieving their goal of profitable growth in 2026. |
| U.S. Market Share Performance | On Track | Management reiterated their belief in continued share gains. In U.S. C&I, they framed their advantage as "structural rather than cyclical" due to their domestic content and FEOC-compliant offerings. In U.S. residential, they believe they are well-positioned for an eventual market rebound. |
B. Current Quarter Focus Items
For the upcoming quarters, the primary focus shifts to navigating the materialized credit risk within the U.S. installer channel while capitalizing on the strong recovery and new product momentum in Europe.
| Category | Item | Timeline | What to Monitor | Why It Matters |
|---|---|---|---|---|
| Risk | U.S. Installer Channel Financial Health | Ongoing | Any further disclosures of bad debt expenses, changes in credit provisions, or a material increase in DSO. Commentary on the health of TPO partners and the availability of tax equity financing. | The financial distress of two key U.S. customers has emerged as a significant risk. Further deterioration could disrupt U.S. revenue, increase credit losses, and signal a deeper-than-expected downturn in the residential market. |
| Opportunity | European Market Recovery and Nexis Sales Velocity | Next Quarter | Whether the strong demand trend from March/April continues through Q2. Commentary on the Nexis order book for Q3 and beyond, and initial feedback on its ability to penetrate new segments like larger homes. | A sustained European recovery, amplified by a successful Nexis launch, could provide a significant offset to the current weakness in the U.S. residential market, driving revenue growth and improving geographic diversification. |
| Strategic | "Physical Work Test" Safe Harbor Execution | Next Quarter / Ongoing | Announcements of new safe harbor agreements, particularly with large TPO or enterprise C&I customers. Commentary on the size and duration of the secured revenue backlog. | These deals provide multi-year revenue visibility and lock in market share without pulling forward near-term revenue. Success here validates the company's differentiated go-to-market strategy and de-risks future growth targets. |
| Operational | U.S. C&I Market Share Momentum | Ongoing | Third-party market share data for U.S. C&I. Commentary on the win rate with enterprise accounts and any competitive responses to SolarEdge's domestic content/FEOC compliance advantage. | The U.S. C&I segment is a critical and stable growth driver. Validating that the market share advantage is indeed "structural" would support a more durable long-term growth profile and provide a buffer against residential market volatility. |
| Opportunity | IEEPA Tariff Refund Realization | "Medium term" | Any updates on the timing and certainty of receiving the potential $55 million in tariff refunds. Confirmation of receipt in financial statements. | This represents a material, non-operational cash inflow that is not included in guidance. Realization of this refund would significantly bolster the company's cash position and provide additional flexibility for strategic investments. |
Appendix: Quotes by Theme
-
Strategic Pivot: Executing the "Offense" Amidst Market Transformation: Management reaffirmed the strategic shift introduced last quarter, framing 2026 as a year of execution on its offensive strategy, with a clear focus on transformation and acceleration.
"Last quarter, I spoke about SolarEdge shifting from defense to offense with 2026 being a year of transformation and acceleration for the company. Our priorities are clear: driving towards profitable growth, expanding global market share, scaling SolarEdge Nexis and investing in high-growth adjacencies such as AI data center power." — Yehoshua Nir, CEO
- vs Q4-FY25:
"2025 was just the first step in our turnaround journey. It was about defense, restoring discipline, generating strong free cash flow, rebuilding margins. 2026 is about shifting to offense while keeping this discipline intact... I believe 2026 will be a transformational year for SolarEdge." — Yehoshua Nir, CEO
-
Materialized Risk: Proactively Managing U.S. Installer Financial Distress: For the first time, management detailed significant financial strain in its U.S. channel, highlighting a proactive and conservative accounting approach that insulated its balance sheet from the Freedom Forever bankruptcy.
"On our exposure to the bankruptcy of Freedom Forever... We have a net 0 exposure on our balance sheet as we have not recognized significant revenue from Freedom over the course of the last 18 months... remaining amount owed to us has been fully offset by a deferred revenue liability... We hold the UCC lien against Freedom's assets... for approximately $100 million. We do not know what, if any, the amount will be recovered." — Asaf Alperovitz, CFO
"This OpEx reduction is largely reflective of our ongoing cost control... However, excluding a onetime doubtful debt expense of approximately $14 million... This doubtful debt is related to one of our U.S. customers, but not to Freedom Forever." — Asaf Alperovitz, CFO
-
Market Inflection Point: Strong European Rebound Contrasts with U.S. Weakness: Management's commentary on Europe marked a significant positive inflection point, shifting from "sluggish" in the prior quarter to a strong recovery driven by rising electricity prices, providing a crucial offset to U.S. residential headwinds.
"The market [Europe] was slow in the first 2 months of the year, but picked up in March, a trend that continued into April... we delivered a strong first quarter in Europe with revenue reaching its highest point since Q4 2023. The revenue growth is a result of stronger battery demand in both resi and C&I across the region." — Yehoshua Nir, CEO
- vs Q4-FY25:
"At the same time, the E.U. market remains sluggish and could even go down this year. So, I would say it will be an interplay between a weak market, a new product rollout, you know, market share expansion efforts." — Asaf Alperovitz, CFO
-
U.S. C&I Advantage: Messaging Shifts from "Advantage" to "Structural Position": The company reinforced its belief in its unique competitive position in U.S. C&I, upgrading its language from a significant "advantage" to a more durable "structural" position that it expects to support market share over multiple quarters.
"We view this position as structural rather than cyclical. Domestic content and FEOC compliance are difficult for non-U.S. competitors to replicate quickly. And we expect this continue to support our market share over multiple quarters." — Yehoshua Nir, CEO
- vs Q4-FY25:
"Out of the three leading manufacturers in this market, we are the only ones whose products are designed to be both domestic content and FEOC compliant, which should provide a significant advantage to our customers." — Yehoshua Nir, CEO
-
Nexis Platform Launch: Transitioning from Anticipation to Commercial Validation: The narrative around the Nexis platform evolved from a planned launch to a successfully executed event with tangible commercial results, including a fully booked Q2 production run.
"The SolarEdge Nexis launch event in Germany exceeded our expectations... Their enthusiasm wasn't just polite applause, it was genuine excitement... The excitement is already reflected in the order book. Our entire planned Q2 Nexis production is fully booked by European customers." — Yehoshua Nir, CEO
- vs Q4-FY25:
"I am very pleased to say that we are on schedule for the launch of our Nexis platform, with an exciting launch event in Germany on March 19. Our first customers have told us that this is the best SolarEdge product ever." — Yehoshua Nir, CEO
-
Path to Profitability: Approaching a Key Milestone: Management provided a tangible update on its goal to reach profitability, signaling that it is on the cusp of achieving breakeven operating profit, a key milestone in its turnaround plan.
"At the midpoint of our guidance, we expect to approach breakeven operating profit in the second quarter. This marks an important milestone in our transformation and reflects the relentless focus our entire team has had on operational efficiency." — Yehoshua Nir, CEO
- vs Q4-FY25:
"If these trends continue, we would be on target to achieve EBIT profitability later this year." — Yehoshua Nir, CEO
-
AI Data Center Opportunity: Timeline and Strategy Remain Consistent: Management's long-term vision and development timeline for the AI data center opportunity remain unchanged, reinforcing its strategic importance and the company's disciplined, multi-year approach.
"Our plan is to deliver a working system in 2026, initial pilot installations in 2027 and a broader roll out in 2028." — Yehoshua Nir, CEO
- vs Q4-FY25:
"we do not expect any revenue before 2027, and the industry is expecting the ramp up to actually start in 2028." — Yehoshua Nir, CEO
-
Analyst Concern Shift: Focus Moves from Long-Term Strategy to Near-Term Credit Risk: The Q&A session revealed a sharp pivot in analyst focus. While the prior quarter was dominated by inquiries into the long-term AI opportunity, this quarter's questions centered almost entirely on the immediate and tangible risk of customer financial health in the U.S.
"What do you have a lien on with respect to those credit facilities? In the first day of the hearing, it seems like these liens are or may be in dispute... Can you give us a little more color on who that might be and what the situation is there [with the $14 million expense]?" — Philip Shen, Analyst
"I was wondering how much stress are you seeing in the U.S. market? We have one bankruptcy announced and one doubtful expense... Are you seeing the situation get worse?" — Vikram Bagri, Analyst
- vs Q4-FY25 Analyst Focus (From Prior Report):
"AI Data Center Opportunity (New, Dominant Focus): This was the most prominent topic. Analysts probed for details on the timeline, customer qualification cycles, manufacturing plans, and competitive positioning." — Prior Period Analysis Summary
Historical Performance