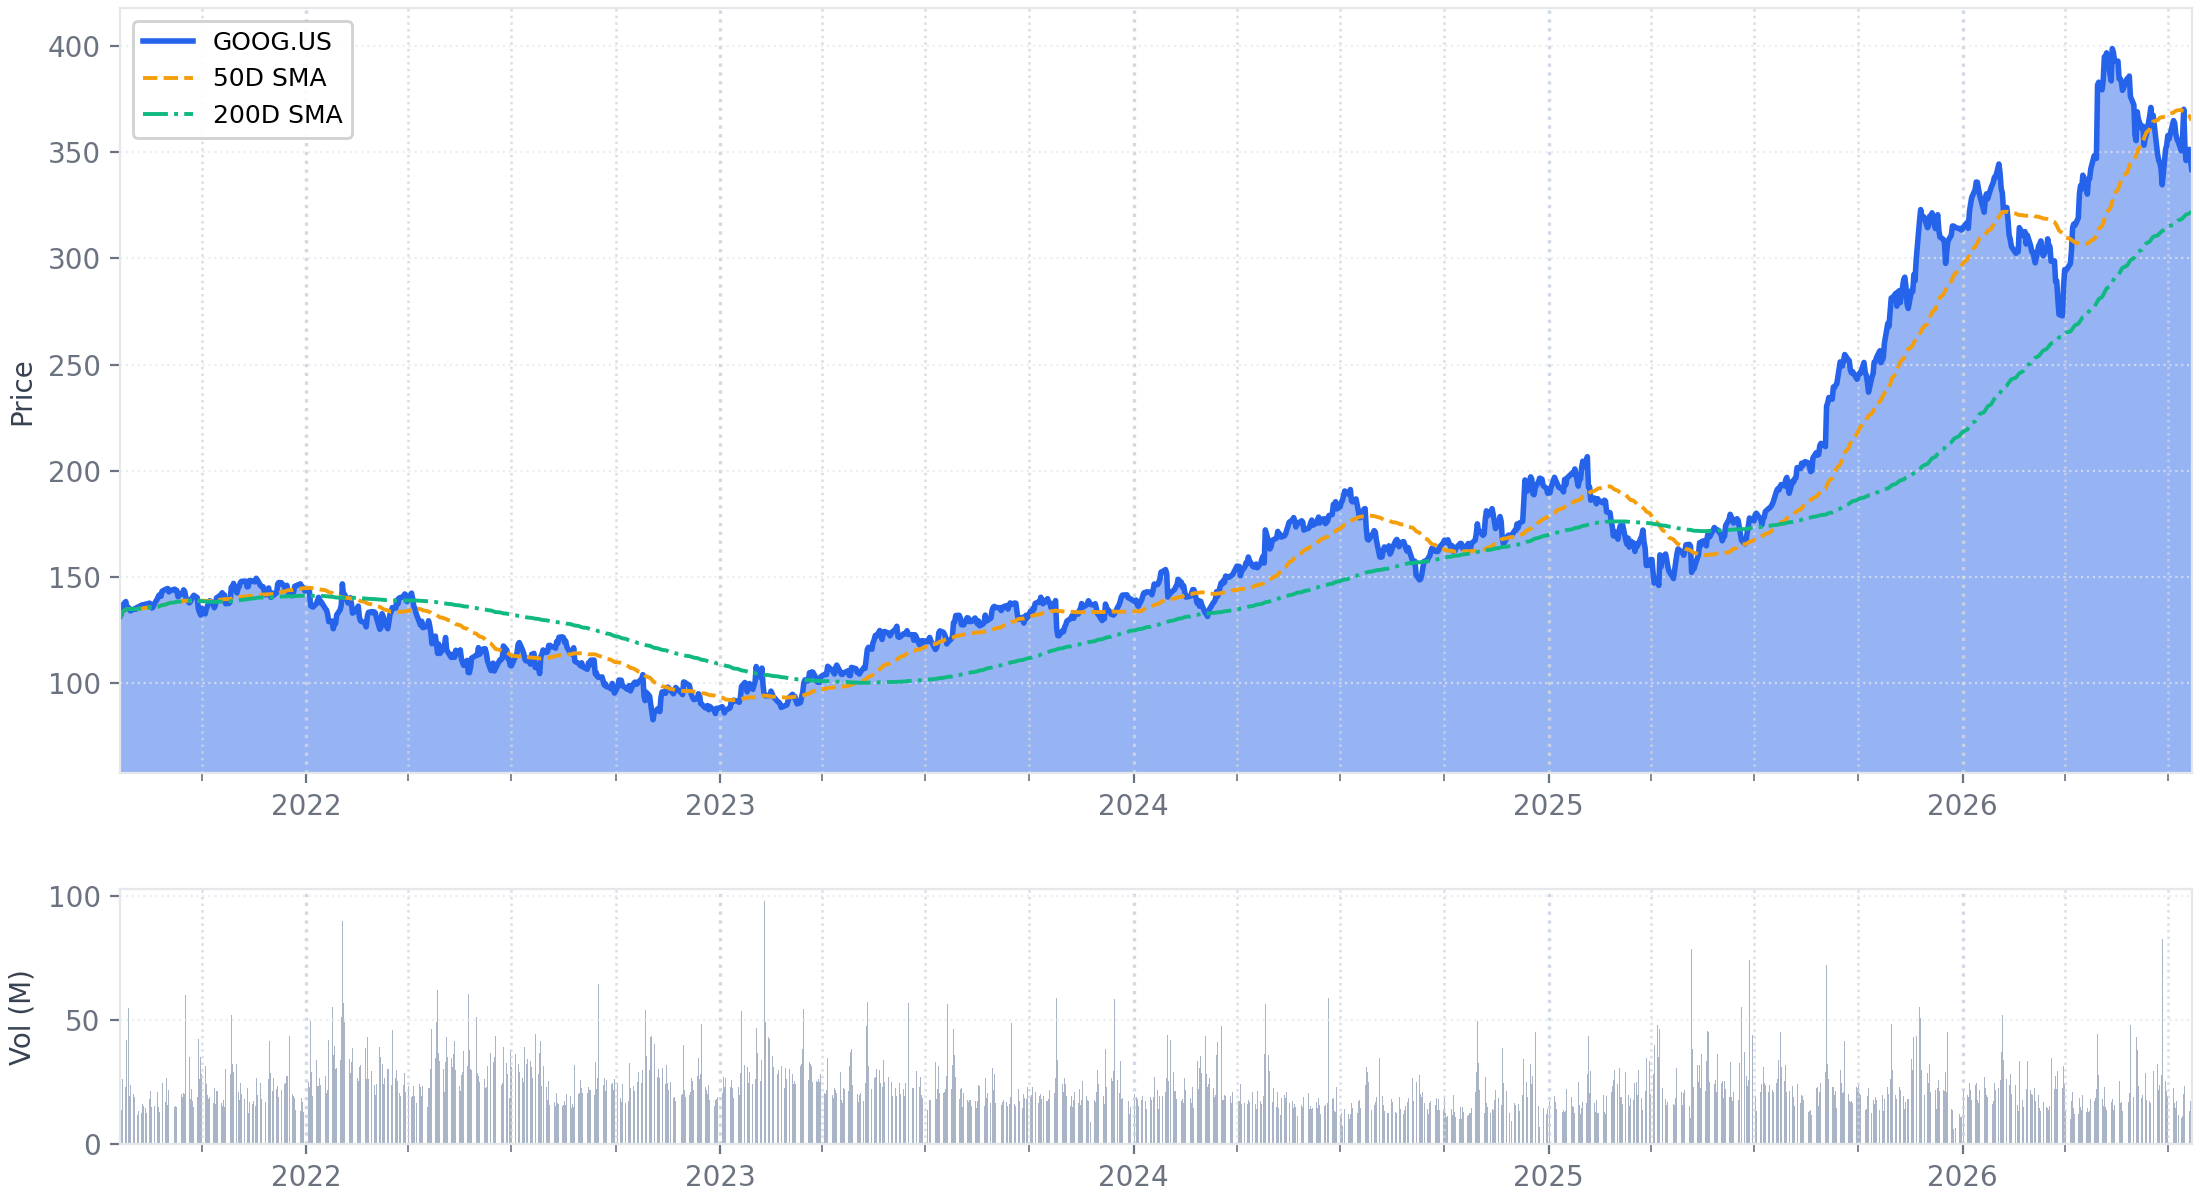
Executive Summary
Alphabet reported consolidated revenues of $119.8 billion (+24% YoY), driven by sustained AI momentum across its business. The key growth engine, Google Cloud, saw revenue growth accelerate to 82% YoY, underscored by a $52 billion sequential increase in its backlog to $514 billion. Performance in the core business also remained robust, with Search & other revenue growing 17% YoY as AI-powered features drove search usage to an all-time high during the World Cup.
To meet this demand, the company is escalating its multi-year investment cycle, raising its full-year 2026 CapEx guidance for the second consecutive quarter to a new range of $195-$205 billion. To support this unprecedented spend, Alphabet proactively fortified its balance sheet, raising nearly $70 billion from new debt and equity issuances. The direct financial impact of this ramp was evident, with Q2 free cash flow turning negative to ($5.9) billion.
Management confirmed it remains supply-constrained for the fifth consecutive quarter, introducing a new "bridging strategy" using more expensive third-party capacity which will create "modest margin pressure" on Cloud in the near term. The results confirm AI as a proven, accelerating commercial engine, justifying the massive capital deployment. This strategy reshapes the company's financial profile toward sustained high capital intensity and pressured free cash flow, making the efficient execution of its infrastructure build-out the central determinant of future returns.
1. Financial Performance Summary
A. Income Statement Metrics
Alphabet reported Q2 2026 consolidated revenues of $119.8 billion, a 24% increase year-over-year (23% in constant currency), marking the company's 12th consecutive quarter of double-digit growth. Performance was driven by a 17% expansion in Search & other revenue and a significant 82% acceleration in Google Cloud revenue.
Operating income grew 30% to $40.8 billion, with the operating margin expanding by approximately 160 basis points to 34.0%. Net income saw a substantial increase of 298% to $112.1 billion, primarily due to $98.0 billion in "Other income", which reflects net unrealized gains on the company's equity securities portfolio.
| Metric | Q2 2026 | Q2 2025 | Change | Notes |
|---|---|---|---|---|
| Total Revenues | $119.8B | $96.4B | +24.2% | +23% in constant currency. |
| Google Services | $94.5B | $82.5B | +14.5% | Driven by strong growth in Search and Subscriptions. |
| Google Search & other | $63.3B | $54.2B | +16.8% | Growth was led by the retail and finance verticals. |
| YouTube ads | $11.1B | $9.8B | +12.9% | Growth driven by direct response and brand, with strength related to the World Cup. |
| Google Network | $7.3B | $7.4B | -0.7% ↓ | — |
| Subscriptions, Platforms & devices | $12.9B | $11.2B | +15.2% | Strong growth in YouTube subscriptions and Google One AI plans. |
| Google Cloud | $24.8B | $13.6B | +81.8% | Significant acceleration driven by enterprise AI solutions and infrastructure, including first-time recognition of TPU system sales. |
| Other Bets | $0.38B | $0.37B | +2.4% ↑ | — |
| Hedging gains (losses) | $0.11B | ($0.11B) | N/M | Reconciling item to total revenues. |
| GAAP Operating Income | $40.8B | $31.3B | +30.4% | Operating margin was 34.0%, up from 32.4% YoY. |
| Google Services | $39.5B | $33.1B | +19.6% | Margin expanded to 41.8% from 40.1% YoY. |
| Google Cloud | $8.8B | $2.8B | +211.9% | Margin expanded significantly to 35.6% from 20.7% YoY. |
| Other Bets (Loss) | ($1.8B) | ($1.2B) | +44.4% ↑ | Loss widened year-over-year. |
| GAAP Net Income | $112.1B | $28.2B | +297.6% | Includes $99.0B in pre-tax gains on equity securities. |
| GAAP EPS (Diluted) | $9.11 | $2.31 | +294.4% | — |
B. Balance Sheet Highlights
Alphabet's balance sheet expanded significantly, with total assets reaching $922.0 billion. The company executed substantial capital raises, issuing a net $49.6 billion in equity and mandatory convertible preferred stock and $20.3 billion in net proceeds from senior unsecured notes. This increased cash and marketable securities to $242.5 billion and resulted in a net cash position of $129.7 billion.
| Metric | Jun 30, 2026 | Dec 31, 2025 | Change | Notes |
|---|---|---|---|---|
| Cash & Marketable Securities[1] | $242.5B | $126.8B | +91.2% ↑ | Boosted by significant equity and debt issuances during the quarter. |
| Total Debt[2] | $112.8B | $59.3B | +90.2% ↑ | Increase driven by a $20.3B (net) issuance of senior unsecured notes. |
| Net Cash[3] | $129.7B | $67.5B | +92.1% ↑ | Net cash position increased significantly due to capital raises. |
| Property & Equipment, net | $321.2B | $246.6B | +30.3% ↑ | Reflects significant CapEx investments, primarily in AI infrastructure. |
| Goodwill | $57.8B | $33.4B | +73.1% ↑ | Increase reflects recent acquisitions. |
| Total Assets | $922.0B | $595.3B | +54.9% ↑ | — |
| Shareholders' Equity | $640.5B | $415.3B | +54.2% ↑ | Increase driven by net income and equity issuance. |
Footnotes
- Cash & Marketable Securities is calculated as Cash and cash equivalents + Marketable securities from the consolidated balance sheet. Jun 30, 2026: $55,911M + $186,563M = $242,474M.
- Total Debt is the sum of Long-term debt and Operating lease liabilities. Jun 30, 2026: $98,165M + $14,591M = $112,756M. Dec 31, 2025: $46,547M + $12,744M = $59,291M.
- Net Cash is calculated as Total Cash and Marketable Securities less Total Debt. Jun 30, 2026: $242,474M - $112,756M = $129,718M. Dec 31, 2025: $126,843M - $59,291M = $67,552M.
C. Cash Flow Analysis
For the six months ended June 30, 2026, Alphabet generated $84.9 billion in operating cash flow. Capital expenditures surged to $80.6 billion as the company accelerated its AI infrastructure build-out. This resulted in year-to-date free cash flow of $4.3 billion, a sharp decrease from the prior year period. The company completed significant financing activities, issuing a net $51.0 billion in debt and $37.5 billion in equity.
| Metric | YTD 2026 | YTD 2025 | Change | Notes |
|---|---|---|---|---|
| Operating Cash Flow | $84.9B | $63.9B | +32.8% | — |
| Capital Expenditures | ($80.6B) | ($39.6B) | +103.3% ↑ | Investments overwhelmingly focused on technical infrastructure for AI. |
| Free Cash Flow (GAAP)[1] | $4.3B | $24.3B | -82.4% ↓ | YTD FCF decreased sharply due to the significant ramp in CapEx. Q2 FCF was negative $5.9B. |
| Share-Based Compensation | $14.7B | $11.5B | +27.7% ↑ | Represents a material non-cash adjustment to operating cash flow. |
| Dividend Payments | ($5.2B) | ($5.0B) | +5.1% ↑ | — |
| Share Issuances / (Repurchases) (Net)[2] | +$37.5B | ($34.0B) | N/M | Shift from net repurchases to net issuance reflects a $30.5B common stock raise and a $19.1B preferred stock raise in Q2. |
| Net Debt Issuance / (Repayment)[3] | +$51.0B | +$13.0B | +292.1% ↑ | Primarily reflects the issuance of new debt in both Q1 and Q2. |
Footnotes
- Free Cash Flow is calculated as Net cash provided by operating activities less purchases of property and equipment. YTD 2026: $84,859M - $80,598M = $4,261M.
- Net Share Issuances of +$37.5B for YTD 2026 consists of +$30,499M in proceeds from common stock, +$19,063M from preferred stock, offset by -$12,056M in net payments for stock-based awards. YTD 2025 net repurchases of ($34.0B) consisted of ($28.3B) in repurchases and ($5.7B) in net payments for stock-based awards.
- Net Debt Issuance of +$51.0B for YTD 2026 consists of +$56.2B in proceeds from debt issuance, net of costs, less ($5.3B) in repayments of debt.
D. Key Financial Ratios
| Metric | Q2 2026 | Notes |
|---|---|---|
| Gross Margin[1] | 61.7% | — |
| Operating Margin | 34.0% | — |
| Net Profit Margin[2] | 93.7% | Significantly impacted by unrealized gains on equity securities. |
| Return on Equity (Annualized)[3] | 85.0% | Significantly impacted by unrealized gains on equity securities. |
| Current Ratio[4] | 2.72 | — |
| Debt-to-Equity[5] | 0.18 | — |
Footnotes
- Gross Margin = (Revenues - Cost of revenues) / Revenues = ($119,796M - $45,943M) / $119,796M.
- Net Profit Margin = Net Income / Revenues = $112,193M / $119,796M. Includes a $99.0B pre-tax gain on equity securities.
- Return on Equity (Annualized) = (Quarterly Net Income * 4) / Average Shareholders' Equity. Average Equity based on Jun 30, 2026 and Dec 31, 2025 balances.
- Current Ratio = Total current assets / Total current liabilities = $343,524M / $126,111M.
- Debt-to-Equity = Total Debt / Total stockholders' equity = $112,756M / $640,480M.
E. Operational Metrics
Alphabet reported strong growth in key AI and Cloud metrics, indicating sustained commercial momentum and user adoption. The Google Cloud backlog continued to expand, building on a strong Q1, and user engagement with AI features like the Gemini app and AI Mode in Search hit new milestones.
| Metric | Q2 2026 | Prior Period Reference (Q1 2026) | Notes |
|---|---|---|---|
| Overall / AI | |||
| Gemini App Monthly Active Users | 950 Million | N/A | New disclosure. DAUs reported to have tripled over the last year. |
| Model API Token Processing | 22 Billion per minute | > 16 Billion per minute | +37.5% QoQ. Highlights accelerating API usage of models like Gemini by customers. |
| Gemini Enterprise Adoption | Nearly 90% of Fortune 100 | 40% QoQ growth in paid MAU | Metric changed from growth rate to penetration of top enterprises, indicating wide adoption. |
| Developer Community | > 9 Million developers | N/A | New disclosure highlighting ecosystem engagement. |
| Cloud | |||
| Cloud Backlog | $514 Billion | $462 Billion | +11.3% QoQ. Backlog increased by $52 billion sequentially, demonstrating continued strong demand. |
| New Customer Acquisition Velocity (YoY) | More than doubled | Doubled | Sustained momentum in new customer wins. |
| Existing Customer Expansion | Exceeded commitments by >50% | Outpaced commitments by 45% | Acceleration in expansion with existing customers. |
| Search | |||
| AI Mode Monthly Active Users | > 1 Billion | N/A | New disclosure showing significant scale for the AI-native search experience. |
| YouTube | |||
| Ask YouTube Engagement (June) | > 140 Million users | N/A | New disclosure for the conversational AI feature on the watch page. |
2. Forward-Looking Guidance
A. Guidance Summary
Management raised its full-year 2026 capital expenditure guidance for the second consecutive quarter, citing accelerated delivery of capacity to meet strong demand. The company also introduced new commentary on near-term margin pressure in the Cloud segment due to the use of third-party capacity as a bridging strategy.
| Metric | Period | Current Guidance | Prior Guidance (from Q1'26 Call) | Change | Management Commentary |
|---|---|---|---|---|---|
| Capital Expenditures | FY 2026 | $195B - $205B | $180B - $190B | Raised | The increase of $15B at both ends of the range is "primarily due to an acceleration in the delivery of capacity to meet growing demand." |
| Capital Expenditures | FY 2027 | To "increase significantly" vs. 2026 | To "significantly increase" vs. 2026 | Maintained | Management continues to signal a sustained, multi-year investment cycle and will provide more details at a later date. |
| Foreign Exchange Impact | Q3 2026 | "Slight FX headwind" (on Total Revenue) | N/A | New Guidance | Based on current spot rates, this would primarily impact Search and YouTube ads. This compares to a 1 percentage point FX tailwind in Q2. |
| Google Cloud Operating Margin | Q3 2026 / Near-term | "Modest margin pressure" | "Low single-digit" % point headwind for remainder of 2026 | Updated Rationale | The driver of near-term margin pressure has shifted. The prior guidance was related to the Wiz acquisition; the current pressure is due to the use of more expensive third-party capacity as a "bridging strategy" while internal capacity is built. |
B. Additional Notes & Commentary
- Google Services Revenue: Management noted that in Q3, the business will begin lapping an acceleration in Search performance that began in the third quarter of last year.
- Google Cloud Revenue: The company continues to see significant demand which is expected to drive strong growth.
- TPU System Sales: Management reiterated that it expects to recognize a relatively small portion of revenues from existing TPU system sales agreements in 2026, with the ramp occurring as the year exits. The vast majority of these revenues are anticipated to be realized in 2027.
- Operating Expense Pressure: The significant investments in technical infrastructure will continue to pressure the P&L through higher depreciation and related data center costs (e.g., energy). The company also expects to continue hiring in key areas like AI and Cloud and investing in marketing for its AI products.
- Free Cash Flow: Management explicitly stated that free cash flow is expected to remain "under pressure", driven by the substantial investments in technical infrastructure required to address the AI opportunity.
3. Operational & Strategic Developments
A. Business Performance & Operations
Alphabet's operational results showed sustained, broad-based momentum driven by AI adoption across its segments. Google Cloud continued its rapid expansion, Search usage hit new highs, and key AI engagement metrics accelerated from the prior quarter.
-
Google Cloud Momentum Continues: The segment's strong performance from Q1 was sustained, with revenue growth accelerating to 82% YoY. Management noted that growth accelerated meaningfully even after excluding the impact of first-time TPU system sales.
- The commercial pipeline remained robust, with the Cloud backlog increasing by $52 billion sequentially to $514 billion.
- The pace of new business wins remained high, with new customer acquisition velocity more than doubling YoY, consistent with Q1.
- Existing customers are expanding their usage at an accelerating rate, exceeding their commitments by more than 50%, an increase from the 45% rate reported in Q1.
-
AI-Powered Search Drives Record Usage: Search & other revenue grew by a strong 17% YoY.
- Management highlighted that Search usage hit an all-time high during the 2026 World Cup.
- The AI-native search experience, AI Mode, has surpassed 1 billion monthly active users since its global expansion in October 2025.
- Management stated AI Mode is driving an incremental increase in overall search queries.
-
AI Platform & Subscription Momentum Accelerates: Underlying AI adoption metrics showed continued strength, and the Gemini app reached a significant scale.
- Direct API usage of first-party models grew 37.5% sequentially to process 22 billion tokens per minute, up from 16 billion in Q1.
- The Gemini app now has 950 million monthly active users, with daily active users having tripled over the last year.
-
YouTube Benefiting from Global Events: YouTube advertising revenue grew 13% YoY, benefiting from strong advertiser interest around the World Cup. Management noted that YouTube subscriptions continue to grow faster than ads.
-
Other Bets Shows Progress: Waymo introduced its sixth-generation vehicle, and Wing surpassed 1 million home deliveries. Isomorphic Labs raised over $2 billion to advance its AI drug design platform.
B. Strategic Initiatives
Alphabet's strategy is centered on an aggressively escalating, multi-year investment cycle in AI infrastructure, now supported by significant external capital raises and a tactical use of third-party capacity to bridge near-term supply gaps.
-
Aggressive AI Infrastructure Investment (Persistent/Escalating): The company is again intensifying its capital commitment, signaling that the current spending level is a new baseline to meet overwhelming demand. FY 2026 CapEx guidance was raised for the second consecutive quarter, attributed to an "acceleration in the delivery of capacity," as detailed in the guidance section. Management maintained its outlook for FY 2027, stating that CapEx is expected to "increase significantly" compared to 2026.
-
Fortifying the Balance Sheet for Sustained Investment (New): In a significant strategic shift, the company executed major capital raises to support its investment plans. In Q2, it raised a net $49.6 billion from equity and mandatory convertible preferred stock and $20.3 billion in net proceeds from debt. This provides substantial liquidity to fund the multi-year CapEx ramp.
-
Bridging Supply Gaps with Third-Party Capacity (New): In response to persistent supply constraints, management disclosed a new "bridging strategy" to expand the use of third-party capacity in Q3. While this allows the company to continue capturing customer demand, it is expected to create "modest margin pressure" in the Cloud segment in the near term.
-
Driving AI Efficiency to Manage Costs (Persistent/Quantified): Continuing a key theme, management highlighted progress in managing the cost of AI. This quarter, it was noted that the cost of AI Mode responses reached its lowest level since launch, achieved through engineering and hardware optimizations even as capabilities have advanced.
-
Advancing Frontier AI Models (Persistent): The company is training Gemini 4, described as its "most ambitious pretraining run yet." It also launched more efficient models (Gemini 3.6 Flash, 3.5 Flashlight) and a specialized cybersecurity model (Gemini 3.5 Flash Cyber) to meet specific customer needs around performance and cost.
C. Risk Factors & Headwinds
-
Financial Health Indicators
- Negative Free Cash Flow from Massive Investment: As a direct result of accelerated CapEx, the company reported significant negative free cash flow in Q2. Management explicitly stated that free cash flow will "remain under pressure," directly linking the decline to its strategic investments in technical infrastructure.
- Accelerating Capital Commitments: The repeated increase in CapEx guidance underscores the immense capital intensity of the company's AI strategy. This will continue to create a substantial headwind from higher depreciation expense, which will pressure future operating margins.
- Shift in Capital Structure: The company's large-scale equity and debt issuances in Q2 mark a significant change from its historical reliance on internally generated cash flow to fund operations and investments. While this strengthens the balance sheet, it also increases leverage and shareholder dilution.
-
Operational Challenges
- AI Infrastructure Supply Constraints (Persistent/Intensifying): This remains the most significant operational bottleneck, now for the fifth consecutive quarter. The issue appears to have intensified, as management has now implemented a "bridging strategy" using more expensive third-party capacity. This indicates the internal supply-demand imbalance is severe enough to warrant a tactical trade-off on near-term Cloud margins to avoid losing customer momentum.
-
Reporting and Transparency Issues
- Inconsistent Gemini Enterprise Adoption Metric (Persistent): For the third consecutive quarter, the company has changed the key metric used to describe the adoption of Gemini Enterprise, making it difficult to consistently track the product's growth trajectory.
- Q4 2025: Disclosed a hard number of "> 8 Million Paid Seats."
- Q1 2026: Shifted to a growth rate: "paid monthly active users grew 40% quarter-over-quarter."
- Q2 2026: Changed again to a penetration metric: "Nearly 90% of Fortune 100 are using Gemini Enterprise." This lack of a consistent, quantifiable metric obscures the underlying growth rate and scale of this key product.
- Inconsistent Gemini Enterprise Adoption Metric (Persistent): For the third consecutive quarter, the company has changed the key metric used to describe the adoption of Gemini Enterprise, making it difficult to consistently track the product's growth trajectory.
4. Q&A Session Key Themes
A. Analyst Focus Areas
The Q&A session was dominated by questions aimed at understanding the financial and operational implications of Alphabet's escalating investment in AI. Analysts focused on the sustainability of the company's capital deployment, its competitive position at the frontier of AI model development, and the long-term strategy for its custom silicon (TPUs).
-
AI Model Competitiveness & Development Cadence (Recurring & Intensified): A primary focus was on Google's ability to maintain a leading position in AI model development. Analysts questioned the company's confidence in keeping its Gemini models at the frontier, with one analyst noting that Google "perhaps doesn't make maybe quite as much noise as some of the other leading labs." CEO Sundar Pichai acknowledged the dynamic nature of the AI frontier and specific areas needing improvement, such as "agentic coding." He expressed strong confidence in the company's roadmap, highlighting the "ambitious" training of the next-generation Gemini 4 model as essential to competing at the frontier level.
-
Capital Allocation & Investment Returns (Recurring & Intensified): This theme, central in the prior quarter, intensified following the second consecutive raise in CapEx guidance. Analysts probed the return on investment (ROIC) for GenAI and the philosophy behind the escalating CapEx budget. Management framed the investments as a long-term, multi-year strategy to capture an "extraordinary" secular opportunity, reiterating that they operate under a disciplined ROIC framework and that strong demand, which continues to outpace supply, validates the investment thesis.
-
TPU Strategy: Internal vs. External Allocation (Evolving): Building on Q1's introduction of external TPU sales, analysts sought more detail on the strategic balancing act. Mr. Pichai outlined a clear allocation hierarchy: the first priority is securing compute for internal AGI development at the frontier. Beyond that, capacity is prioritized for core products (Search, YouTube) and Cloud customers using first-party models. Selling TPU systems directly to customers for their own data centers is used as a way to balance this demand.
-
Capital Structure & Recent Financing (New): Following the significant equity and debt raises during the quarter, analysts questioned the company's thinking on its optimal capital structure. CFO Anat Ashkenazi explained that the company's funding strategy prioritizes cash from operations first, followed by debt, and most recently, equity, with the goal of maintaining a "resilient" and "healthy balance sheet" capable of supporting the multi-year investment cycle.
B. Key Challenges & Concerns
The primary concern woven through the Q&A was whether Alphabet can simultaneously win the AI technology race and deliver attractive financial returns amidst an unprecedented, escalating investment cycle.
- The Core Challenge: Perceived Pace vs. Massive Spend: Analysts subtly challenged management on two fronts. First, a direct question from JP Morgan implied a perception that Google's pace of releasing frontier models may be lagging peers. Second, persistent questions about ROIC and CapEx reflect a deep-seated concern about the financial discipline and ultimate payoff of spending nearly $200 billion in a single year.
- Management's Defense: Management's response was a two-pronged defense of its strategy:
-
- On Technology: They asserted confidence in their long-term technical roadmap, pointing to the ambitious Gemini 4 model as the key to re-establishing a clear frontier position, while also highlighting the commercial success and efficiency of their "workhorse" Flash models.
-
- On Financials: They argued that the spending is not speculative but is a direct response to overwhelming, tangible demand. The consistent message was that they are investing from a position of strength, guided by a long-term ROIC framework, into a secular growth opportunity that has only become more apparent over the past year.
-
5. Strategic Themes & Inflection Points
A. Current Period Themes
- Shift to a Fortified, Multi-Year Investment Cycle: The central theme has evolved from a massive capital commitment to a sustained, multi-year investment escalation that is now being explicitly supported by external capital. The company's proactive $70 billion capital raise from debt and equity in Q2 marks a significant strategic shift, fortifying the balance sheet to fund the repeatedly raised CapEx guidance (now $195B-$205B for FY26) and the "significant increase" planned for FY27.
- AI Commercialization is Broadening and Accelerating: The narrative has progressed from an inflection point in Cloud to a story of broad-based, AI-driven momentum across all key segments. This was demonstrated by Cloud revenue accelerating to 82% YoY, Search usage hitting an all-time high, the Gemini app reaching 950 million MAUs, and API token processing growing 37.5% sequentially.
- Tactical Flexibility to Overcome Supply Constraints: While the company remains supply-constrained, the strategy for managing it has evolved. Management introduced a new "bridging strategy" using more expensive third-party capacity. This is a pragmatic tactical shift indicating that the supply-demand imbalance is acute enough to warrant a deliberate trade-off on near-term Cloud margins in order to maintain customer momentum.
- Dual Mandate of Massive Investment and Rigorous Cost Discipline (Consistent Messaging): For the third consecutive quarter, management highlighted tangible progress in managing AI-related costs. The disclosure that the cost of AI Mode responses has reached its lowest level since launch reinforces the operational discipline of funding the unprecedented investment cycle by continuously driving efficiency improvements.
B. Future Considerations
- The Gemini 4 Frontier as the Next Competitive Test: Management has explicitly positioned the upcoming Gemini 4 model as the key to competing at the "frontier level" of AI. The successful development and deployment of this model will be a critical test of Alphabet's R&D execution and its ability to maintain a leadership position in the rapidly advancing AI technology race.
- Executing a Multi-Hundred-Billion-Dollar Build-Out Amid Persistent Constraints: The most significant forward-looking challenge remains the execution of the massive infrastructure build-out. The new "bridging strategy" is a near-term solution, but the long-term ability to efficiently secure and deploy internal capacity will remain the primary governor on growth velocity and the ultimate determinant of the return on this historic capital investment.
- The Reshaping of Alphabet's Financial Profile: The significant capital raises and negative free cash flow in Q2 represent a fundamental and accelerated shift in the company's financial model compared to its historical reliance on internally generated cash. Investors will need to monitor the management of this more leveraged and complex balance sheet and assess whether this becomes a recurring financing strategy.
6. Key Items to Monitor Next Quarter
A. Prior Quarter Monitoring Review
The company provided substantive updates on all key items identified in the prior quarter, demonstrating significant and accelerating progress in its AI-driven strategy, particularly in commercialization, infrastructure investment, and operational efficiency.
| Prior Item | Current Status | Management Commentary |
|---|---|---|
| Multi-Year CapEx Escalation & Financial Profile | On Track | The commitment was escalated further. FY 2026 CapEx guidance was raised for the second consecutive quarter to $195B-$205B, and management maintained its guidance for a "significant increase" in FY 2027. The company reported negative free cash flow of $5.9B in Q2 and proactively raised ~$70B in debt and equity to fortify the balance sheet for this sustained investment cycle. |
| Google Cloud's AI-Driven Commercial Momentum | On Track | Momentum continued and accelerated in some areas. Cloud revenue growth accelerated to 82% YoY, and the backlog grew by $52 billion sequentially to $514 billion. Existing customer expansion accelerated, with customers exceeding their commitments by over 50%, up from 45% in Q1. |
| AI Infrastructure Supply Constraint Impact | On Track | The constraint remains a critical issue. Management confirmed it is still "in a supply-constrained environment" for the fifth consecutive quarter. The issue's severity prompted a new "bridging strategy" to use more expensive third-party capacity in Q3, which is expected to create near-term margin pressure on the Cloud segment. |
| Direct TPU Hardware Sales Initiative | On Track | The initiative moved from plan to execution. Management confirmed that the company "began to recognize revenues from TPU system sales" for the first time in Q2. It reiterated that the majority of revenue from existing agreements will be recognized in 2027. |
| "Agentic Commerce" Live Performance & Rollout | On Track | The ecosystem continued to expand. Management announced that Target and Steve Madden are now live on the Universal Commerce Protocol (UCP). The company also introduced "Universal Card," a new feature allowing for a single checkout across different retailers. |
B. Current Quarter Focus Items
Based on the Q2 earnings call, the following non-guidance items are critical for assessing Alphabet's strategic execution and operational trajectory in the upcoming quarters.
| Category | Item | Timeline | What to Monitor | Why It Matters |
|---|---|---|---|---|
| Strategic / Risk | Gemini 4 Frontier Model Development | Ongoing | Any announcements regarding the training progress, release timeline, and benchmark performance of the Gemini 4 model. Monitor for specific improvements in areas management called out as needing work, such as "agentic coding." | Management has explicitly positioned Gemini 4 as the key to competing at the "frontier level" against other leading AI labs. A successful and timely launch is critical to validating Alphabet's R&D execution and maintaining its technological leadership in the AI race. |
| Risk / Operational | Execution of Third-Party Capacity "Bridging Strategy" | Q3 2026 / Near-term | The magnitude and duration of the "modest margin pressure" on Google Cloud in Q3 and beyond. Monitor commentary on whether this strategy is sufficient to meet customer demand or if supply constraints continue to gate revenue growth. | This new strategy is a direct response to persistent, severe supply constraints. Its effectiveness will determine if Alphabet can maintain customer momentum without permanently damaging Cloud's margin profile or losing deals to competitors with more available capacity. |
| Strategic / Financial | Capital Management & Balance Sheet Strategy | Ongoing | The company's approach to future financing needs, particularly any further use of equity or debt markets. Monitor the deployment of the ~$70B raised in Q2 and its alignment with the escalating CapEx cycle. | The shift to large-scale external financing marks a fundamental change in Alphabet's capital structure. Effective management is crucial to funding the multi-year AI investment cycle while maintaining a "resilient balance sheet" and managing shareholder dilution. |
| Opportunity / Operational | Monetization of New AI-Powered Search Experiences | Next Quarter / Ongoing | The performance of new ad formats within AI Mode, such as "direct offers" and "highlighted answers." Monitor for any quantitative data on monetization rates or advertiser ROI for queries that include AI Overviews or are conducted in AI Mode. | With AI Mode now exceeding 1 billion MAUs, effective monetization is critical to ensuring that the shift in user behavior to more complex, conversational queries translates into sustained, high-margin revenue growth for the core Search business. |
| Opportunity / Operational | YouTube's Commerce and Subscription Growth | Ongoing | The adoption and performance of new commerce features like "Buy with Google Pay" on CTVs. Monitor for continued commentary on the growth rate of YouTube subscriptions (Music/Premium) relative to ads and any new subscription offerings. | Developing robust commerce and subscription revenue streams is key to diversifying YouTube's monetization beyond advertising. Success on the CTV platform, in particular, could unlock a significant new performance marketing channel and increase the platform's overall ARPU. |
Appendix: Quotes by Theme
Management Sentiment & Strategic Confidence
- Conviction in a Multi-Year, Escalating Investment Cycle: Management's confidence in the return profile of its massive AI investments has grown, framing the escalating CapEx not as a cost burden but as a response to an even larger-than-anticipated secular opportunity.
"I think we are taking a full stack approach. We are seeing momentum across consumers and enterprises and developers and so on. So it feels like, if anything, over the past year, we've gotten more bullish on the opportunities ahead." — Sundar Pichai, CEO
vs Q1-FY26:
"Looking ahead, the strong results reinforce our conviction to invest the capital required to continue to capture the AI opportunity. And as a result, we expect our 2027 CapEx to significantly increase compared to 2026." — Anat Ashkenazi, CFO
- Confidence in Frontier AI Model Development: In response to analyst questions about its competitive position, management acknowledged the dynamic landscape but asserted strong confidence in its ability to compete at the highest level with its next-generation model, Gemini 4.
"We are now training Gemini 4, and we're being very ambitious with it. I am very excited by the progress I'm seeing internally on Gemini 4, and I'm confident that people will be pleased when we are putting it outside. But we will need Gemini 4 as a larger base model to compete at that frontier level." — Sundar Pichai, CEO
Business Strategy & Transformation Signals
- New "Bridging Strategy" to Overcome Acute Supply Constraints: The company has formalized a new tactical response to its persistent supply constraints, explicitly choosing to accept near-term margin pressure in its Cloud segment to maintain customer momentum.
"Given the supply constrained environment we're in, we are planning to expand the use of third-party capacity in Q3 as a bridging strategy while we continue to build out internal capacity. That capacity, given the cost of that capacity will put some pressure on operating margins for cloud." — Anat Ashkenazi, CFO
vs Q1-FY26 (Acknowledging the constraint's impact):
"Obviously, we are compute constrained in the near term. And as an example, our cloud revenue would have been higher if you were able to meet the demand." — Sundar Pichai, CEO
- Fortifying the Balance Sheet for a Sustained Investment Cycle (New Strategy): Management explained the significant Q2 capital raises as a strategic move to ensure the company has a "resilient" balance sheet to fund its multi-year, high-intensity investment program.
"We also want to make sure we have a resilient, not just growth outlook but also a resilient balance sheet and a strong balance sheet, a healthy balance sheet, which is the rationale behind expanding into the equity markets." — Anat Ashkenazi, CFO
- Consistent Discipline on AI Cost Efficiency: For the third consecutive quarter, management highlighted a specific metric demonstrating progress in managing the operational costs of AI, positioning this efficiency as a key enabler of its massive investment strategy.
"Thanks to our engineering and hardware optimizations this quarter, we reduced the cost of AI mode responses to its lowest level since launch even as we have brought more advanced AI capabilities." — Sundar Pichai, CEO
vs Q1-FY26:
"And since upgrading AI overviews and AI mode to Gemini 3, we’ve reduced the cost of core AI responses by more than 30%..." — Sundar Pichai, CEO
vs Q4-FY25:
"We were able to lower Gemini serving unit costs by 78% over 2025..." — Sundar Pichai, CEO
Risk Assessment & Analyst Concerns
- Intensified Analyst Focus on AI Model Competitiveness: The Q&A revealed persistent analyst concern about the perceived pace of Google's frontier model development relative to competitors, prompting direct questions about its ability to maintain leadership.
"Sundar, can you just talk about your confidence level that the Gemini models can remain at the frontier... Google perhaps doesn't make maybe quite as much noise as some of the other leading labs or perhaps have quite the frequency. Just curious how you'd address any concerns about that ability to continue developing leading models?" — Douglas Anmuth, Analyst, JPMorgan
- Persistent Focus on the Justification and Returns of Massive CapEx: Following the second consecutive increase in CapEx guidance, analysts continued to press management on the financial rationale and return profile of the unprecedented spending levels.
"Sundar with more time in GenAI products and tools in the market and investment continuing to step up, can you just kind of give us some perspective on how your view on the size of the overall GenAI ROIC opportunity and the timing of the ROIC has changed now versus 1 year ago." — Brian Nowak, Analyst, Morgan Stanley
vs Q1-FY26 (Similar focus):
"Anat, you talked about 2027 CapEx that it will increase significantly... how do you think about the current CapEx trajectory, the ability to service this massive backlog that you’ve built up...?" — Douglas Anmuth, Analyst, JPMorgan
Industry-Specific Intelligence (Technology & AI)
- AI Commercialization Narrative Evolves from Inflection Point to Broad-Based Acceleration: The strategic narrative has shifted from identifying AI as the primary driver in a single segment (Cloud in Q1) to highlighting its role as a broad-based growth engine redefining the entire company.
"Our AI investments are redefining what's possible across every part of our business. Q2 was an amazing quarter, with Alphabet revenues growing 24% year-over-year and Google Cloud revenues accelerating to 82% growth, driven by demand for AI infrastructure and AI solutions." — Sundar Pichai, CEO
vs Q1-FY26 (The inflection point):
"Our enterprise AI solutions have become our primary growth driver for cloud for the first time." — Sundar Pichai, CEO
- TPU Allocation Strategy Prioritizes Frontier R&D: Management provided a clear hierarchy for allocating its scarce custom silicon, with development of next-generation AI models taking precedence over all other internal and external demands.
"In terms of allocating TPUs, look, our first priority is making sure we are allocating what we need to compete at the frontier in terms of AGI development and so that is the foundation for everything we do." — Sundar Pichai, CEO
Historical Performance